Modeling SiGe through classical molecular dynamics simulations: chasing an appropriate empirical potential
5
0
0
Texto completo
(2) Modeling SiGe through classical molecular dynamics simulations: chasing an appropriate empirical potential Luis Martı́n, Iván Santos* , Pedro López, Luis A. Marqués, Marı́a Aboy, Lourdes Pelaz Dept. Electricidad y Electrónica, Universidad de Valladolid, 47011 Valladolid, Spain. * corresponding author: ivasan@tel.uva.es Abstract—We used classical molecular dynamics simulations to reproduce basic properties of Si, Ge and SiGe using different empirical potentials available in the literature. The empirical potential that offered the better compromise with experimental data was used to study the surface stability of these materials. We considered the (100), (100)2 × 1 and (111) surfaces, and we found the processing temperature range to avoid the structural degradation of studied surfaces. Index Terms—molecular dynamics simulations, empirical potentials, SiGe, surface stability. I. I NTRODUCTION SiGe has a great relevance in the semiconductor industry since it was first used in the 45 nm strained-Si CMOS technology node [1], to modern 3D structures such as quantum dots in optoelectronics [1], [2]. Further advances in these fields require an accurate knowledge of phenomena occurring at the atomic level, and atomistic simulations can be very helpful in this task [3]. Classical molecular dynamics (CMD) simulations offer a good balance between computational cost, system size, and simulation time. They resort on the numerical resolution of Newton’s equations of motion of the atoms of the system. Interactions among atoms are evaluated from analytical functions called empirical potentials that have to reproduce the properties of the modeled material. Being Si the base material of electronic devices, different potentials were developed to model it: Tersoff (TS) [4], Stillinger-Webber (SW) [5], [6], MEAM [7], and EDIP [8]. Among them, TS [4] and SW [5] have been traditionally used to study Si [6], [9], [9], [10]. In the case of SW, the original parametrization resulted in an incorrect value for the cohesive energy, and Nurminem et al. corrected it [6]. For Ge, Tersoff provided the parameters that modeled this material and the mixing rules for describing Si-Ge interactions [4]. In the case of SW, there are several parameterizations to model Ge [11]–[15]. The first ones were developed by Ding and Andersen for studying the crystalline and amorphous phases of Ge [11], and by Wang et al. for studying the vapor-liquid interface in Ge [12]. Both works modified the parameters of Si for reproducing the cohesive energy and elastic constants [11] or the binding energy and lattice constant This work has been funded by the Spanish Government under project number TEC2017-86150-P, and the JCyL Consejerı́a de Educación y Cultura under project numbers VA097P17 and VA119G18. [12] of crystalline Ge at 0 K. Nordlund et al. modified Ding and Andersen’s parameters to properly reproduce the melting temperature of Ge by reducing the cohesive energy 18% for studying collision cascades in Ge [13]. Posselt et al. also modified Ding and Andersen’s parameters to have a better overall description of the cohesive energy and the melting temperature of Ge for studying the amorphous phase and the solid phase epitaxial regrowth in Ge [14]. Finally, Yu et al. modified the parameters of Si for studying diffusion processes in liquid Ge [15]. In the case of SiGe, there are two different mixing rules for Si-Ge interactions within the SW potential [16], [17]. Laradji et al. [17] considered the arithmetic mean of the parameters of the potential to describe Si-Ge interactions, while Ethier et al. [16] used the arithmetic and the geometric mean for length and energy parameters, repectively [18]. A careful selection of Si and Ge potentials and mixing rules for SiGe is essential to extract meaningful results from CMD simulations. In this study, we systematically compared how different potentials reproduce basic properties of Si, Ge and SiGe. We focused on the lattice parameter (l0 ), the cohesive energy (Ecoh ) and the melting temperature (Tm ). l0 is key to describe the lattice mismatch on SiGe heterostructures. Ecoh is the depth of the potential well at the bonding distance and influences atom dynamics, i.e. how easily atoms can escape their lattice sites and diffuse. A correct Tm assures the agreement between simulated and experimental temperatures. The potential that offered the better compromise of l0 , Ecoh and Tm with experimental values for Si, Ge and SiGe was used to study the surface structural stability with temperature of these semiconductors. This information is essential to perform CMD simulations at the higher possible temperature to accelerate atomic dynamics, but avoiding the surface degradation. II. S IMULATION DETAILS We used LAMMPS code [19] for evaluating l0 , Ecoh and Tm and for studying the surface stability using CMD simulations. A. Lattice parameter (l0 ) and cohesive energy (Ecoh ) We relaxed the zinc-blende structure of Si, Ge and SiGe with different lattice parameters using a conjugate-gradients relaxation scheme, and we evaluated the energy and pressure of the relaxed structure. We used cubic simulation cells with dimensions of 8l0 ×8l0 ×8l0 and 4096 atoms. We calculated l0.
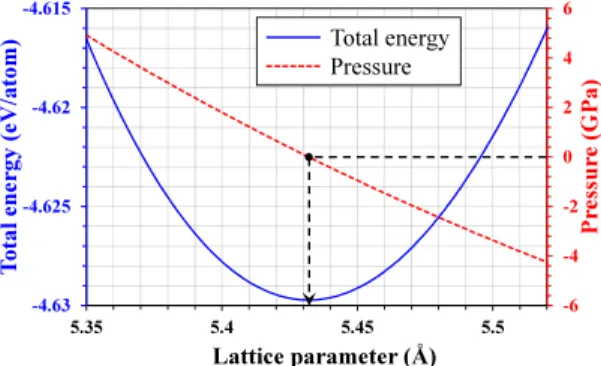
(3) 6. Total energy Pressure. a) (100). b) (100) 2x1. c) (111)-A. d) (111)-B. 4 2. -4.62. 0 -2. -4.625. Pressure (GPa). Total energy (eV/atom). -4.615. -4 -4.63 5.35. -6 5.4. 5.45. 5.5. Lattice parameter (Å). Fig. 1: Energy and pressure as a function of the lattice parameter for Si described with TS potential. Straight dashed lines are to guide the eye. and Ecoh from the minimum energy and zero pressure point, as it is shown in Fig. 1 for Si described with TS potential [4]. B. Melting temperature (Tm ) We simulated the coexistence of the solid and liquid phases at zero pressure as this liquid-solid system reaches an equilibrium state at Tm . For this purpose, we used a simulation cell with dimensions of 20l0 × 10l0 × 10l0 . Half of the simulation cell was melted by heating it to a temperature much higher than the expected Tm . Once the melting was completed, the liquid was cool down to a temperature T ′ close to the expected value of Tm . The other half of the simulation cell was kept in the crystalline phase, and it was equilibrated at T ′ . Once both parts of the sample were equilibrated at the same temperature T ′ , the system was let to evolve freely in the NVE ensemble with free surfaces in the elongated direction to assure zero pressure, and with a time step of 0.2 fs. In the case that T ′ & Tm , part of the crystalline region melts during the free evolution step, and the temperature is reduced. If T ′ . Tm , part of the liquid crystallizes and the temperature is increased. Thus, the system evolves towards the liquid-solid equilibrium, and once it is reached the temperature of the simulation corresponds to Tm . We let the system freely evolve to reach the equilibrium from 4 to 12 million time steps. C. Surface stability We analyzed the stability of (100) and (111) surfaces shown in Fig. 2. While (100) is the most common orientation used in conventional SiGe devices, (111) orientation can notably affect the morphology of the grown layer and it has been investigated for the fabrication of 3D structures [20]. In the case of (100) orientation, we considered the unreconstructed surface (Fig. 2.a) and the 2×1 reconstruction (Fig. 2.b). Atoms at these surfaces form two and three bonds with neighboring atoms, respectively. For (111) orientation, we considered the case where atoms at the surface form one bond with subsurface atoms, which will be named as “(111)-A” in the following (Fig. 2.c), and the case were they form three bonds with subsurface atoms, which will be named as “(111)-B” (Fig. 2.d). We performed annealing simulations during 500 ps at constant temperature in a range from 0.6Tm to Tm with a time. Fig. 2: Surface configurations considered. Dark and white atoms correspond to different elements only for SiGe. step of 0.5 fs. During annealing, we evaluated the atomic mean squared displacement (MSD) as MSD(t) =. N 2 ∑ |ri (t) − ri (0)|. N. i=1. ,. (1). being N the number of atoms in the group analyzed, and ri (t) the position of atom i at time t. Variations on MSD are associated to atomic rearrangements in the system. We also observed the surface atomic configuration at the end of the annealing to analyzed their structural integrity. III. R ESULTS AND DISCUSSION Table I summarizes the obtained values of l0 , Ecoh at 0 K and Tm for Si. These magnitudes were reported before [4]–[6], so they served as tests of our simulations. Selected potentials properly reproduce l0 , while Ecoh is well described only by TS [4] and Ref. [6] for SW. TS overestimates Tm , a well known limitation commonly surmounted with a temperature scaling [21]. Original SW [5] results in Tm very close to the experimental value, and Ref. [6] overestimates it by 6.4 %. TABLE I: Calculated l0 , Ecoh and Tm for Si with TS [4] and SW [5], [6] potentials, along with experimental data. Marks show the agreement (X), similarity (≈) or disagreement (X ) with experimental data. TS [4] l0 (Å) Ecoh (eV/at.) Tm (K). 5.432 X 4.629 X 2444 X. SW Ref. [5]. Ref. [6]. 5.432 X 4.337 X 1665 X. 5.429 X 4.632 X 1795 ≈. Exp. [22] 5.429 4.63 1687. Table II summarizes the results of l0 , Ecoh and Tm for Ge. TS provides adequate l0 and Ecoh values, but Tm is overestimated. Among SW parametrizations, we only evaluated Tm in those cases that provided l0 and Ecoh in agreement with experimental values. The better compromise for l0 , Ecoh and Tm is obtained with the parametrization of Ref. [14]. This parametrization overestimates Tm by 7.4 %, a similar percentage to Ref. [6] for Tm in Si..
(4) TABLE II: Calculated l0 , Ecoh and Tm for Ge with TS [4] and SW [11]–[15] potentials, along with experimental data. Marks show the agreement (X), similarity (≈) or disagreement (X ) with experimental data. SW TS [4] l0 (Å) Ecoh (eV/at.) Tm (K). 5.657 X 3.851 X 2467 X. Ref. [11]. Ref. [12]. Ref. [13]. 5.654 X 3.860 X 2885 X. 5.654 X 3.836 ≈ 1484 X. 5.654 X 3.160 X -. Model A. Ref. [15] Model B. “Scaled”. 5.651 X 3.850 X 1000 X. 5.542 X 3.480 X -. 5.712 X 3.324 X -. Ref. [14] 5.654 X 3.86 X 1300 ≈. Exp. [22] 5.652 3.85 1211. Fig. 3: (a-b) MSD of surface, subsurface, and bulk atoms and (c-d) atomic surface configuration at the end of the annealing for (100) Si surfaces at 1400 K (a, c) and 1600 K (b, d). TABLE III: Calculated l0 , Ecoh and Tm for SiGe with TS [4] and SW potential (Si: Ref. [6], Ge: Ref. [14]) with mixing rules from Refs. [16], [17], along with estimated experimental data (see text for details). Marks show the agreement (X), similarity (≈) or disagreement (X ) with experimental data. TS [4] l0 (Å) Ecoh (eV/at.) Tm (K). 5.542 X 4.231 X 2516 X. SW Ref. [16] Ref. [17]. Exp.. 5.541 X 4.227 X 1568 ≈. 5.54 4.24 1449. 5.541 X 4.230 X -. Results for SiGe are shown in Table III. There is not a clear phase transition for SiGe between the crystalline and liquid phases, but a range of temperatures where they coexists [23]. Thus, we estimated the reference parameters of SiGe as the arithmetic mean of the properties of Si and Ge. For SW, we selected parametrizations of Ref. [6] for Si and Ref. [14] for Ge as they correctly reproduce l0 and Ecoh , while slightly overestimate Tm , and we used the mixing rules from Ethier et al. [16] and Laradji et al. [17]. We also considered TS potential for completeness. Although it overestimates Tm in Si and Ge, it is commonly employed for modeling SiGe [24]– [26]. TS potential for SiGe results in good agreement of l0 and Ecoh with expected values, but overestimates Tm . For SW both mixing rules show good results for l0 and Ecoh . We considered Ethier et al. [16] mixing rules for calculating Tm , as they are consistent with the standard combination rules in binary systems [18]. Calculated Tm overestimates experimental value by 8.2 %, similarly as Ref. [6] for Si and Ref. [14] for Ge.. Thus, the better overall compromise for l0 , Ecoh and Tm is obtained using SW potential with parametrizations of Ref. [6] for Si and Ref. [14] for Ge, and the mixing rules of Ref. [16] for SiGe. We used these SW parametrizations to study of the stability of surfaces shown in Fig. 2 for Si, Ge and SiGe. We showed in Fig. 3 the MSD of surface, subsurface and bulk atoms, and the final atomic surface configuration of Si (100) for annealings at 1400 K and 1600 K. MSD shows a fast initial increment for surface atoms at both temperatures, which indicates the formation of a 2 × 1 reconstruction. Then, MSD continues increasing with time for surface and subsurface atoms, being the increase larger for the higher temperature. This continuous increase is due to atomic rearrangements of surface and subsurface atoms, while bulk atoms do not move from lattice positions as their MSD is constant with time. These rearrangements modify the 2 × 1 reconstruction initially formed, as it can be seen from the atomic surface configuration at the end of the annealing in Figs. 3.c and 3.d. While it is slightly altered at 1400 K (there are some atoms connecting adjacent dimer rows), it is completely degraded at some regions for 1600 K. Thus, processing temperatures of 1600 K or higher are not adequate for (100) Si surface as the integrity of the surface is lost. An analogous analysis was performed for the different materials and surfaces considered. Table IV summarizes the stability of surfaces as a function of temperature for Si, Ge and SiGe. We used different symbols to indicate their stability (X), partial degradation (≈) or complete degradation (X ). In the case of Si (Table IVa), the (100) 2 × 1 surface is stable up to almost Tm in Si. Both (100) and (111)-B surfaces are stable up to 1400 K (0.78Tm ), while (111)-A surface is stable.
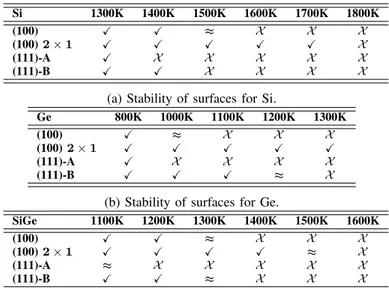
(5) Si (100) (100) 2 × 1 (111)-A (111)-B. 1300K X X X X. 1400K X X X X. 1500K ≈ X X X. 1600K X X X X. 1700K X X X X. 1800K X X X X. (a) Stability of surfaces for Si. Ge (100) (100) 2 × 1 (111)-A (111)-B. 800K X X X X. 1000K ≈ X X X. 1100K X X X X. 1200K X X X ≈. 1300K X X X X. (b) Stability of surfaces for Ge. SiGe (100) (100) 2 × 1 (111)-A (111)-B. 1100K X X ≈ X. 1200K X X X X. 1300K ≈ X X ≈. 1400K X X X X. 1500K X ≈ X X. 1600K X X X X. (c) Stability of surfaces for SiGe.. TABLE IV: Surface stability as a function of temperature. Symbols indicate stability (X), partial degradation (≈), and complete degradation (X ) of surfaces.. up to 1300 K (0.72Tm ). In the case of Ge (Table IVb), (100) 2 × 1 surface is also stable up to Tm . (111)-B surface is stable up to 1100 K (0.85Tm ), and (100) and (111)-B surfaces up to 800 K (0.61Tm ). Table IVc shows the results on the stability of surfaces for SiGe. As in the previous cases, (100) 2 × 1 surface is stable up to almost Tm . (100) and (111)-B surfaces are stable up to 1200 K (0.76Tm ), and (111)-A surface up to 900 K (0.57Tm ). IV. C ONCLUSIONS Our comparative study of empirical potentials for Si, Ge and SiGe showed that Nurminem’s [6] and Posselt’s [14] SW parametrizations resulted in the better compromise for reproducing l0 , Ecoh and Tm for Si and Ge, respectively. Regarding SiGe, Ethier’s [16] and Laradji’s [17] mixing rules offer similar results, but we selected those of Ethier et al. [16] as they are consistent with the standard combination rules in binary systems [18]. We found that (100) 2 × 1 surface shows the higher stability with temperature for Si, Ge and SiGe. The atomic structure of the surface is kept up to temperatures close to Tm . Surface orientations (100) and (111) with surface atoms forming three bonds with subsurface atoms, also show a good structural stability up to temperatures of ∼ 0.8Tm in the three materials. (111) orientation with surface atoms forming one bond with subsurface neighbors is the less stable with temperature as its structure is degraded at temperature above ∼ 0.7Tm in the three materials. In addition, (100) surfaces shows better stability with temperature than (111) surfaces for Si, Ge and SiGe. This implies that (100) surfaces could resist treatments at higher temperature without degradation.. R EFERENCES [1] E. Parton and P. Verheyen, “Strained silicon - the key to sub-45 nm cmos. III-Vs review,” Advanced Semiconductor Magazine, vol. 19, p. 28, 2006. [2] F. Zwanenburg, A. Dzurak, A. Morello, M. Simmons, L. Hollenberg, G. Klimeck, S. Rogge, S. Coppersmith, and M. Eriksson, “Silicon quantum electronics,” Rev. Mod. Phys., vol. 85, p. 961, 2013. [3] I. Martin-Bragado and A. Sarikov, “Atomistic modeling of epitaxial growth of semiconductor materials,” Mater. Sci. Semicond. Process., vol. 42, p. 223, 2016. [4] J. Tersoff, “Modeling solid-state chemistry: Interatomic potentials for multicomponent systems,” Phys. Rev. B, vol. 39, p. 5566, 1989. [5] F. Stillinger and T. Weber, “Computer simulation of local order in condensed phases of Si,” Phys. Rev. B, vol. 31, p. 5262, 1989. [6] L. Nurminen, F. Tavazza, D. Landau, A. Kuronen, and K. Kaski, “Comparative study of Si(001) surface structure and interatomic potentials in finite-temperature simulations,” Phys. Rev. B, vol. 67, p. 035405, 2003. [7] M. Baskes, “Modified embedded-atom potentials for cubic materials and impurities,” Phys. Rev. B, vol. 46, p. 2727, 1992. [8] J. Justo, M. Bazant, E. Kaxiras, V. Bulatov, and S. Yip, “Interatomic potential for Si defects and disordered phases,” Phys. Rev. B, vol. 58, p. 2539, 1998. [9] H. Balamane, T. Halicioglu, and W. Tiller, “Comparative study of Si empirical interatomic potentials,” Phys. Rev. B, vol. 46, p. 2250, 1992. [10] S. Yoo, X. Zeng, and J. Morris, “The melting lines of model Si calculated from coexisting solid-liquid phases,” J. Chem. Phys., vol. 120, p. 1654, 2004. [11] K. Ding and H. Andersen, “Molecular-dynamics simulation of amorphous Ge,” Phys. Rev. B, vol. 34, p. 6987, 1986. [12] Z. Wang and D. Stroud, “Monte Carlo studies of liquid semiconductor surfaces: Si and Ge,” Phys. Rev. B, vol. 38, p. 1384, 1988. [13] K. Nordlund, M. Ghaly, R. Averback, M. Caturla, T. D. de la Rubia, and J. Tarus, “Defect production in collision cascades in elemental semiconductors and fcc metals,” Phys. Rev. B, vol. 1998, p. 7556, 57. [14] M. Posselt and A. Gabriel, “Atomistic simulation of amorphous Ge and its solid phase epitaxial recrystallization,” Phys. Rev. B, vol. 80, p. 045202, 2009. [15] W. Yu, Z. Wang, and D. Stroud, “Empirical molecular-dynamics study of diffusion in liquid semiconductors,” Phys. Rev. B, vol. 54, p. 13946, 1996. [16] S. Ethier and L. Lewis, “Epitaxial growth of Si1−x Gex on Si(100)2×1: A molecular-dynamics study,” J. Mater. Res., vol. 7, p. 2817, 1992. [17] M. Laradji, D. Landau, and B. Dünweg, “Structural properties of Si1−x Gex alloys: A monte carlo simulation with the Stillinger-Weber potential,” Phys. Rev. B, vol. 51, p. 4894, 1995. [18] M. P. Allen and D. J. Tildesley, Computer Simulations of Liquids. Oxford University Press, 1987. [19] S. Plimpton, “Fast parallel algorithms for short-range molecular dynamics,” J. Comput. Phys., vol. 117, p. 1, 1995. [Online]. Available: https://lammps.sandia.gov [20] I. Berbezier and A. Ronda, “SiGe nanostructures,” Surf. Sci. Rep., vol. 64, p. 47, 2009. [21] L. Marqués, L. Pelaz, P. Castrillo, and J. Barbolla, “Molecular dynamics study of the configurational and energetic properties of the Si selfinterstitial,” Phys. Rev. B, vol. 71, p. 085204, 2005. [22] M. Yin and M. Cohen, “Theory of static structural properties, crystal stability, and phase transformations: Application to Si and Ge,” Phys. Rev. B, vol. 26, p. 5668, 1982. [23] N. O. Smith, “The Gibbs energy basis and construction of melting point diagrams in binary systems,” J. Chem. Educ., vol. 74, no. 9, p. 1080, 1997. [24] Y. Xiao, J. Taguchi, T. Motooka, and S. Munetoh, “Nucleation and crystal growth of Si1−x Gex melts during rapid cooling processes: A molecular-dynamics study,” Jpn. J. Appl. Phys., vol. 51, p. 035601, 2012. [25] K. R. Hahn, S. Cecchi, and L. Colombo, “Effect of asymmetric concentration profile on thermal conductivity in Ge/SiGe superlattices,” Appl. Phys. Lett., vol. 108, p. 203102, 2016. [26] P. Käshammer, N. I. Borgardt, M. Seibt, and T. Sinno, “Quantitative assessment of molecular dynamics-grown amorphous silicon and germanium films on Si (111),” Surface Science, vol. 651, p. 100, 2016..
(6)
Figure
![TABLE II: Calculated l 0 , E coh and T m for Ge with TS [4] and SW [11]–[15] potentials, along with experimental data](https://thumb-us.123doks.com/thumbv2/123dok_es/2880176.548701/4.918.118.802.118.434/table-ii-calculated-coh-ge-potentials-experimental-data.webp)
Documento similar
[9,10] with a large set of data from molecular dynamics simulations and experiments in 2D and 3D liquids and plasmas to determine the regime of applicability of hydrodynamics
The present study reports an extensive analysis of the available GPCRs crystal structures combined with results from molecular dynamics (MD) simulations of model pep- tides in
A January effect is present in nominal terms, but it is negative in real and dollar adjusted returns.. The January effect present in nominal terms cannot be explained by
The aim of the study was to perform cytogenetic and molecular characterization of a group of patients with ovotesticular syndrome and complete gonadal dysgenesis from peripheral
The potential of the proposed architecture is demonstrated with the implementation and evaluation of a heterogeneous V2I communications algorithm that improves
Multifractal analysis of the symmetry of a strictly isospectral energy landscape on a square lattice
We thus present in Table 1 the H¨ older exponent values and their locations for the original potential and the isospectral parametric potential at the determined values of
of the behavior of the users of the buildings was found to be a concern with rising interest, and a modeling approach was proposed to take advantage of
No obstante, como esta enfermedad afecta a cada persona de manera diferente, no todas las opciones de cuidado y tratamiento pueden ser apropiadas para cada individuo.. La forma
