DOI: 10.7569/JRM.2017.634118
*Corresponding authors: [email protected]
Foams Synthesized from Renewable Sources with Different
Commercial Catalysts
Daniel Brenes-Granados1, Jorge M. Cubero-Sesin1,2, Felipe Orozco Gutiérrez3, Jose Vega-Baudrit3 and
Rodolfo Gonzalez-Paz3*
1School of Materials Science and Engineering, Costa Rica Institute of Technology, Cartago 159-7050, Costa Rica 2Institutional Microscopy Laboratory, Costa Rica Institute of Technology, Cartago 159-7050, Costa Rica 3National Nanotechnology Laboratory (LANOTEC-CeNAT-CONARE), San José, Costa Rica
Received November 25, 2016; Accepted February 24, 2017
ABSTRACT: In this work, rigid polyurethane foams were synthesized from renewable sources using different catalysts to study their effect on the mechanical, thermal, chemical and surface properties of the foams. A commercial foam pattern was used as the reference pattern to compare the aforementioned properties. Concentrations of the commercial catalysts were optimized to obtain foams with similar mechanical properties to the commercial foam. Morphological characterization of the foams was performed by scanning electron microscopy (SEM). Fourier transform infrared (FTIR) spectroscopy was employed to investigate the characteristic functional groups. Thermal characterization was performed by means of differential scanning calorimetry (DSC) and thermogravimetric analysis (TGA). Furthermore, mechanical properties were also determined by dynamic mechanical thermal analysis (DMTA). The optimum system of catalysts was composed of 33 Lv and triethanolamine, which achieved a foam with better performance than the commercial foam. KEYWORDS: Polyurethane foams, catalysts, mechanical properties, renewable sources
1 INTRODUCTION
For decades, the chemical industry has produced poly-mers based on oil derivatives. As the accessible global oil reserves are dropping, and the ecological footprint that comes along with oil-based materials is increas-ing, these products are no longer ecologically afford-able nor socially accepted. Over the past few years, plenty of efforts have been made for the development of eco-friendly polymers; that is, polymers based on biomass and/or able to biodegrade [1].
Polyurethanes (PUs) are polymers with versatile properties and with a wide range of industrial appli-cations such as medical devices, furniture, coatings, packaging, adhesives, construction materials, fibers, elastomers, paints, and padding [2–4]. More specifi-cally, PU rigid foams are in high demand as thermal insulators for the construction industry [4].
Polyurethanes are complex matrices composed basically of two parts: the polyol, which is an organic structure with at least two hydroxyl moieties; and the
prepolymer, a diisocyanate material that has already been partially reacted with a polyol counterpart to control the viscosity, volatility, reactivity, and toxicity of the PU precursor [5]. When both components are mixed, they react exothermically to form mainly urethane groups (1), covalently bonding the prepolymer and the polyol to form the foam. Other important reactions take place during foaming: a reaction between water and the iso-cyanate groups that produces amines and gaseous CO2 that bubbles up through the system and sculpts the foam framework (2); a reaction between the produced amines and the isocyanate to form ureas (3); subse-quently, ureas react with isocyanate and form biurets (4) and a trimerization reaction between the isocyanate molecules themselves to form isocyanurates (5) [4, 6]. These reactions are shown schematically in Figure 1.
capability), additives (blowing agents, surfactants, bleachers, UV-protectors), the reaction conditions (temperature, pressure, mold), and most importantly, the catalytic cocktail used [6–9]. Multiple kinds of cat-alysts have been developed. Commonly used catcat-alysts are tertiary amines or organometallic molecules with an active inorganic site (mainly Sn). Tertiary amines generally catalyze polyurethane foaming reactions. Nonetheless, depending on the basicity and the ste-ric hindrance on the nitrogenous sections, catalytic selectivity is enhanced (also influenced by hydrogen bonding capability and the distance between active sites per molecule). Therefore, there are gel, blow and trimerization catalysts which promote the reactions numbered in Figure 1, as 1, 2 and 4, respectively [6].
A balanced catalytic cocktail must be formu-lated to allow the gelation of the foam while CO2 (or other blowing agents) are raising the structure. Non-balanced systems will produce fragile and heteroge-neous foams [6]. A balanced formulation that allows formation of uniform cells is also achieved with sur-factants that homogenize the components of the reac-tive mixture and aid in the nucleation of bubbles [8].
Several eco-friendly PU rigid foams have been reported in the literature. Some are PUs formulated with less toxic isocyanate precursors relying entirely on water as blowing agent (avoiding the use of volatile
hydrocarbons) [10]. Others use biomass as raw mate-rials. Pristine and modified vegetable oils have been used for PU in both the polyol and the prepolymer [4, 11–13]. In this report, waterborne PU rigid foams were prepared with the polyol fraction made entirely from renewable resources. Using commercially avail-able PU catalysts, several catalytic cocktails were prepared to synthesize the foams and adjust their chemical and mechanical properties. The resulting foams were compared with a reference commercial foam. The present work aims to optimize the concen-trations and types of commercial catalysts used mostly in rigid foams from nonrenewable sources, in a system where the polyol comes from vegetable oils of differ-ing chemical natures.
2 MATERIALS AND METHODS
2.1 Materials
The polyol and the isocyanate used for prepara-tion of the PU foams were both supplied by Govan Projects S.A. The polyol derived from vegetable oils had a hydroxyl value of 542 mgKOH/g and an acid value of 0.25 mgKOH/g. The polyol from fossil sources had a hydroxyl value of 656 mgKOH/g and an acid value of 1.57 mgKOH/g. A commercial isocyanate
Figure 1 Schematic illustration of reactions that occur during foaming. R
R
NH O
(1)
(2)
(3)
(4)
(5) O
(Urea) (Urethane)
(Biuret)
(Isocyanurate) R’
R’
R R’
N H
N
H NH
N
H NH
N H O + N
C O
+
R N C
O +
R N C
O
R N
C O
N N
R
O N R
R O
O O O
O +
+
R 3
N C
O
R’ OH
R’
R’ R’ R’
R’ R
N NH2
with 31% of NCO groups was used. The commercial catalysts used to obtain the rigid foams are shown in Table 1. Traditionally, when commercial polyols are used, it is common to report only the OH num-ber and the acidity. The chemical structure or origin of the product are not mentioned in this paper for confidentiality.
2.2 Synthesis of Free Foams
For the synthesis of free foams, the procedure stated in ASTM D7487 standard was followed. With this procedure, it was possible to obtain several character-istic parameters of the free foaming process, namely the cream time, free rise time, pull time and tack-free time. These parameters were used to obtain a reliable measurement on which to base the results of several catalysts.
For the formulation of polyols, a constant base was established with four different families of cata-lysts. Different tests for each polyol were carried out, by modification of the quantities of catalysts for each family, to determine the ideal composition that results in a better catalysis.
Free foaming was performed in vessels of 5.5 oz. For this purpose, a molar relationship of NCO/OH = 1.5 was established. Calculations were performed to determine the amount of polyol and prepolymer to achieve a total mass of 8 g. Cream time, free rise time, pull time and tack-free time were recorded during this process. The procedure was performed in triplicate for four foams, namely PU1, PU2, PU3 and PU4, each with a family of different catalysts.
Synthesis was performed in a mold with an inner heat exchanger powered by a flow of water at 55 °C to keep the temperature constant while the foam was synthesized. The prepolymer and polyol mixture was performed at the NCO/OH ratio of 1.5, using
approximately 25 g of mixture. Mixing was done with an IKA Ultra-Turrax T25 digital mixer at a rate of 4000 rpm for 30 s. Subsequently, 18 g of mixture was poured into the mold cavity covered with a paper release agent. The mold was kept closed for 30 min. This procedure was done in triplicate for the com-mercial reference foam (PU Ref), as well as for the four foams prepared with different catalysts. Curing of the foam was performed after opening the molds and removing the release paper, by placing them in a controlled environment for 7 days at room tempera-ture. For calculation of the density and weight of the foams, their edges were cut so that a prismatic block of approximately 110 × 35 × 35 mm3 remained.
2.3 Characterization of the Foams
Morphological analysis of the foam cell structure was carried out using scanning electron microscopy (SEM). The foams were cut with a scalpel and coated with a thin layer of Au-Pd alloy by means of sputtering in a Denton Vacuum Desk IV coater. A Hitachi TM-1000 tabletop microscope operated at 15 KV was used to observe the cross sections of the foams. Several images at different locations along the cross sections were recorded, and then ImageJ image analysis software was used to measure the average cell sizes.
Water absorption tests were performed follow-ing the ASTM D2842 standard. Cubes of 25 × 25 × 12, 5 mm3 were cut. The exact dimensions of the cubes
were measured with an electronic Vernier caliper, as well as the mass of each cube. The cubes were placed in a metallic frame dipped in a container with type III water, ensuring that the cubes were completely sub-merged. The samples were left to rest at room temper-ature for 48 h. After completion of the test, water was drained and the mass of each block was measured. The samples were immersed once more for a period of 120 h, then drained and their mass measured again. To observe the effect of water absorption in both com-mercial and synthesized foams with different catalysts the contact angle was calculated with a Ramé-Hart Instrument Co. goniometer.
Fourier transform infrared spectroscopy (FTIR) was carried out using a Nicolet 6700 spectrometer with ATR diamond crystal. Thin foam samples were cut and analyzed in a range of wavenumbers from 3500 cm–1 to 600 cm–1. The characteristic bands were
analyzed with OMNIC software.
Differential scanning calorimetry (DSC) was per-formed with a TA Instruments DSC Q200 instrument using 2.5 mg samples in aluminum capsules. A tem-perature ramp of 5 °C/min was employed from −60 °C to 150 °C. Thermogravimetric analysis (TGA) was per-formed with a TA Instruments TGA Q500 instrument
Table 1 Commercial catalysts used in this work.
Commercial
name Compound
Polycat 8 Dimethylcyclohexylamine Polycat 5 Pentamethyldiethylenetriamine Polycat 12 Methyldicyclohexylamine PMDETA Pentamethyldiethylenetriamine 33 LV 33 wt% of triethylenediamine
dipropylene glycol in solution
TMR-31 Not available
using 5 mg foam samples with a temperature range from 20 °C to 1000 °C (Ramp: 10 °C/min from 20 °C to 700 °C and 20 °C/min from 700 °C to 1000 °C).
The mechanical properties of the foams were eval-uated with a TA DHR III rheometer. Specimens of 50 × 10 × 5 mm3 were prepared for torsion tests, which
were performed at room temperature for 300 s with a cutting speed of 1.59 × 10⁻³ s–1. For the tension test,
specimens of 40 × 5 × 2 mm3 were prepared using a
speed of 1 mm/min. For compression tests, specimens of 10 × 10 × 10 mm3 were used at a speed of 1 mm/
min. From the experimental data, tension, torsion, and compression moduli were calculated for each foam using TRIOS and Origin 8 software.
3 RESULTS AND DISCUSSION
3.1 Free Foaming in Vessels
The four formulations with variation of the catalysts were prepared and mixed with a commercial isocy-anate to compare the effect of each catalyst. As control, a commercial sample that uses the same isocyanate with a more hydrophilic commercial polyester polyol was used. Table 2 shows the concentrations of catalysts that were added to the polyol and resulted in similar reaction times to the control sample [14].
Times for free foaming were recorded and their den-sity was measured, both for the control foams as well as for the foams synthesized from renewable sources. Foams having similar density to the commercial (55 ± 3 kg/m3) were used, since this property is important
to keep a good relation of cost and load capacity in the foam [15]. Figure 2 shows a chart comparing the results of cream time, free rise time, pull time and tack-free time. Amongst these time parameters, cream time and tack-free time are the most relevant. With regards to the cream time, similar or longer times than the ref-erence are sought to homogenize the mixture of polyol and the commercial isocyanate well enough to form a single phase. Another important point is the tack-free time, which is the time it takes for the foam to become hard. These parameters should not be very high since
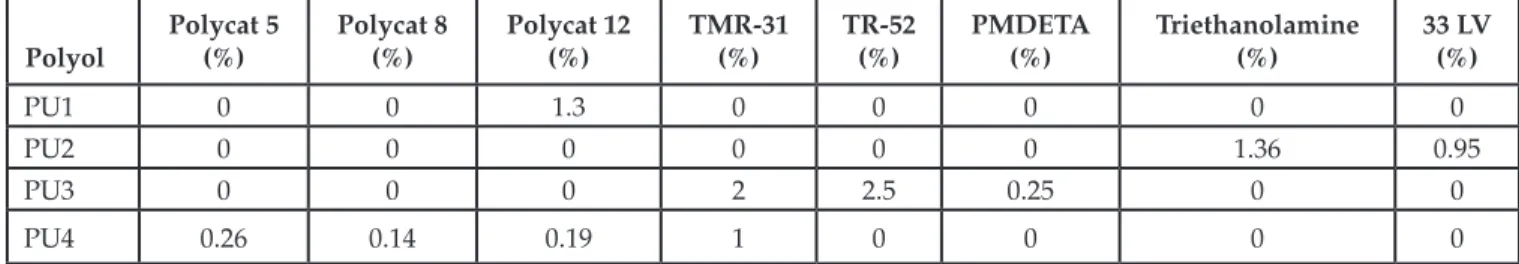
Table 2 Detail of additives used for preparation of synthesized foams.
Polyol Polycat 5 (%) Polycat 8 (%) Polycat 12 (%) TMR-31 (%) TR-52 (%) PMDETA (%) Triethanolamine (%) 33 LV (%)
PU1 0 0 1.3 0 0 0 0 0
PU2 0 0 0 0 0 0 1.36 0.95
PU3 0 0 0 2 2.5 0.25 0 0
PU4 0.26 0.14 0.19 1 0 0 0 0
demolding of the part at times equivalent to those used in industry is required to make the process cost-effective. The results in Figure 2 show that PU1 and PU2 are very competitive in terms of all parameters, except tack-free time, comparable to the PU Ref; PU3 has a good performance in terms of this parameter. It is expected that further work in the selection of cata-lysts could improve the performance of the synthe-sized foams well past the commercial foam.
3.2 Absorption of Water
Absorption of water will be influenced by the cell size and hydrophobicity of foam [16]. Table 3 shows the contact angles measured on the surface of the foam, as well as the water absorption (%) for two time inter-vals, 48 h and 120 h. In the case of the PU1 and PU2 foams, cell sizes were smaller with respect to PU3 and PU4, as shown by the SEM observations, which results in less water absorption.
It is expected that the vegetable oil-based foams have higher contact angles compared to commercial foam [13]. However, this trend is not clear from the
Figure 2 Measurements of free foaming time parameters for synthetized polyurethane foams versus reference foam.
1300
Tack-free time Pull time Free-rise time Cream time 1200
1100 1000 900 800
Time (s)
700 600 500 400 300 200 100 0
PU Ref PU 1 PU 2 Foam
data shown in Table 3, possibly because of differences in cell size and cell distribution over the surface of the foam.
Figure 3 shows a series of SEM images: a, b, c, d and e, corresponding to the PU Ref, PU1, PU2, PU3 and PU4 foams, respectively. A difference in cell sizes amongst the foams can be appreciated. This result is confirmed in the data of the histogram shown in Figure 4, where it is shown that the PU1 foam has the smaller cell size. It is expected that cell size influences
not only water absorption but also the mechanical properties of foam, since a smaller cell size will distrib-ute the exerted stresses, resulting in better mechanical properties [17].
3.3 FTIR Spectroscopy
Figure 5 shows the rough infrared spectra obtained from the foams, as outlined in [3]. Bands centered at approximately 3700 cm–1 and 3200 cm–1 correspond
to N-H bonds, which is attributed to the -NH stretch-ing vibration, while signals between 3000 cm–1 and
2800 cm–1 correspond to vibrations of C-H bonds,
spe-cifically 2920 cm–1 corresponding to asymmetric CH 2
stretching and 2860 cm–1 peak associated with
symmet-ric CH2 stretching. Between 1780 cm–1 and 1665 cm–1,
peaks correspond to the carbonyl of the urethane
Table 3 Contact angle and water absorption of synthe-sized foams versus reference foam.
Foam Contact angle
Water absorption (%)
48 h 120 h
PU Ref (94.26 ± 1.02) (92.01 ± 1.33) (108.00 ± 4.44)
PU1 (74.24 ± 1.18) (64.86 ± 1.67) (89.86 ± 0.56)
PU2 (104.16 ± 1.48) (55.24 ± 6.24) (82.94 ± 6.42)
PU3 (91.37 ± 0.82) (73.26 ± 1.25) (98.57 ± 1.82)
PU4 (90.24 ± 1.51) (85.27 ± 4.70) (111.97 ± 6.16)
Figure 3 SEM images of polyurethanes: (a) PU Ref, (b) PU1, (c) PU2, (d) PU3, and (e) PU4.
PU ref
(a) (b)
(c) (d)
(e)
×80 1 mm PU 1 ×80 1 mm
PU 2 ×80 1 mm PU 3 x80 1 mm
PU 4 ×80 1 mm
Figure 4 Histogram of cell sizes for synthetized polyurethane foams versus reference foam.
9 PU refPU 1
PU 2 PU 3 PU 4 8
7
6
5
Fr
equenc
y
4
3
2
1
0
100 200 300
Diameter (µm) 400 500
Figure 5 Infrared spectra for synthetized polyurethane foams versus reference foam.
100
95
90
85
80
PU Ref
Tr
ansmittance (%)
PU 1 PU 2 PU 3 PU 4 75
70
65
4000 3500 3000 2500 Wave number (cm–1)
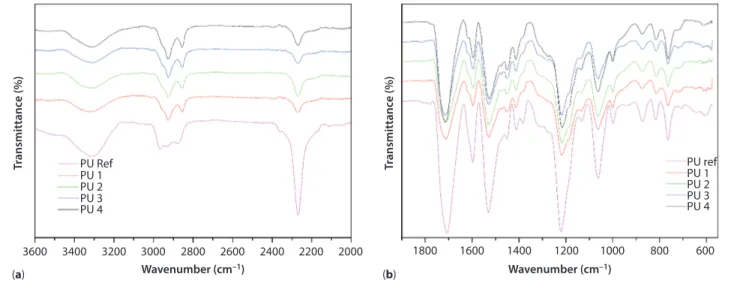
Figure 6 Infrared spectra in the range of (a) 3000 to 2000 cm–1 and (b) 1800 to 600 cm–1. 3600
(a) (b)
3400 PU Ref
Tr
ansmittance (%
)
PU 1 PU 2 PU 3 PU 4
3200 3000 2800 Wavenumber (cm–1)
2600 2400 2200 2000
PU ref
Tr
ansmittance (%
)
PU 1 PU 2 PU 3 PU 4
Wavenumber (cm–1)
1800 1600 1400 1200 1000 800 600
group and the ester. C-N vibrations are in 1233 cm–1
[13]. In this case, N-H vibrations from the reference foam do not form hydrogen bonds since they are N-H free (~3600 cm–1), while the vegetable oil-based foams
do form hydrogen bonds since they are N-H bonded (~3300 cm–1). In this case, reference to water was not
made because there is an excess of the Isocyanate group in the material, as can be seen in the FTIR of Figure 5. Since the isocyanate is highly reactive with water, it prevents water from being in the polymer matrix.
Figure 6a shows an enlarged section of the infrared spectra in the range of 3000 cm–1 to 2000 cm–1. A shift
in the reference foam bands in the range of 3000 cm–1
to 2800 cm–1 can be appreciated. As it was mentioned
previously, this band corresponds to C-H bonds that, despite the fact they do not form hydrogen bonds, are affected by the nearby N-H group, which forms hydro-gen bonds and a more rigid structure. The band close to 2250 cm–1 corresponds to those NCO groups from
the isocyanate that did not react. In this case the ref-erence foam has a greater amount of unreacted NCO groups. The isocyanate will react in time, depending on environmental factors such as moisture, storage location and temperature [18].
Figure 6b shows an enlarged section of the infra-red spectra in the range of 1800 cm–1 to 600 cm–1.
Characteristic bands of urethane groups are shown; for the reference foam an intense band of the car-bonyl group of the urethane appears at 1780 cm–1
and for the carbonyl group of the ester at 1600 cm–1 a
split band appears in the vegetable oil-based foams. The same phenomenon occurred for C-N groups around 1233 cm–1, which is due to the formation
of hydrogen bonds in the foams from vegetable oil sources [13, 19].
3.4 Thermogravimetric Analysis
Table 4 shows thermal parameters extracted from the DSC and TGA experiments on the synthesized foams, and Figure 7 shows the respective thermograms. At approximately 5% of weight loss, the onset of thermal degradation of the urethane bond occurs [20]. The temperature values for this onset are shown as T5% in Table 4 for each of the synthesized foams, which are somewhat lower than for the reference foam. Although the temperature of maximum degradation of the refer-ence foam is approximately 320 °C, the vegetable oil-based foams exhibit two maxima, as shown respec-tively for each foam as Tmax 1 and Tmax 2 in Table 4. This result indicates that these synthesized foams have a more complex degradation process and require higher
Table 4 Transition temperatures and enthalpies of synthesized foams versus reference foam.
PU T5% (°C) Tmax 1 (°C) Tmax 2 (°C) Tg (°C) ΔH (J/g) TΔH (°C)
PU Ref 248,58 321,46 – 1.75 51,02 63,42
PU1 233,15 268,39 374,12 6.02 21.91 60,88
PU2 231,77 260,97 368,95 11.19 20.64 63,11
PU3 197,37 245,88 427,71 5.75 25.06 54,49
temperatures for total decomposition with respect to the commercial foam [21, 22].
The glass transition temperatures, Tg, recorded from the DSC analyses of the foams are also shown in Table 4. The Tg values for the vegetable oil-based foams are larger than the commercial foam, which is consistent with the presence of hydrogen bonds detected in the FTIR analyses. Another important point to discuss is the curing enthalpy. The values, shown as ΔH in Table 4, show that in the case of the refer-ence foam the value of enthalpy doubles that of the vegetable oil-based foams, which means that the cur-ing process of the commercial foam takes more time. This result is consistent with the FTIR analysis, since stretching vibration around 2250 cm–1 of NCO groups
in the reference foam has greater transmittance than the others. Despite the curing enthalpy being lower for the vegetable oil-based foams, in this case the curing temperature, TΔH, in this case the curing temperature is shown as an isotherm around 60 °C and it is main-tained within a range of no more than ±9 °C [23, 24].
3.5 Mechanical Properties
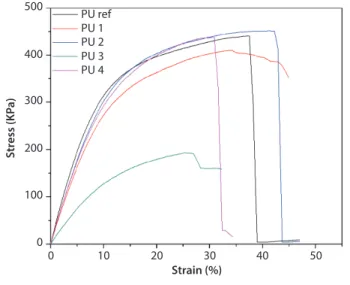
Figure 8 shows the stress-strain curves from the sam-ples subjected to torsion. In this case the PU1, PU2 and PU4 foams have a good resistance to torsion with respect to the reference. However, despite such resist-ance the samples arrive at a point of rupture, except for the PU1 foam, which doesn’t break under the same shear rate [25]. After 10% deformation, the foam
reaches a point of no recovery since the cells are broken [15]. Table 5 shows the shear modulus, ultimate shear strength and elongation at break for the torsion tests. As expected, PU3 has the lower stress among the sam-ples because the cell size is larger than PU1 and PU2.
Figure 9 shows the stress-strain curves from the samples subjected to tensile defomation. The PU1, PU2, PU3 and PU4 foams all have lower UTS than the reference foam. The estimations of Young’s modulus are shown in Table 6, which are also below the reference foam. However, the ultimate strength and elongation at break varies among the foams. The PU1 and PU2 foams all have smaller cell sizes and
Figure 8 Stress-strain curves for torsion tests. 500
PU ref PU 1 PU 2 PU 3 PU 4 400
300
Stress (KP
a)
200
100
0
0 10 20 30
Strain (%) 40 50
Figure 7 Thermogravimetric curves for synthetized polyurethane foams versus reference foam. 100
PU ref
PU 1
PU 2 PU 3 PU 4
80
60
40
W
eight (%)
20
0
–20
0 200 400 600 800 1000
Figure 9 Stress-strain curves for tensile tests. 350
300
250
200
150
100
50
0
0 2 4 6 8 10
PU ref PU 1 PU 2 PU 3 PU 4
Stress (KP
a)
Strain (%) 12
better performance, as stated previously, which are also influenced by the formation of hydrogen bonds. According to Stirna et al. [26], the tensile properties will vary depending on the matrix and the morphol-ogy of foam. In this case, the cell size is a relevant factor contributing to the tensile properties, since the smaller cell size will allow the mechanical stresses to be more homogeneously distributed, which in turn enhances the mechanical properties [17].
The resistance to compression was verified in cubic samples, considering that the applied force goes in the direction parallel to the rise direction while foaming occurred. Figure 10 shows the stress-strain curves for the case of compression tests, and Table 7 summarizes
the compressive properties. In this case, the compres-sive modulus and ultimate strength of PU1 and PU2 at 15% deformation are higher than that of the PU Ref, while PU3 and PU4 have lower values of compressive strength. In this case, the cell size is also an important factor that modulates the mechanical properties of the foams [26].
The results shown throughout this article show that it is possible to synthesize foams from vegetable-oil (renewable) sources that are very much comparable to a commercial option derived from fossil fuels. The thermal stability as well as the mechanical properties were shown to be comparable or better than the refer-ence foam.
Figure 10 Stress-strain curves for compression tests. 350
300
250
200
150
100
50
0
0 2 4 6 8 10
PU ref PU 1 PU 2 PU 3 PU 4
Stress (KP
a)
Strain (%) 12 14 16
Table 5 Results from torsion tests of synthesized foams versus reference foam.
Foam Shear modulus (KPa) Ultimate shear strength (KPa) Elongation at break (%)
PU Ref (41.7 ± 1.5) (439,7 ± 29.3) (37.4 ± 4.1)
PU1 (35.6 ± 2.1) (356,8 ± 66.2) (44.9 ± 1.5)
PU2 (37.2 ± 2.3) (450.0 ± 11.2) (42.2 ± 3.2)
PU3 (15.5 ± 4.2) (192,3 ± 28.6) (26.8 ± 3.7)
PU4 (35.7 ± 3.3) (435,7 ± 66.3) (30.8 ± 3.9)
Table 6 Results from tensile tests of synthesized foams versus reference foam.
Foam Young’s modulus (KPa) Ultimate tensile strength (KPa) Elongation at break (%)
PU Ref (72.1 ± 0.5) (328,8 ± 25.2) (6.5 ± 1.3)
PU1 (40.2 ± 2.2) (209,4 ± 11.1) (8.9 ± 1.5)
PU2 (41.5 ± 1.1) (266,7 ± 4.0) (9.7 ± 2.1)
PU3 (32.6 ± 2.7) (147,3 ± 31.8) (5.0 ± 1.0)
4 CONCLUSIONS
In this work, rigid polyurethane foams were synthe-sized from renewable sources using different cata-lysts to study their effect on the mechanical, thermal, chemical and surface properties of the foams. The following conclusions can be drawn from the results presented:
• Vegetable oil-based foams have a complex pro-cess of decomposition because even though they tend to degrade earlier, at high tempera-tures they have better stability.
• The combination of catalysts that gave the best results was of triethanolamine and 33 Lv, cor-responding to the PU2 biobased foam.
• The cell size is the most important factor affect-ing the mechanical properties of the foams. A smaller cell size results in a more homogeneous distribution of the stresses applied to the foam.
• The presence of hydrogen bonds increases the rigidity, resulting in enhanced mechanical properties.
REFERENCES
1. T. Iwata, Biodegradable and bio-based polymers: Future prospects of eco-friendly plastics. Angew. Chem. Int. Ed. 54(11), 3210–3215 (2015).
2. G.T. Howard, Biodegradation of polyurethane: A review. Int. Biodeter. Biodegr. 49(4), 245–252 (2002).
3. A. Domanska and A. Boczkowska, Biodegradable poly-urethanes from crystalline prepolymers. Polym. Degrad. Stab. 108, 175–181 (2014).
4. A. Guo, I. Javni, and Z. Petrovic, Rigid polyurethane foams based on soybean oil. J. Appl. Polym. Sci. 77(2), 467–473 (2000).
5. M. Szycher, Handbook of polyurethanes. J. Am. Chem. Soc. 122(16), 3983–3983 (2000).
6. A.L. Silva and J.C. Bordado, Recent developments in polyurethane catalysis: Catalytic mechanisms review. Catal. Rev. 46(1), 31–51 (2004).
7. B.S.G. Valdés, M. Guerra, G. Mieres, L. Alba, A. Brown, N.A. Rangel-Vázquez, M. Sosa, and Y. de la Hoz,
Characterization of structural polyurethanes by spec-troscopy FTIR and NMR (1H and C13). Rev. Iberoamer. Polím. 9(4), 377–388 (2008).
8. M.F. Valero and L.E. Díaz, Polyurethane networks from pentaerythritol-modified castor oil and lysine polyiso-cyanates: Synthesis, mechanical, and thermal properties and in vitro degradation. Quim. Nova37(9), 1441–1445 (2014).
9. P.C. Mazo, A. Franco, L.A. Rios, and G. Restrepo, Obtención de espumas flexibles de poliuretano a partir de aceites de palma y castor modificados. Sci. Tech.36, 607–612 (2007).
10. K.-L. Noble, Waterborne polyurethanes. Prog. Org. Coat. 32(1–4), 131–136 (1997).
11. R.K. Gupta, M. Ionescu, D. Radojcic, X. Wan, and Z.S. Petrovic, Novel renewable polyols based on limonene for rigid polyurethane foams. J. Polym. Environ. 22(3), 304–309 (2014).
12. L.-T. Yang, C.-S. Zhao, C.-L. Dai, C.-L. Fu, and S.-Q. Lin, Thermal and mechanical properties of polyurethane rigid foam based on epoxidized soybean oil. J. Polym. Environ. 20(1), 230–236 (2012).
13. T. Gurunathan, S. Mohanty, and S.K. Nayak, Isocyanate terminated castor oil-based polyurethane prepolymer: Synthesis and characterization. Prog. Org. Coat. 80, 39–48 (2015).
14. A.M. Kapps and S. Buschkamp, The Production of Rigid Polyurethane Foam, pp. 1–43, Bayer Material Science (2004).
15. C. Defonseka, Properties and foaming technology of pol-yurethane foam, in Practical Guide to Flexible Polyurethane Foams, chap. 5.1, pp. 55–69, Smithers Information Ltd. (2013).
16. M. Kurańska, P. Aleksander, K. Mikelis, and C. Ugis, Porous polyurethane composites based on bio-compo-nents. Compos. Sci. Technol. 75, 70–76 (2013).
17. B.J. Rashmi, D. Rusu, K. Prashantha, M.F. Lacrampe, and P. Krawczak, Development of bio-based thermo-plastic polyurethanes formulations using corn-derived chain extending for reactive rotational molding. Express Polym. Lett. 7(10), 852–862 (2013).
18. L. Jasińska, J.T. Haponiuk, and A. Bullets, Dynamic mechanical properties and thermal degradation process of the unsaturated poly(ester urethanes) cross-linked with styrene obtained from compositions. J. Therm. Anal. Calorim. 93(3), 777–781 (2008).
19. C. Lluch, B. Esteve-Zarzoso, A. Bordons, G. Lligadas, J.C. Ronda, M. Galià, and V. Cádiz, Antimicrobial polyurethane Table 7 Results from compression tests of synthesized foams versus reference foam.
Foam Compressive modulus (Kpa) Compressive strength (Kpa) Compressive strain (%)
PU Ref (35.3 ± 1.0) (215,3 ± 40.2) (8.5 ± 0.2)
PU1 (38.1 ± 2.1) (299,6 ± 48.9) (8.2 ± 0.5)
PU2 (40.2 ± 1.5) (229,4 ± 43.7) (7.2 ± 0.7)
PU3 (21.6 ± 3.6) (137.4 ± 17.8) (8.1 ± 1.0)
based on undecylenic acid thermosets: Synthesis and eval-uation. Macromol. Biosci. 14(8), 1170–1180 (2014).
20. L. Zhang, M. Zhang, L. Hu, and Y. Zhou, Synthesis of rigid polyurethane foams with castor oil-based flame retardant polyols. Ind. Crops Prod. 52, 380–388 (2014). 21. M. Zieleniewska, M.K. Leszczyński, M. Kurańska,
A. Prociak, L. Szczepkowski, M. Krzyńowska, and J. Ryszkowska, Preparation and characterisation of rigid polyurethane foams using a rapeseed oil-based polyol. Ind. Crops Prod. 74, 887–897 (2015).
22. K. Pietrzak, M. Kirpńuks, U. Cabulis, and J. Ryszkowska, Effect of the addition of tall oil-based polyols on the ther-mal and mechanical properties of ureaurethane elasto-mers. Polym. Degrad. Stab. 108, 201–211 (2014).
23. C. Wang, Y. Zheng, Y. Xie, K. Qiao, Y. Sun, and L. Yue, Synthesis of bio-castor oil polyurethane flexible foams and the influence of biotic component on their perfor-mance. J. Polym. Res. 22(8), 145 (2015).
24. M. Kurańska and A. Prociak, The influence of rape-seed oil-based polyols on the foaming process of rigid polyurethane foams. Ind. Crops Prod.89, 182–187 (2016).
25. R.K. Traeger, Physical properties of rigid polyurethane foams. J. Cell. Plast. 3(9), 405–418 (1967).