Development of SERS substrates for the characterization of cellular systems and the determination of molecules of interest
106
0
0
Texto completo
(2)
(3)
(4) Acknowledgements I would like to express my gratitude towards my advisor for the exceptional encouragement and impartial feedback through this enriching and sometimes frustrating PhD. To my loved ones for their unconditional support and love, and helping me have a well-balanced life. To everyone in our research group for, the openness and camaraderie. To the professors and collaborators in CIO and CIMAV for their valuable feedback and willingness to lend a hand when specific equipment was needed. I would also like to thank CONACyT for the financial support (scholarship #400488) and Tecnológico de Monterrey for covering the full extent of the tuition during the course of this program..
(5) Development of SERS substrates for the characterization of cellular systems and the determination of molecules of interest By Iris Anahí Aguilar Hernández Abstract Raman spectroscopy is a powerful vibrational spectroscopy technique that provides useful information regarding the chemical composition of a sample. It is a label-free technique that can be successfully applied for both single analyte detection and the analysis of complex matrices. The only main limitation of Raman spectroscopy is the inherent low scattering efficiency. Surface Enhanced Raman Spectroscopy (SERS) is employed to overcome this limitation. SERS active structures are typically in the form of colloidal solutions, or as solid substrates with metallic nanostructures on the surface. The work included in this dissertation explores the development of SERS substrates for (a) the detection of a single molecule of interest, and (b) the analysis of cellular systems. For the detection of molecules of interest, two studies were carried out: In the first study, the ideal synthesis conditions of colloidal silver nanoparticles that rendered the highest SERS enhancement was explored via principal component analysis (PCA). The selected silver nanoparticles were used for the ultrasensitive detection of phenolic compounds in solution. The second work focused on the development of solid substrates, where gold nanoparticles were synthesized and immobilized on a carbon nanofibers matrix and enhancement capacity of the SERS substrate was evaluated with Rhodamine 110. The use of SERS for the analysis of biological systems was also explored. First, the effect of an oxidative agent (CdTe quantum dots) on the freshwater microalgae H. pluvialis was studied with SERS via colloidal gold nanoparticles. Mammalian cell lines were also analyzed; Colloidal concave gold nanocubes were synthesized and immobilized onto a solid substrate for SERS enhancement of HeLa cells, showing that solid SERS substrates are also suitable for cell analysis. Finally, radiation resistant and radiation sensitive murine leukemia sublines were characterized for the first time by normal Raman spectroscopy and SERS, with the aim of contributing the development of predictive radiosensitivity assays. SERS substrates in colloidal and solid form were developed, and successfully used for the label-free detection of analytes in solution and complex biological samples, showing the versatility of SERS and contributing to this growing multidisciplinary field. !.
(6) Contents 1. Introduction………………………………………………………………...……1 1.1. Motivation……………………………………………………………...……...4 1.2. Problem Statement and Context.............................................................5 1.3. Objectives…………………………………………………………….…........5 2.Surface Enhanced Raman Spectroscopy of Phenolic Antioxidants: A Systematic Evaluation of Ferulic Acid, p-Coumaric Acid, Caffeic Acid and Sinapic Acid………………………………………………………………...…....10 3.Carbon-Based Electrospun Nanofibers Decorated With Gold Nanoparticles as Substrate for SERS…………… ………………….…….…32 4.Interaction Of TGA@CdTe Quantum Dots with an Extracellular Matrix of Haematococcus pluvialis Microalgae using SERS…………………………..43 5. Surface Enhanced Raman Spectroscopy Analysis of HeLa Cells Using a Multilayer Substrate………………………………………………….….………66 6.! Spectroscopic Characterization of Radiosensitive (LY-S) and Radioresistant (LY-R) Murine Leukemia Sublines by Raman spectroscopy and SERS……………………………………………………………………….…….78 7. Conclusions 7.1. Contributions………………………………………………………………...99 7.2. Conclusions………………………………………………………………...100 !.
(7) CHAPTER 1 Introduction Raman spectroscopy is a vibrational spectroscopy technique that provides valuable information about the structure and functional groups of molecules [1]. When a monochromatic excitation source (laser) interacts with matter, it causes the scattering of light. Scattered light can either (a) the same frequency as the incident source (Rayleigh scattering), or (b) a different frequency from the incident source (Raman scattering) [2]. Therefore, the detected Raman shift is the frequency difference between excitation energy and scattered energy. Each molecule has a unique Raman signature, thus making this technique highly specific and label-free. Molecules can be identified based on the spectral fingerprint; a complex sample will have a particular spectra arising from the combined Raman scattering of its constituents. Unlike IR spectroscopy, water has very weak Raman signal, making this technique ideal for analysis of aqueous solutions and biological samples [2]. In addition, Raman measurements require minimal to no sample pretreatment, and once the instrumental parameters are established, measurements can take less than a minute to be acquired. Nonetheless, Raman scattering is a relatively weak process, since photons in virtual states are re-irriadiated, and high amount of molecules or sample are needed in order to obtain an adequate spectrum [3]. Therefore, the analysis of complex samples is limited by the low scattering efficiencies encountered at low concentrations [4]. Spectral quality can be improved by using higher laser power, but some samples (e.g. cells and tissues) are susceptible to photo-damage [5]. Surface Enhanced Raman Spectroscopy (SERS) is a technique that allows overcoming the limitations faced by normal Raman spectroscopy at low concentrations. Amplification of Raman signal by SERS requires the interaction of the sample of interest with metallic nanoparticles (see scheme 1). Schlücker [6] summarizes the basic elements of SERS as the conjunction between the specificity (spectral fingerprint) of Raman spectroscopy and high sensitivity attained in the presence of metallic nanostructures that exhibit localized surface plasmon resonance (LSPR).. ! 1!.
(8) Normal Raman Laser SERS Laser Metallic nanoparticle Analyte. !. Scheme 1. Normal Raman spectroscopy compared to Surface Enhanced Raman Spectroscopy (SERS).. Fleischman et al. first observed the SERS effect in 1974 when studying analytes adsorbed onto a roughened metallic electrode. Nevertheless, the observed enhancement was incorrectly attributed to the high surface area of the electrode [7]. The correct interpretation of said observations, attributed to surface plasmon excitation, was published almost simultaneously by Albercht and Creighton, and Jeanmarie and Van Duyne in 1977 [8]–[10]. Forty years after its discovery, the exact mechanisms of enhancements are still being studied and debated [11]–[14]. To this point, the consensus is that the observed enhancements [8], [15] are mainly explained by two mechanisms: (a) chemical enhancement or charge transfer, and (b) electromagnetic enhancement (EM) [16], [11]. The chemical enhancement or charge transfer (CT) mechanism depends on the chemisorption of the analyte to a metallic nanostructure, which increases the polarizability of the analyte. This causes an interaction between the electrons of the metal and the molecule [18], where a charge transfer from the analyte to the metal surface takes place [17]. Enhancement factor due to CT ! 2!.
(9) have been calculated at 102 and 103 orders of magnitude, which is considerably lower than the enhancements reported for the electromagnetic mechanism (106-1011) [1]. Electromagnetic enhancement depends on plasmons, which are collective oscillation of delocalized electron [17]. Due to the presence of free electrons in metals, charge separation can be induced by an incident field that induce the oscillation of these electrons. In metallic nanostructures, localized surface plasmons (LSP) occur in the surface, causing an enhancement of the electromagnetic field located in the metallic interface [2]. Localized surface plasmon resonance (LSPR) generates an absorption band in the visible region λmax . This λmax depends on the shape, size, material, surrounding medium and interparticle distance [3]. In order to induce LSP, the incident field (i.e. laser source) must be in resonance with the λmax of the plasmon [1]. Induction of LSP is key for obtaining SERS enhancements. Au and Ag nanostructures are usually used as SERS substrates since their surface plasmon λmax is in the visible range, and correspond to available laser excitation wavelengths (e.g., 514, 633, 785 nm lasers) [6], [8]. In addition, Au and Ag nanostructures can be functionalized, and several functional groups can adsorb and bond to their surface [4]–[6]. SERS enhancement is also dependent on the distance between the analyte and the metallic surface, and can decrease considerably at distances over 20 nm [3]. Interparticle spacings ranging between 1-2 nm can generate coupling or hybridization of the LSP, resulting in higher electromagnetic enhacement [6]. In general, the process of electromagnetic SERS enhancement is described as follows: (1) an incident laser generates the excitation of the LSP; (2) the plasmon interacts with the molecules in proximity/or adsorbed to the surface of metallic nanostructures; (3) the molecule exhibits Raman scattering; (4) energy is transferred back to the plasmon [4]. In this process, both the Raman scattering and the excitation wavelength are enhanced by the LSP[6].. Scheme 2. General process of electromagnetic SERS mechanism.. SERS active systems or substrates are therefore defined as structures that can exhibit localized surface plasmon resonance (LSPR) and generate ! 3!.
(10) Raman signal amplification [15]. SERS substrates can be metallic nanoparticles colloidal form, solid substrates supporting metallic nanostructures, or roughened metallic surfaces. Each type of substrate offers different advantages and limitations, but both types are worth exploring, as SERS enhancements can be tailored by changing the material, shape, size and dielectric environment of the metallic nanoparticles [19], [20]. The presence of aggregates is also a key parameter, since, it allows for the existence of hot spots or junctions between nanoparticles where electromagnetic field enhancement of the aggregated nanoparticles is coupled, and in consequence generates a very high and localized enhancement [21]–[23]. Fabrication of SERS substrates can be carried out by top-down and bottomup methods [24], [25]. Top down methods require the use of specific sophisticated equipment, such is the case of lithographic techniques [26]. These types of SERS substrates allow for highly controlled array distribution and signal reproducibility, but sometimes sacrifice the higher enhancements caused by nanoparticle aggregates or small interparticle distances. Bottom up methods are based on wet-chemical synthesis, and the main advantage is that there is no need for expensive or sophisticated equipment. Changing synthesis parameters allows the tailoring of nanoparticle characteristics such as shape and size, and therefore LSPR excitation and SERS enhancements. In addition, nanostructures can be used as colloidal nanoparticles or immobilized in different materials (e.g. glass, silicon and carbon), depending on the application. Since the initial observation 40 years ago, SERS has been employed for the detection of molecules in the environmental, biochemical and biomedical field, among others. In addition, SERS can be used to explore chemical changes in complex biological samples such as cells and tissues [17], [27]–[29]. Given the complex spectral signature of real-life samples, chemometric methods like principal component analysis (PCA), partial least squares (PLS) linear discriminant analysis (LDA), support vector machine (SVM), and decision tree, are employed in order to extract the most valuable information from spectral data, as well as data classification [2]. Like normal Raman spectroscopy, SERS analysis generates specific fingerprint of molecules, and it is a promising technique for the development of ultrasensitive sensors. 1.1. Motivation Most sensing and biosensing applications require high-throughput and ultrasensitive detection. As established previously, the main limitation of normal Raman spectroscopy arises from the low scattering efficiencies, making SERS a technique worth exploring for fast analyte detection. Recently, SERS substrates fabricated by sophisticated methods have emerged, yet, access to such highly sophisticated and expensive equipment is not available everywhere. The main motivation behind this work is to demonstrate that several SERS active substrates can be developed by cheaper, wet-chemical synthesis methods, and are versatile and efficient ! 4!.
(11) enough to used for a wide array of samples. Finally, these efforts can contribute to the advancement and standardization of SERS-based sensors. 1.2. Problem Statement and Context Most established techniques employed to characterize the biochemical state of cells depends on either specific fluorescent labeling [30], or chromatographic methods [31]–[33]. Chromatographic methods offer several advantages, but are limited by being labor intensive, destructive techniques that do not allow in situ monitoring. Spectroscopic methods like Raman spectroscopy offer a suitable alternative for biochemical characterization of cells and tissue that is non-destructive and label free [1], [34]–[36]. Nevertheless, in the case of biological system, a balance must be met between the signal-to-noise ratio and the laser intensity that is exerted upon the sample to avoid photo-damage [5]. Given that normal Raman scattering is limited at low concentrations, the development of SERS substrates facilitates detecting biomolecules in situ without compromising the sample integrity, while maintaining chemical specificity. In the case of single molecule detection, reaching very low detection limits is key, especially for compounds of environmental concern, where concentrations can be in the order of ng/L [37], [38]. Therefore, it is important to develop alternate qualitative sensing techniques, reaching low levels of detection while fast and label-free. 1.3. Objectives The main objective is to develop versatile label-free sensors based on Surface Enhanced Raman Spectroscopy (SERS) that allow the detection of molecules of interest, and the analysis of complex biological systems. Specific objectives of this work are: I. Synthesis and characterization of SERS-active colloidal metallic nanoparticles. II. Development of colloidal SERS substrates. III. Evaluation of colloidal SERS substrates (I,II) as sensors for the detection of a molecule of interest. IV. Evaluation of colloidal SERS substrates (I,II) for the analysis of a biological system (cells). V. Development of solid SERS substrate based on the chemical immobilization of metallic nanoparticles. VI. Evaluation of solid SERS substrates (V) as sensors for the detection of a molecule of interest. VII. Evaluation of solid SERS substrates (V) for the analysis of a biological system.. ! 5!.
(12) References [1] M. Diem, A. Mazur, K. Lenau, J. Schubert, B. Bird, M. Miljković, C. Krafft, and J. Popp, “Molecular pathology via IR and Raman spectral imaging.,” J. Biophotonics, vol. 6, no. 11–12, pp. 855–86, Dec. 2013. [2] J. R. Ferraro, K. Nakamoto, and C. W. Brown, Introductory Raman Spectroscopy. 2003. [3] J. L. Gong, J. H. Jiang, H. F. Yang, G. L. Shen, R. Q. Yu, and Y. Ozaki, “Novel dye-embedded core-shell nanoparticles as surface-enhanced Raman scattering tags for immunoassay,” Anal. Chim. Acta, vol. 564, no. 2, pp. 151– 157, 2006. [4] D. Cialla, A. März, R. Böhme, F. Theil, K. Weber, M. Schmitt, and J. Popp, “Surface-enhanced Raman spectroscopy (SERS): progress and trends.,” Anal. Bioanal. Chem., vol. 403, no. 1, pp. 27–54, Apr. 2012. [5] H. J. Butler, L. Ashton, B. Bird, G. Cinque, K. Curtis, K. Esmonde-white, N. J. Fullwood, B. Gardner, P. L. Martin-, M. J. Walsh, M. R. Mcainsh, N. Stone, F. L. Martin, H. J. Butler, and P. L. Martin-hirsch, “Using Raman spectroscopy to characterize biological materials,” Nat. Protoc., vol. 11, no. 4, pp. 1–47, 2016. [6] S. Schlücker, “Surface-enhanced Raman spectroscopy: Concepts and chemical applications,” Angew. Chemie - Int. Ed., vol. 53, no. 19, pp. 4756– 4795, 2014. [7] M. Moskovits, “Surface-enhanced spectroscopy,” Rev. Mod. Phys., vol. 57, no. 3, pp. 783–826, 1985. [8] K. Kneipp, M. Moskovits, and H. Kneipp, Surface Enhanced Raman Scattering: Physics and Applications, vol. 1. 2006. [9] J. A. Creighton, C. G. Blatchford, and M. G. Albrecht, “Plasma Resonance Enhancement of Raman Scattering by Pyridine Adsorbed on Silver or Gold Sol Particles of Size,” J. Chem. Soc., Faraday Trans. 2, vol. 75, pp. 790–798, 1979. [10] D. L. Jeanmaire and R. P. Van Duyne, “Surface raman spectroelectrochemistry,” Journal of Electroanalytical Chemistry and Interfacial Electrochemistry, vol. 84, no. 1. pp. 1–20, 1977. [11] M. Moskovits, “Persistent misconceptions regarding SERS,” Phys. Chem. Chem. Phys., vol. 15, no. 15, p. 5301, 2013. [12] E. C. Le Ru, S. a Meyer, C. Artur, P. G. Etchegoin, J. Grand, P. Lang, and F. Maurel, “Experimental demonstration of surface selection rules for SERS on flat metallic surfaces.,” Chem. Commun. (Camb)., vol. 47, no. 13, pp. 3903– 3905, 2011. [13] E. C. Le Ru, E. J. Blackie, M. Meyer, and P. G. Etchegoin, “Surface Enhanced Raman Scattering Enhancement Factors: A Comprehensive Study,” J. Phys. Chem. C, vol. 111, no. 37, pp. 13794–13803, 2007. [14] K. Faulds, A. Hernandez-Santana, and W. E. Smith, “The inorganic chemistry of surface enhanced Raman scattering (SERS),” in Spectroscopic Properties of Inorganic and Organometallic Compounds, 2010, pp. 1–21. [15] E. C. LeRu and P. Etchegoin, Principles of surface enhanced Raman spectroscopy and related plasmonic effects, First. Elsevier, 2009. [16] Y. S. Yamamoto and T. Itoh, “Why and how do the shapes of surfaceenhanced Raman scattering spectra change? Recent progress from mechanistic studies,” J. Raman Spectrosc., vol. 47, no. August 2015, pp. 78–88, 2016. [17] M. K. Hossain, Y. Kitahama, G. G. Huang, X. Han, and Y. Ozaki, “Surface-enhanced raman scattering: Realization of localized surface plasmon resonance using unique substrates and methods,” Anal. Bioanal. Chem., vol. 394, no. 7, pp. 1747–1760, 2009. [18] K. C. Bantz, A. Meyer, N. Wittenberg, H. Im, and C. L. Haynes, “Recent progress in SERS biosensing,” Phys. Chem. Chem. Phys., vol. 13, no. 24, pp. 11551–11567, 2011.. ! 6!.
(13) [19] K. L. Kelly, K. L. Kelly, E. Coronado, L. Zhao, E. Coronado, G. C. Schatz, L. L. Zhao, and G. C. Schatz, “The Optical Properties of Metal Nanoparticles: The Influence of Size, Shape, and Dielectric Environment,” J. Phys. Chem. B, vol. 107, no. 3, pp. 668–677, 2003. [20] A. Sabur, M. Havel, and Y. Gogotsi, “SERS intensity optimization by controlling the size and shape of faceted gold nanoparticles,” J. Raman Spectrosc., vol. 39, pp. 61–67, 2008. [21] M. Keating, Y. Chen, I. a Larmour, K. Faulds, and D. Graham, “Growth and surface-enhanced Raman scattering of Ag nanoparticle assembly in agarose gel,” Meas. Sci. Technol., vol. 23, no. 8, p. 84006, 2012. [22] N. J. Borys, E. Shafran, and J. M. Lupton, “Surface plasmon delocalization in silver nanoparticle aggregates revealed by subdiffraction supercontinuum hot spots,” Sci. Rep., vol. 3, p. 2090, 2013. [23] Shiohara Amane, Y. Wang, and L. M. Liz-Marzán, “Recent approaches toward creation of hot spots for SERS detection,” J. Photochem. Photobiol. C Photochem. Rev., vol. 21, pp. 2–25, 2014. [24] B. Sharma, M. Fernanda Cardinal, S. L. Kleinman, N. G. Greeneltch, R. R. Frontiera, M. G. Blaber, G. C. Schatz, and R. P. Van Duyne, “Highperformance SERS substrates: Advances and challenges,” MRS Bull., vol. 38, no. 8, pp. 615–624, 2013. [25] M. Fan and A. G. Brolo, “Silver nanoparticles self assembly as SERS substrates with near single molecule detection limit.,” Phys. Chem. Chem. Phys., vol. 11, no. 34, pp. 7381–9, Sep. 2009. [26] M. E. Stewart, C. R. Anderton, L. B. Thompson, J. Maria, S. K. Gray, J. a. Rogers, and R. G. Nuzzo, “Nanostructured plasmonic sensors,” Chem. Rev., vol. 108, no. 2, pp. 494–521, 2008. [27] R. H. Lahr and P. J. Vikesland, “Surface-Enhanced Raman Spectroscopy (SERS) Cellular Imaging of Intracellulary Biosynthesized Gold Nanoparticles,” 2014. [28] A. F. Palonpon, J. Ando, H. Yamakoshi, K. Dodo, M. Sodeoka, S. Kawata, and K. Fujita, “Raman and SERS microscopy for molecular imaging of live cells.,” Nat. Protoc., vol. 8, no. 4, pp. 677–92, Apr. 2013. [29] R. a Halvorson and P. J. Vikesland, “Surface-enhanced Raman spectroscopy (SERS) for environmental analyses.,” Environ. Sci. Technol., vol. 44, no. 20, pp. 7749–55, Oct. 2010. [30] X. Qu, J. Wang, Z. Zhang, N. Koop, R. Rahmanzadeh, and G. Hüttmann, “Imaging of cancer cells by multiphoton microscopy using gold nanoparticles and fluorescent dyes.,” J. Biomed. Opt., vol. 13, no. 3, p. 31217, 2008. [31] O. Samek, A. Jonáš, Z. Pilát, P. Zemánek, L. Nedbal, J. Tříska, P. Kotas, and M. Trtílek, “Raman microspectroscopy of individual algal cells: sensing unsaturation of storage lipids in vivo.,” Sensors (Basel)., vol. 10, no. 9, pp. 8635–51, Jan. 2010. [32] P. Bourget, A. Amin, F. Vidal, C. Merlette, and F. Lagarce, “Comparison of Raman spectroscopy vs. high performance liquid chromatography for quality control of complex therapeutic objects: Model of elastomeric portable pumps filled with a fluorouracil solution,” J. Pharm. Biomed. Anal., vol. 91, pp. 176–184, 2014. [33] G. Wang, Z. Hao, Z. Huang, L. Chen, X. Li, C. Hu, and Y. Liu, “Raman spectroscopic analysis of a desert cyanobacterium Nostoc sp. in response to UVB radiation.,” Astrobiology, vol. 10, no. 8, pp. 783–8, Oct. 2010. [34] I. Notingher, “Raman Spectroscopy Cell-based Biosensors,” Sensors, vol. 7, no. 8, pp. 1343–1358, Jul. 2007.. ! 7!.
(14) [35] J. Kneipp, H. Kneipp, M. McLaughlin, D. Brown, and K. Kneipp, “In vivo molecular probing of cellular compartments with gold nanoparticles and nanoaggregates.,” Nano Lett., vol. 6, no. 10, pp. 2225–31, Oct. 2006. [36] E. Brauchle, S. Thude, S. Y. Brucker, and K. Schenke-Layland, “Cell death stages in single apoptotic and necrotic cells monitored by Raman microspectroscopy.,” Sci. Rep., vol. 4, p. 4698, Jan. 2014. [37] S. Huntscha, H. P. Singer, C. S. McArdell, C. E. Frank, and J. Hollender, “Multiresidue analysis of 88 polar organic micropollutants in ground, surface and wastewater using online mixed-bed multilayer solid-phase extraction coupled to high performance liquid chromatography-tandem mass spectrometry,” J. Chromatogr. A, vol. 1268, pp. 74–83, 2012. [38] M. S. Kostich, A. L. Batt, and J. M. Lazorchak, “Concentrations of prioritized pharmaceuticals in effluents from 50 large wastewater treatment plants in the US and implications for risk estimation,” Environ. Pollut., vol. 184, pp. 354–359, 2014. [39] M. Fan, G. F. S. Andrade, and A. G. Brolo, “A review on the fabrication of substrates for surface enhanced Raman spectroscopy and their applications in analytical chemistry.,” Anal. Chim. Acta, vol. 693, no. 1–2, pp. 7–25, May 2011.. ! 8!.
(15) CHAPTER 2 Single molecule detection. Surface Enhanced Raman Spectroscopy of Phenolic Antioxidants: A Systematic Evaluation of Ferulic Acid, p-Coumaric Acid, Caffeic Acid and Sinapic Acid. This chapter has been published as: I. Aguilar-Hernández, et al., Vib. Spectrosc. 89 (2017) 113–122. DOI:10.1016/j.vibspec.2017.02.002 ! 9!.
(16) Chapter 2 Surface Enhanced Raman Spectroscopy of Phenolic Antioxidants: A Systematic Evaluation of Ferulic Acid, p-Coumaric Acid, Caffeic Acid and Sinapic Acid 1. Introduction Ferulic acid, p-coumaric acid, caffeic acid and sinapic acid are examples of important natural phenolic antioxidants [1]. Due to the potential beneficial effects of these compounds regarding human health, considerable evidence about other properties such as UV-protection, anti-carcinogenic and antiinflammatory properties, as well as cardiovascular protection have been reported [2]–[5]. Phenolic acids are rarely found in their free forms [6], [7]. Nonetheless, studies indicate that free phenolic compounds show an increase of their antioxidant capacity. Other studies about bioavailability indicate that free ferulic acid can be absorbed along the entire gastrointestinal tract, furthermore, free p-coumaric acid is also rapidly absorbed, but in an intact form [7]. Moreover, these compounds by themself, have many industrial applications, for example, they can be used as natural preservatives for foods, and applied in the production of paints, paper, and cosmetics [8]. Therefore, there is an increasing development of methods for liberation of natural antioxidants from plant materials for industrial applications [9], [10]. Characterization and quantification of phenolic compounds can be determined by various analytical instrumental methods of which liquid chromatography is the technique of choice, allowing to reach limits of detection in the order of 108 to 10-12 M [11]–[16]. However, in some cases, factors such as costs, realtime implementation of analysis, assortment of standards, use of solvents and pretreatment of samples can restrict the use of chromatography methods, thus limiting a high-throughput analytical quality control [17]. Raman spectroscopy is a well-known non-destructive vibrational technique for structural analysis and quantification of molecules. The fast analytical response and the safe contextual analysis to get measurements leading to a non-intrusive property [18]–[20] are only limited by the low scattering efficiency [21] which can restrict its applicability for analytes at low levels of concentration. To enhance the Raman scattering efficiency [22], [23], the use of particles of noble metals (e.g., Ag, Au) in the 10–100 nm size range is a procedure to create hot spots that ultimately interact with the analyte to produce resonant vibronic coupling of the adsorbate’s vibration to the plasmon’s transition dipole [24]–[28]. Such mechanism requires the formation of a metal–adsorbate chemical bond, sometimes referred as a first-layer effect [29]. Over the years, surface enhanced Raman scattering (SERS) has proven to be a powerful platform for the quantitative trace analysis of a large number of biomolecules including amino acids [30]–[32], proteins [33]–[35], DNA [36], [37], and in vivo detection of analytes in cellular environments [38]–[41]. Owing to the benefits of using the SERS technique for quantitative detection of important bioactive molecules [42]–[45] several factors have to be taken into consideration [46]. In particular nanoparticle size, shape and aggregation, !. 10!.
(17) as well as the type of substrate (e.g., colloids and solid state) employed, and the pH of the solution studied are subjected to a more refined quality assessment to gain a criteria of sensitivity [47]. A survey of the literature reveals that a few SERS-based studies were focused on the collection of quantitative results in which the limits of detection have been well established [34], [48]–[51]. The main objective of this study was to develop a SERS method for the identification of four free phenolic antioxidants, namely, ferulic acid, pcoumaric acid, caffeic acid and sinapic acid. Principal Component Analysis (PCA) was applied and performed to classify the as-prepared silver colloids based on the concentration of reagent employed and the nanoparticle size obtained (including their aggregation). Semi-quantitative analysis with glycine as the probe molecule was carried out to gain an insight into the sensitivity in the SERS-determination for the phenolic compounds. The method proposed is more sensitive for detection of p-coumaric acid and caffeic acid than previous reports [42]–[45], [52] in which the limits of detection are within the range of 10–3 to 10–4 M. In this study, for the first time, the SERS-detection of sinapic acid is reported; the lowest limit of detection reached was in the order of 10–9 M.. !11!.
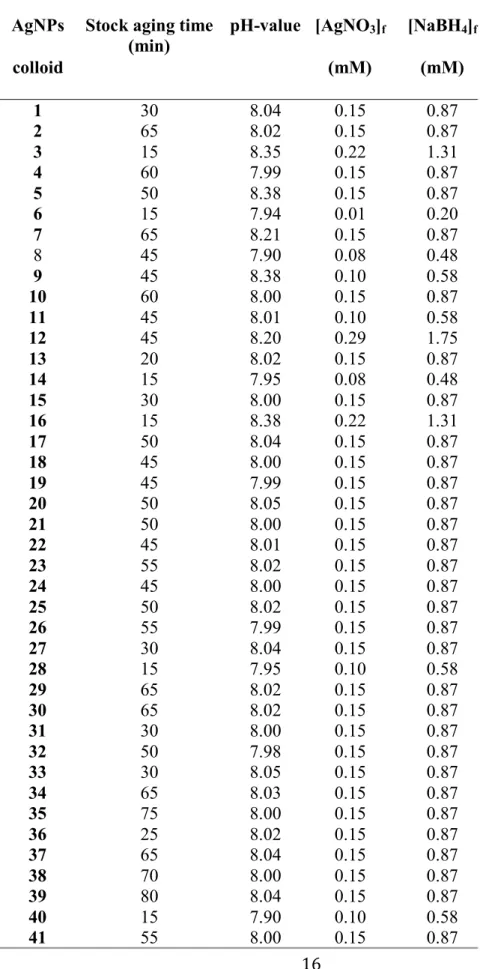
(18) 2. Experimental details 2.1. Chemicals and reagents Silver nitrate (AgNO3, 99%), sodium borohydride (NaBH4, 99%), glycine (Gly, 99%), ferulic acid (4-hydroxy-3-methoxy cinnamic acid, >98%), p-coumaric acid (3-(4-hydroxyphenyl)-2-propenoic acid, >98%), caffeic acid (3-(3,4dihydroxyphenyl)-2-propenoic acid, >98%), sinapic acid (4-hydroxy-3,5dimethoxy-cinnamic acid, >98%), nitric acid (HNO3, 70%) and ethanol analytical pure reagent were purchased from Sigma–Aldrich. All the reagents are reactive grade and were used without additional purification. When it was required, aqueous solutions were prepared using ultrapure water (18.2 MΩ cm–1) purified with a Milli-Q® System (Millipore Corp., USA). 2.2. Preparation of SERS-active silver colloids Silver colloids were prepared by a modified Creighton method [53]. A stock solution was made by adding 10 mL of AgNO3 (3.5 mM) dropwise to 30 mL of freshly prepared NaBH4 solution (7 mM) cooled in an ice bath. The reaction was carried out in an open system under continuous stirring for 3 min [54]. Aging of the stock solution after synthesis was varied from 15 to 80 min, a factor that can influence in the size and aggregation of colloidal particles produced. Afterwards, aliquots of stock solution were transferred to clean beakers and diluted with deionized water to attain the final concentrations. A total number of 41 different silver colloidal suspensions were prepared by varying both the aging and final concentration (Table 1), which all were kept in darkness. No additional stabilizing agents besides excess NaBH4 were used in order to prevent undesirable salt-mediated reactions [55]. 2.3. Silver colloid characterization The formation of silver nanoparticles (AgNPs) was confirmed by UV-Vis spectroscopy and transmission electron microscopy (TEM). All the UV-Vis absorption spectra of the silver colloidal solutions were obtained over the region from 325 to 550 nm using a photodiode array Agilent 8453 UV-Visible spectrophotometer (Agilent Technologies, Waldbronn, Germany). The morphology of AgNPs was investigated with a Morgagni 268 electron microscope (FEI, Co) operated at 80 kV. TEM samples were prepared by casting 5 mL of selected colloidal samples onto carbon coated copper grids (Ted Pella, Redding, CA). Excess solution was then removed with paper filter and dried at room temperature for approximately 60 min. The average diameters of the nanoparticles were determined using ImageJ 1.43u software (Wayne Rasband National Institutes of Health, USA). 2.4. Principal Component Analysis UV-Vis absorption spectra measurements taken from silver colloidal suspensions were analyzed by Principal Component Analysis (PCA) to cluster the colloids synthesized with different concentration of precursor and aging period of the stock solution. PCA is a useful statistical tool to estimate the effect of the preparation of colloids since PCA can reduce the dimensionality of a data set by finding an alternative set of coordinates called principal components [56]. This analysis linearly transforms a data matrix, which !12!.
(19) contains information related to the UV-Vis absorption spectra, to new variables of few dimensions (e.g., concentration of reagents, nanoparticle size and aggregation). Thus the PCs are ranked according to their variance; PC1 corresponds to the new variable with the maximum variance (i.e., concentration of silver), and PC2 is the second variable (i.e., size of AgNPs) that contains all of the information not included in PC1. The score values of the principal components were used to associate the as-obtained silver colloids in clusters according to trends in the data obtained. Data analysis was carried out using The Unscrambler® X version 10.1 software package. 2.5. Surface-enhanced Raman spectra measurements SERS measurements were acquired using a LabRam HR 800 Raman spectrometer (Horiba Scientific, France) equipped with a He-Ne laser (15 mW) operating at 633 nm. A 40 mm objective lens was used for sample focusing; the collection of Raman spectra were accumulated over 4 s. Scattered light was collected by a CCD camera thermoelectrically cooled at – 70 ºC. Raman scattering was dispersed with a 200 lines/mm grating, which resulted in spectra in the range from 400 to 2600 cm-1. SERS spectra were recorded in 1-mL quartz cells filled with silver colloidal mixed with the required amount of analyte. 2.5. Analysis of antioxidants The effect of pH on the SERS enhancement was studied by mixing each analyte (FA, 4CA, CA and SA) with the silver colloid to obtain a final concentration of 7.5x10⁻⁶ M. The concentration was fixed, and pH was varied in a range from 2 to 12 using HNO3. The pH of the solution was measured with a pH meter. For studying the variation of SERS spectra with concentration, a stock solution of 1x10⁻² M of each analyte and silver colloid were mixed in a final volume of 1 mL, to obtain working concentrations between 2.5 × 10⁻⁹ M and 7.5 × 10⁻⁶ M. pH of the solution was 6.5, 6.3, 5.5 and 6.3 for FA, 4CA, CA and SA, respectively. The area under the curve of each SERS spectra was calculated in the range of 1100 to 1700 cm-1 using the Origin 9.1 software package.. !13!.
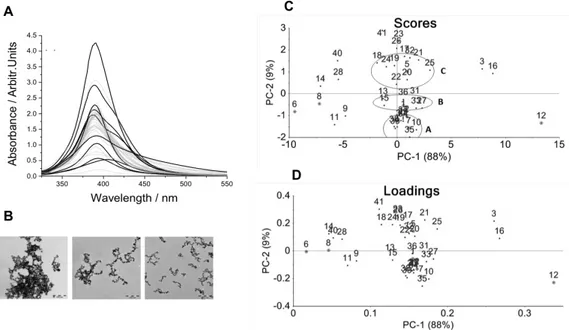
(20) 3.. Results and discussion. 3.1. Characterization of silver colloids Aging time of the stock solution can allow the formation of individual nanoparticles of different sizes [30]. Subsequent dilution can induce precipitation [57] since the concentration of NaBH4 is reduced. Such differences can be highlighted as the systematic changes observed in the shape of the UV-Vis absorption bands (e.g., broadening absorbance peak, shoulders and lmax shifts). The UV-Vis absorption spectra of the colloidal suspensions are shown in Figure 1A. It can be observed that the position of the main surface plasmon resonance peak is located at around 390 nm, providing evidence of AgNPs formation. Also, a pale yellow solution is a good indication that the chemical reaction took place and that the seeds available in the solution ranges from 5 to 20 nm in diameter, in agreement with previous studies reported elsewhere [30], [58]. In Figure 1A, the sharpness of some peaks suggests the uniqueness of the particle-size when the peak width half medium (PWHM) is approximately 25 nm. On the other hand, the existence of colloids with several particle sizes was observed through the formation of dark-brown color solutions, in which their corresponding absorption bands show the emergence of shoulders, which can be related with the presence of particles of different size [59], [60]. A red shift in the λmax indicated the formation of larger particles [61], [62] whose bands of absorption are broader and located at 406 nm. PCA analysis was carried out to cluster the colloidal suspensions according to variances in concentration, aggregation and size of nanoparticles. Table 1 shows the conditions of preparation of the used colloids. As observed in Figure 1C, the score plot of PC1 (88% of the total variance) versus the score plot of PC2 (9% of the total variance) separates the colloids in clusters that were grouped in the four quadrants. Samples of colloids observed in both the left and right side (e.g., colloids 3, 6, 8, 9, 11, 12, 14, 16, 28, etc.) were not clustered by the PCA since they correspond either the lowest or the highest concentrations tested respectively. However, several colloids were clustered at the center of the plot, which can be distinguished by variances along the PC1 and PC2 axes. In particular, the PC2 axis spans the variation in the nanoparticle size and aggregation, from large-aggregated (bottom) to small (top). The colloids prepared with a intermediate values of concentration are located at the center, namely, (A) the colloids obtained within an aging period of 60-80 min, which showed a largest nanoparticle sizes and aggregation (–2 < PC2 < –1); (B) the colloids obtained within a period between 15 and 30 min, which showed medium nanoparticle sizes (–0.5 < PC2 < 0.5); and finally (C) the colloids obtained within aging periods from 45-60 minutes, which exhibited the smallest nanoparticle sizes (0.5 < PC2 < 1.5). In the synthesis of the colloids, the reducer is also used as stabilizer (NaBH4), therefore, the aging time affects not only the aggregation but also the nanoparticle size. These features confer together differentiation among UV spectra, which is reflected in the PCA study.. !14!.
(21) Figure 1. A) UV-Vis spectra of the synthesized Ag colloids. B) Representative TEM micrographs of colloids with high and low levels of aggregation (Left and right). C) PCA score plot and D) PCA loadings.. Representative TEM images of silver colloids are shown in Figure 1B. Although sample preparation for TEM measurements can impact the morphology of the nanoparticles, this technique has been used to reinforce the observations derived from the UV-spectra analysis regarding size and nanoparticle aggregation between selected colloids [7]. It was observed that AgNPs are predominantly spherical in shape. The profile measurements showed that the diameter of these particles is roughly 2-15 nm (small size), 320 nm (medium size) and 8-30 nm (large size). Moreover a lower degree of aggregation was observed for the colloids in which individual particles display an average size of about 8.5±3 nm (Fig. 1B, right, while the colloids with larger particles of 19.0 ± 2 nm showed a high level of aggregation (Fig. 1B, left). These observations suggested that the aging period of the stock solution could induce changes in the size and aggregation of the AgNPs.. !15!.
(22) Table 1. Synthesis conditions for silver colloids. AgNPs colloid 1 2 3 4 5 6 7 8 9 10 11 12 13 14 15 16 17 18 19 20 21 22 23 24 25 26 27 28 29 30 31 32 33 34 35 36 37 38 39 40 41. Stock aging time pH-value [AgNO3]f (min) (mM) 30 65 15 60 50 15 65 45 45 60 45 45 20 15 30 15 50 45 45 50 50 45 55 45 50 55 30 15 65 65 30 50 30 65 75 25 65 70 80 15 55. 8.04 8.02 8.35 7.99 8.38 7.94 8.21 7.90 8.38 8.00 8.01 8.20 8.02 7.95 8.00 8.38 8.04 8.00 7.99 8.05 8.00 8.01 8.02 8.00 8.02 7.99 8.04 7.95 8.02 8.02 8.00 7.98 8.05 8.03 8.00 8.02 8.04 8.00 8.04 7.90 8.00. 0.15 0.15 0.22 0.15 0.15 0.01 0.15 0.08 0.10 0.15 0.10 0.29 0.15 0.08 0.15 0.22 0.15 0.15 0.15 0.15 0.15 0.15 0.15 0.15 0.15 0.15 0.15 0.10 0.15 0.15 0.15 0.15 0.15 0.15 0.15 0.15 0.15 0.15 0.15 0.10 0.15 !16!. [NaBH4]f (mM) 0.87 0.87 1.31 0.87 0.87 0.20 0.87 0.48 0.58 0.87 0.58 1.75 0.87 0.48 0.87 1.31 0.87 0.87 0.87 0.87 0.87 0.87 0.87 0.87 0.87 0.87 0.87 0.58 0.87 0.87 0.87 0.87 0.87 0.87 0.87 0.87 0.87 0.87 0.87 0.58 0.87.
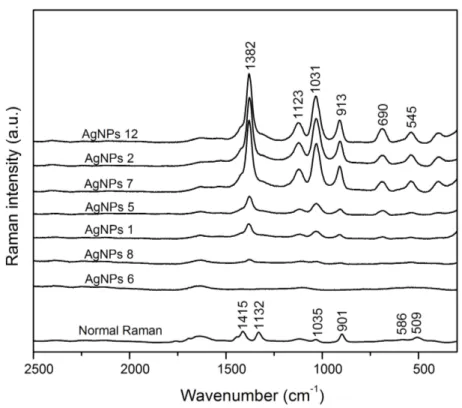
(23) 3.2. Evaluation of SERS-active silver colloids with a probe molecule Selected silver colloids from PCA clusters A, B and C, as well as nonclustered colloids were used to test the SERS activity using glycine (Gly) as a probe molecule with well known Raman and SERS peaks [63]–[65] in order to identify the optimal conditions of colloidal synthesis which allows the formation of hotspots caused by particle aggregation [66] and their further use for study of antioxidants. The enhancement in the intensity of glycine (2.5 × 10⁻³ M) by using different AgNPs colloids against normal Raman scattering (1M) is shown in Fig. 2. The pH for all the synthesized colloids was adjusted to a value of 8.0 to promote deprotonation of COOH (pKa = 2.3, carboxylate) [30], [31], [63]. Therefore, the interaction of Gly with AgNPs was highly improved using a higher population of molecules with negative partial charges (i.e., Gly anion). As compared to the corresponding Raman spectrum, the SERS enhancement observed can be particularly remarked for the peak assigned to a symmetric stretching vibration for the carboxylate group (–COO–) at ~1382 cm–1. Such vibration corresponds to the adsorption of the amino acid onto the surface of AgNPs through the carboxylate [14]; there is no indication of the 1600-cm–1 vibration related to the carboxyl group (–COOH) [15]. As Fig. 2 shows, the highest SERS intensities were obtained for colloids located at PC1>0, while lowest intensities were obtained for colloids located at PC1< 0. In particular, high intensities were observed for the colloids 2 and 7 located in cluster A. Moreover, it was observed that low nanoparticle concentration (e.g., colloids 6 and 8) produced no significant signals. According to PCA analysis, those colloids have a suitable nanoparticle size to allow detection of analytes at very low levels of concentration; nonetheless, a certain degree of nanoparticle aggregation [56, 57] is needed in order to obtain the enhancement. PCA analysis (PC2 < 0) suggested that the colloids obtained by aging stock solution between 60 and 80 min and high concentration can produce the highest enhancement of SERS signals (e.g. colloid 12). Therefore one of the most critical parameter on the SERS enhancement is the nanoparticle aggregation, possibly due to the number of active sites upon which the analytes are adsorbed, as reported for molecules like nile blue [19] caffeine [54], tryptophan [30] and proteins [48].. !17!.
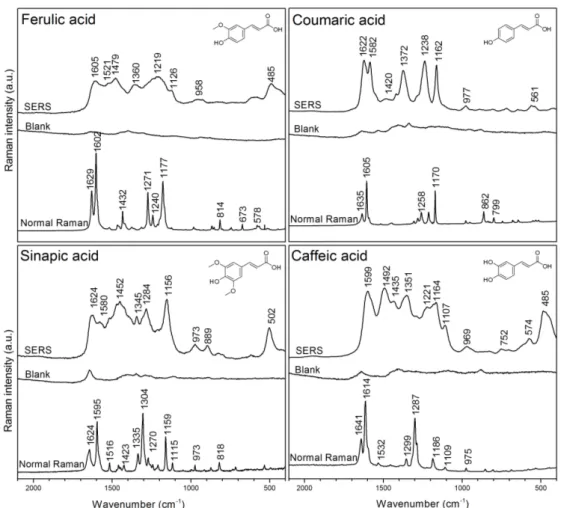
(24) Figure 2. Comparison of normal Raman and SERS spectra of Gly adsorbed on several Ag colloids. These colloids are circled in the PCA scatter plot. Gly concentration was 1 M for normal Raman and 2.5x10⁻³ M for SERS test. Both measurements were carried out in solution. Spectra are ordered from highest to lowest signal enhancement.. 3.3. SERS-based method for systematic evaluation of antioxidants SERS spectra of ferulic acid (FA), p-coumaric acid (4CA), caffeic acid (CA) and sinapic acid (SA) obtained with silver colloidal solutions are shown in Figure 3. Initially, the SERS-active silver colloids tested were the samples 7, 2, 12, allocated in those variances representing the values PC1> 0 and PC2 <0 since they have shown high performance for SERS effect (data not shown). Finally, colloid 12 was employed for all further experiments with antioxidants. In Figure 3, FA, 4CA, CA and SA analytes were used with a concentration of 7.5 × 10⁻⁶ M, which was the highest concentration analyzed by SERS technique in this work, and where the peaks are more defined for their respective assignment. For comparison, the normal Raman spectra were obtained from a film made by drop casting an aliquot of 1 M solution of antioxidants molecules onto aluminum substrates and followed by air-drying. The background (i.e., silver colloids) level is as low as constant that do not contribute to the signals detected. Band assignments obtained from Raman and SERS measurements are provided in Table 2.. !18!.
(25) Table 2. Raman and SERS vibrational frequencies (in cm–1) of ferulic acid (FA), pcoumaric acid (4CA), caffeic acid (CA) and sinapic acid (SA) and their tentative band assignments.. SERS (cm-1) FA 4CA 487 561 958. 977. 1126 1219 1360. 1162 1238 1372 1420. 1479 1521 1605. 1584 1622. Assignment CA. SA. 485 574 752. 502. 969 1107 1164 1221 1351 1435 1492 1599. 899 973 1156 1284 1345 1452 1580 1624. o-dyphenlyl deformation, ring out-of-plane bending COO- in-plane bending C-H and C-C out-of-plane bending C-C stretching, C-OO- stretching Out-of-plane C-H bending -OH bending In-plane C-H bending C-O stretching -COO- stretching Phenyl ring stretch, -OH bending, C-O stretching -OCH3 bending, -OH bending C=C stretching Phenyl ring deformation. Figure 3. SERS (7.5 × 10⁻⁶ M), Ag colloid blank and normal Raman spectra (1M) of CA, FA, 4CA and SA. The Ag colloid blank consists of 2.56% of EtOH, 97.44% of AgNP colloid and was adjusted to pH 6.44 with HNO3. Spectra are average of 5 individual measurements.. !19!.
(26) The main characteristic bands located in the SERS spectra are the stretchingtype modes of the –COO– moieties and C=C bonds that leads to deformation of phenyl rings. The symmetric –COO– stretching appeared at 1360, 1372, 1351 and 1345 cm–1 while the C=C [52], [68] stretching were observed at 1521, 1584, 1492 and 1580 cm–1 for FA, 4CA, CA and SA analytes, respectively. The phenyl ring deformations appeared as intense bands at 1605, 1622, 1605 and 1624 cm–1 in the corresponding spectrum. The bands located at 1126, 1162, 1164 and 1156 cm–1 can be attributed to in-plane C–H bending vibrations, while the bands at 958, 977, 969 and 973 cm–1 may be assigned to out-of-plane C–H bending vibrations for FA, 4CA, CA and SA, respectively. The difference observed in the wavenumbers and relative intensities is explained in terms of physical adsorption of the analytes to the AgNPs surface [69, 70]. For instance, the presence of the band in the region 1370-1340 cm–1 pointed out a possible interaction via the carboxylate group. However, a close inspection reveals that the adsorption can also take place through other different conformations. This is the case for CA, in which the existence of two bands in the region 580-480 cm–1 suggested that the adsorption occurred through the o-diphenyl moiety, and thus the analyte can be adsorbed to AgNPs through a perpendicular orientation [46]. Moreover, the appearance of a high intensity band seen at 485 cm–1 was related to polymerization of CA [45]. In the case of FA, the SERS spectrum also showed the aforementioned bands but in contrast to CA, a broader and low intensity band was observed at about 550-500 cm–1. In the cases of 4CA and SA, there was observed only a weak band at 561 and 502 cm–1, respectively. The evident change observed at this region is a consequence of the chemical nature of the analytes, and thus can be directly dependent of the sum of the surface effects (e.g., electronic effects, steric hindrance and pH of the solution). Finally, the normal Raman spectra for each antioxidant (1 M) were obtained and compared to the corresponding SERS spectrum (1 × 10⁻⁶ M). The SERS enhancement factor (EF = ISERS/IR × CR/CSERS) was calculated for the peak at about 1610 cm–1 and thus was estimated to be approximately 5.4 × 10⁵. This definition is particularly suited to the case of SERS active liquids such as the case of colloidal solutions [71].. !20!.
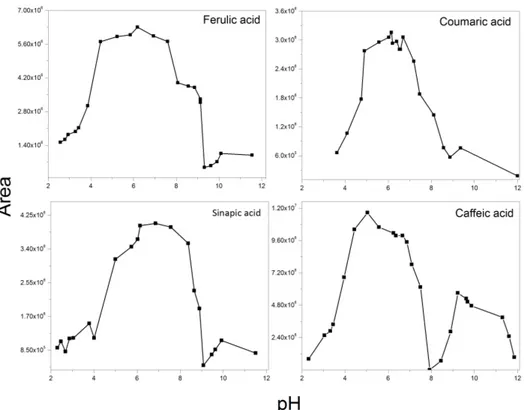
(27) Figure 4. Dependence of SERS intensity on the pH value. Concentration was fixed at 7.5x10⁻⁶M and the pH was modified from 2 to 12 and the SERS spectra were acquired for each value. The area under the curve was calculated for peaks in the region between 1100 and 1700 cm–1.. Figure 4 shows the pH dependence for SERS spectra of phenolic antioxidants obtained in the pH range of 2 to 12. The SERS spectra were obtained and the areas were calculated for the spectral region between 1100 and 1700 cm–1. This range was used to calculate absolute SERS enhancement, since the pH variations could affect the molecular conformation of the analyte and hence its interaction with the colloid surface. The maximum areas were observed at pH values from 5.0 to 6.5. The SERS spectra changed at different pH values, which suggested that the adsorption orientation on nanoparticles is pHdependent [72]. Based on the pKa values [20] corresponding to the –COOH groups of the antioxidants analyzed (see Scheme 1), the latter indicated that the chemical analyte–AgNPs interaction occurred in anionic form (i.e., such as a carboxylate), as observed for Gly. At the more acidic pH values, the overall spectral quality is totally modified giving rise to smaller areas. Those changes in the spectrum can be attributed to decomposition of analytes. However, it is also well known that SERS spectra are elusive to detection because of the instability of colloids under extreme pH conditions [74]. Therefore, a less dramatically change in the SERS spectra was observed up to pH values within 7 and 7.5, which suggested the interaction of carboxylate group. It is noteworthy that other anionic species can be formed due to partial deprotonation of the –OH groups. Taking into account the second pKa value [73] of the antioxidants studied, it was observed that very weak bands in the SERS spectrum were obtained at pH > 9 values. For the case of CA, !21!.
(28) enhancement of SERS signals were observed at basic pH values within 8 and 10, probably due to a reorientation of analyte on the silver surface. Thus, the enhancement in the SERS spectra was corroborated by the appearance of a strong band attributed to the phenol n(C–O) stretching vibration located at 1219, 1238, 1221 and 1284 cm–1 for FA, 4CA, CA and SA, respectively. The adsorption of the second anionic structure onto AgNPs may stabilize the phenolate form of antioxidants; however experimental limitations hinder the observation of a possible Ag–O interaction (~250-350 cm–1) [75,76]. As a whole, these results pointed out the importance of the pH value to attain reproducible SERS spectra when using silver colloidal solutions.. Figure 5. Concentration dependent SERS spectra of FA, 4CA, SA and CA adsorbed onto Ag colloids.. Figure 5 shows the SERS detection at different levels of concentration of analytes. The SERS spectra cover a concentration range between 7.5 × 10⁻⁶ M and 2.5 × 10⁻⁹ M. As described above, the largest SERS enhancements were obtained for dilute solutions of antioxidants that were particularly adjusted to those pH values. The SERS spectra of SA, FA, 4CA and CA were recorded at 6.3, 6.5, 6.3 and 5.5 pH value, respectively. The lowconcentration (2.5 × 10⁻⁹ M) spectra showed two characteristic bands observed at about 1360 and 1610 cm–1 and attributable to ns(COO–) and inplane C=C stretching mode, respectively. On the other hand, the SERS spectra of SA were recorded at pH 6.1. The SERS spectrum of SA showed an intense band located at 1452 cm–1 attributable to –OCH3 bending. However !22!.
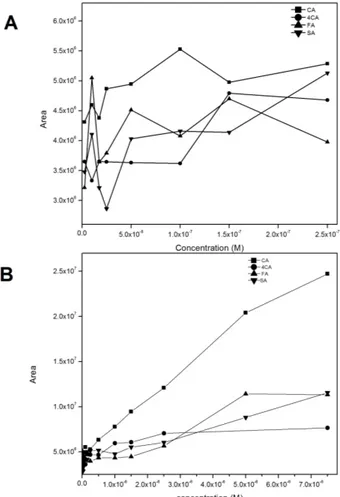
(29) fluctuations of the SERS intensities at concentrations lower than 1 × 10⁻⁸ M were observed. Differences in the relative intensities recorded can be explained in terms of chemical adsorption of the analytes to AgNPs. Due to steric hindrance of the –OCH3 groups, which are adjacent to –OH group, SA can be only adsorbed to AgNPs through a nonperpendicular orientation. The interaction between the ring and the silver surface is supported by the strong intensity of the C=C ring stretching mode observed at 1605 cm–1, which is clearly visible at higher concentrations. However, the orientation of SA is quite difficult to determine due to the analyte keeps very low symmetry (Cs point group). To verify the univariate linear dependence of the SERS-based method, calibration curves were obtained by plotting the SERS intensities of the SERS spectra against the antioxidant concentration in a range from 2.5 × 10⁻⁹ M to 7.5 × 10⁻⁶ M.. Figure 6. Calibration curves for of CA, 4CA, FA and SA from (A) 2.5x10⁻⁹ M to 2.5x10⁻⁷ M and (B) 2.5x10⁻⁹ M to 7.5 x10⁻⁶ M.. Figure 6A and 6B shows graphs of concentration versus areas, which were calculated for the spectral region between 1100 and 1700 cm–1. For the purpose of semi-quantitative detection, high sensitivity was observed for CA, 4CA, FA and SA. However, there is no significant correlation at low concentrations, as shown in Fig. 6A. These results can be attributed to the chemical structure of the analytes, which should cover the surface of !23!.
(30) nanoparticles only at a submonolayer level [77]. Particularly, despite the lack of correlation at low concentrations of SA, this is the first study in which this phenolic antioxidant was detected by a SERS method, with a limit of detection in the order of 1x10⁻⁹ M. In the case of higher concentrations of analyte (Figure 6B), a dependence of the SERS spectra on the concentration was observed, with correlation coefficients of 0.993, 0.986, 0.945, 0.989 for CA, 4CA, FA and SA, respectively.. !24!.
(31) 4.Conclusions A PCA analysis was employed as a useful tool to cluster the colloids prepared in this work on the basis of their concentration aggregation and nanoparticle size, in order to gain insights into the sensitive and quantitative SERS determination. Tests with diverse colloids show that not any colloidal solution can generate sensitive SERS measurements; some of them offered poor levels of enhancement or produced no signal at all, even when working with a test molecule like the amino acid glycine. Selected conditions for colloidal synthesis such as high concentration and long aging times (Table 1) were used for the development of a highly sensitive SERS-based method for the detection of ferulic acid, p-coumaric acid, caffeic acid, and sinapic acid. The prepared SERS-active silver colloids showed an effective enhancement of Raman signals allowing the sensitive detection of the analytes at low concentrations (2.5x10⁻⁹M). For 4CA and CA, these low detections were reached for the first time. In addition, the SERS analysis of SA using silver colloids is also detected for the first time. Moreover, it was observed that the enhancement of SERS signals was highly dependent on pH, and subsequently on the chemical structure of each analyte at a specific pH value and its interaction with the surface of the metallic nanoparticles. !25!.
(32) References [1]. T. P. Kondratyuk and J. M. Pezzuto, “Natural Product Polyphenols of Relevance to Human Health,” Arch. Physiol. Biochem., vol. 42, no. s1, pp. 46–63, 2004. [2] M. Srinivasan, A. R. Sudheer, and V. P. Menon, “Ferulic Acid: therapeutic potential through its antioxidant property.,” J. Clin. Biochem. Nutr., vol. 40, no. 2, pp. 92–100, 2007. [3] C. Luceri, L. Giannini, M. Lodovici, E. Antonucci, R. Abbate, E. Masini, and P. Dolara, “p-Coumaric acid, a common dietary phenol, inhibits platelet activity in vitro and in vivo.,” Br. J. Nutr., vol. 97, no. 3, pp. 458–63, 2007. [4] M. Touaibia, J. Jean-François, and J. Doiron, “Caffeic Acid, a versatile pharmacophore: an overview.,” Mini Rev. Med. Chem., vol. 11, no. 8, pp. 695–713, 2011. [5] N. Nićiforović and H. Abramovič, “Sinapic acid and its derivatives: Natural sources and bioactivity,” Compr. Rev. Food Sci. Food Saf., vol. 13, no. 1, pp. 34–51, 2014. [6] A. H. Laghari, S. Memon, A. Nelofar, K. M. Khan, and A. Yasmin, “Determination of free phenolic acids and antioxidant activity of methanolic extracts obtained from fruits and leaves of Chenopodium album,” Food Chem., vol. 126, no. 4, pp. 1850–1855, 2011. [7] A. Ota, H. Abramovič, V. Abram, and N. Poklar Ulrih, “Interactions of pcoumaric, caffeic and ferulic acids and their styrenes with model lipid membranes,” Food Chem., vol. 125, no. 4, pp. 1256–1261, 2011. [8] K. Hayat, X. Zhang, H. Chen, S. Xia, C. Jia, and F. Zhong, “Liberation and separation of phenolic compounds from citrus mandarin peels by microwave heating and its effect on antioxidant activity,” Sep. Purif. Technol., vol. 73, no. 3, pp. 371– 376, 2010. [9] V. A. Papillo, P. Vitaglione, G. Graziani, V. Gokmen, and V. Fogliano, “Release of antioxidant capacity from five plant foods during a multistep enzymatic digestion protocol,” J. Agric. Food Chem., vol. 62, no. 18, pp. 4119–4126, 2014. [10] A. de Camargo, M. A. B. Regitano-d’Arce, C. Telles Biasoto, and F. Shahidi, “Enzyme-assisted extraction of phenolics from winemaking by-products: Antioxidant potential and inhibition of alpha-glucosidase and lipase activities,” Food Chem., vol. 212, pp. 395–402, 2016. [11] V. Nour, I. Trandafir, and S. Cosmulescu, “HPLC determination of phenolic acids, flavonoids and juglone in walnut leaves,” J. Chromatogr. Sci., vol. 51, no. 9, pp. 883–890, 2013. [12] A. Zhang, L. Wan, C. Wu, Y. Fang, G. Han, H. Li, Z. Zhang, and H. Wang, “Simultaneous determination of 14 phenolic compounds in grape canes by HPLCDAD-UV using wavelength switching detection,” Molecules, vol. 18, no. 11, pp. 14241–14257, 2013. [13] J. Yang, P. D. Bowman, S. M. Kerwin, and S. Stavchansky, “Development and validation of an LCMS method to determine the pharmacokinetic profiles of caffeic acid phenethyl amide and caffeic acid phenethyl ester in male SpragueDawley rats,” Biomed. Chromatogr., vol. 28, no. 2, pp. 241–246, 2014. [14] B. Bayram, B. Ozcelik, G. Schultheiss, J. Frank, and G. Rimbach, “A validated method for the determination of selected phenolics in olive oil using highperformance liquid chromatography with coulometric electrochemical detection and a fused-core column,” Food Chem., vol. 138, no. 2–3, pp. 1663–1669, 2013. [15] E. Porgali and E. Büyüktuncel, “Determination of phenolic composition and antioxidant capacity of native red wines by high performance liquid chromatography and spectrophotometric methods,” Food Res. Int., vol. 45, no. 1, pp. 145–154, 2012.. !26!.
(33) [16] A. M. Tarola, F. Van de Velde, L. Salvagni, and R. Preti, “Determination of Phenolic Compounds in Strawberries (Fragaria ananassa Duch) by High Performance Liquid Chromatography with Diode Array Detection,” Food Anal. Methods, vol. 6, no. 1, pp. 227–237, 2013. [17] P. Bourget, A. Amin, F. Vidal, C. Merlette, and F. Lagarce, “Comparison of Raman spectroscopy vs. high performance liquid chromatography for quality control of complex therapeutic objects: Model of elastomeric portable pumps filled with a fluorouracil solution,” J. Pharm. Biomed. Anal., vol. 91, pp. 176–184, 2014. [18] A. Jenkins, R. Larsen, and T. Williams, “Characterization of amino acids using Raman spectroscopy.,” Spectrochim. Acta. A. Mol. Biomol. Spectrosc., vol. 61, no. 7, pp. 1585–94, May 2005. [19] S.-M. Choi and C.-Y. Ma, “Structural characterization of globulin from common buckwheat (Fagopyrum esculentum Moench) using circular dichroism and Raman spectroscopy,” Food Chem., vol. 102, no. 1, pp. 150–160, Jan. 2007. [20] K. Virkler and I. Lednev, “Raman spectroscopy offers great potential for the nondestructive confirmatory identification of body fluids.,” Forensic Sci. Int., vol. 181, no. 1–3, pp. e1–e5, Oct. 2008. [21] B. Pettinger, “Adsorption of Molecules at Metal Electrodes,” in Adsorption of Molecules at Metal Electrodes, J. Lipowski and P. N. Ross, Eds. 1992, p. 285. [22] D. L. Jeanmaire and R. P. Van Duyne, “Surface raman spectroelectrochemistry,” Journal of Electroanalytical Chemistry and Interfacial Electrochemistry, vol. 84, no. 1. pp. 1–20, 1977. [23] M. G. Albrecht and J. A. Creighton, “Anomalously Intense Raman Spectra of Pyridine at a Silver Electrode,” J. Am. Chem. Soc., vol. 99, pp. 5215–5217, 1977. [24] M. Moskovits, “Surface-enhanced spectroscopy,” Rev. Mod. Phys., vol. 57, no. 3, pp. 783–826, 1985. [25] L. Jensen, C. M. Aikens, and G. C. Schatz, “Electronic structure methods for studying surface-enhanced Raman scattering.,” Chem. Soc. Rev., vol. 37, no. 5, pp. 1061–1073, 2008. [26] J. R. Lombardi and R. L. Birke, “A Unified Approach to Surface-Enhanced Raman Spectroscopy,” J. Phys. Chem. C, vol. 112, no. 14, pp. 5605–5617, 2008. [27] J. R. Lombardi and R. L. Birke, “A unified view of surface-enhanced Raman scattering.,” Acc. Chem. Res., vol. 42, no. 6, pp. 734–742, 2009. [28] C. L. Haynes, C. R. Yonzon, X. Zhang, and R. P. Van Duyne, “Surfaceenhanced Raman sensors: early history and the development of sensors for quantitative biowarfare agent and glucose detection,” J. Raman Spectrosc., vol. 36, no. 6–7, pp. 471–484, Jun. 2005. [29] M. Moskovits, “Persistent misconceptions regarding SERS.,” Phys. Chem. Chem. Phys., vol. 15, no. 15, pp. 5301–11, 2013. [30] A. Kandakkathara, I. Utkin, and R. Fedosejevs, “Surface-enhanced raman scattering (SERS) detection of low concentrations of tryptophan amino acid in silver colloid.,” Appl. Spectrosc., vol. 65, no. 5, pp. 507–13, May 2011. [31] X. Dou, Y. M. Jung, H. Yamamoto, S. Doi, and Y. Ozaki, “Near-Infrared Excited Surface-Enhanced Raman Scattering of Biological Molecules on Gold Colloid I: Effects of pH of the Solutions of Amino Acids and of Their Polymerization,” Appl. Spectrosc., vol. 53, no. 2, pp. 133–138, 1999. [32] F. Wei, D. Zhang, N. J. Halas, and J. D. Hartgerink, “Aromatic amino acids providing characteristic motifs in the Raman and SERS spectroscopy of peptides.,” J. Phys. Chem. B, vol. 112, no. 30, pp. 9158–64, Jul. 2008. [33] E. Podstawka, Y. Ozaki, and L. M. Proniewicz, “Adsorption of S-S containing proteins on a colloidal silver surface studied by surface-enhanced Raman spectroscopy.,” Appl. Spectrosc., vol. 58, no. 10, pp. 1147–56, Oct. 2004. [34] O. Dong and D. C. C. Lam, “Silver nanoparticles as surface-enhanced Raman substrate for quantitative identification of label-free proteins,” Mater. Chem. Phys., vol. 126, no. 1–2, pp. 91–96, Mar. 2011.. !27!.
(34) [35] X. X. Han, H. Y. Jia, Y. F. Wang, Z. C. Lu, C. X. Wang, W. Q. Xu, B. Zhao, and Y. Ozaki, “Analytical technique for label-free multi-protein detection based on Western blot and surface-enhanced Raman scattering.,” Anal. Chem., vol. 80, no. 8, pp. 2799–804, Apr. 2008. [36] J. V. García-Ramos and S. Sánchez-Cortés, “Metal colloids employed in the SERS of biomolecules: activation when exciting in the visible and near-infrared regions,” J. Mol. Struct., vol. 405, no. 1, pp. 13–28, Mar. 1997. [37] Y. He, S. Su, T. Xu, Y. Zhong, J. A. Zapien, J. Li, C. Fan, and S.-T. Lee, “Silicon nanowires-based highly-efficient SERS-active platform for ultrasensitive DNA detection,” Nano Today, vol. 6, no. 2, pp. 122–130, Apr. 2011. [38] T. Smith-Palmer, C. Douglas, and P. Fredericks, “Rationalizing the SER spectra of bacteria,” Vib. Spectrosc., vol. 53, no. 1, pp. 103–106, May 2010. [39] N. E. Marotta and L. A. Bottomley, “Surface-enhanced raman scattering of bacterial cell culture growth media,” Appl. Spectrosc., vol. 64, no. 6, pp. 601–606, 2010. [40] G. V Pavan Kumar, B. a Ashok Reddy, M. Arif, T. K. Kundu, and C. Narayana, “Surface-enhanced Raman scattering studies of human transcriptional coactivator p300.,” J. Phys. Chem. B, vol. 110, no. 33, pp. 16787–92, Aug. 2006. [41] E. Cepeda-Perez, I. Aguilar-Hernandez, T. Lopez-Luke, V. Piazza, R. Carriles, N. Ornelas-Soto, and E. de la Rosa, “Interaction of TGA@CdTe Quantum Dots with an Extracellular Matrix of Haematococcus pluvialis Microalgae Detected Using Surface-Enhanced Raman Spectroscopy (SERS),” Appl. Spectrosc., vol. 70, no. 9, pp. 1571–1572, 2016. [42] R. E. Clavijo, D. J. Ross, and R. F. Aroca, “Surface enhanced raman scattering of trans-p-coumaric and syringic acids,” J. Raman Spectrosc., vol. 40, no. 12, pp. 1984–1988, 2009. [43] S. Sánchez-Cortés and J. V. García-Ramos, “FT surface-enhanced Raman evidence of the oxidative condensation reactions of caffeic acid in solution and on silver surface,” Appl. Spectrosc., vol. 54, no. 2, pp. 230–238, 2000. [44] S. Sánchez-Cortés and J. V. García-Ramos, “Photoinduced coupling and adsorption of caffeic acid on silver surface studied by surface-enhanced Raman spectroscopy,” Spectrochim. Acta - Part A Mol. Biomol. Spectrosc., vol. 55, no. 14, pp. 2935–2941, 1999. [45] S. Sánchez-Cortés and J. García-Ramos, “Adsorption and Chemical Modification of Phenols on a Silver Surface.,” J. Colloid Interface Sci., vol. 231, no. 1, pp. 98–106, 2000. [46] M. Sackmann and a. Materny, “Surface enhanced Raman scattering (SERS)—a quantitative analytical tool?,” J. Raman Spectrosc., vol. 37, no. 1–3, pp. 305–310, 2006. [47] D. Zhang, R. Haputhanthri, S. M. Ansar, K. Vangala, H. I. De Silva, A. Sygula, S. Saebo, and C. U. Pittman, “Ultrasensitive detection of malondialdehyde with surface-enhanced Raman spectroscopy,” Anal. Bioanal. Chem., vol. 398, no. 7–8, pp. 3193–3201, 2010. [48] X. X. Han, G. G. Huang, B. Zhao, and Y. Ozaki, “Label-free highly sensitive detection of proteins in aqueous solutions using surface-enhanced Raman scattering.,” Anal. Chem., vol. 81, no. 9, pp. 3329–33, May 2009. [49] J. Moger, P. Gribbon, a Sewing, and C. P. Winlove, “Feasibility study using surface-enhanced Raman spectroscopy for the quantitative detection of tyrosine and serine phosphorylation.,” Biochim. Biophys. Acta, vol. 1770, no. 6, pp. 912–8, Jun. 2007. [50] J. Gao, H. Gu, F. Liu, X. Dong, M. Xie, and Y. Hu, “Effect of concentration and pH on the surface-enhanced Raman scattering of captopril on nano-colloidal silver surface,” J. Mol. Struct., vol. 998, no. 1–3, pp. 171–178, Jul. 2011.. !28!.
(35) [51] Y. Rao, Q. Chen, J. Dong, and W. Qian, “Growth-sensitive 3D ordered gold nanoshells precursor composite arrays as SERS nanoprobes for assessing hydrogen peroxide scavenging activity.,” Analyst, vol. 136, pp. 769–774, 2011. [52] M. Dendisova-Vyskovska, G. Broncova, M. Clupek, V. Prokopec, and P. Matejka, “In situ SERS spectroelectrochemical analysis of antioxidants deposited on copper substrates: What is the effect of applied potential on sorption behavior?,” Spectrochim. Acta - Part A Mol. Biomol. Spectrosc., vol. 99, pp. 196–204, 2012. [53] J. A. Creighton, C. G. Blatchford, and M. G. Albrecht, “Plasma Resonance Enhancement of Raman Scattering by Pyridine Adsorbed on Silver or Gold Sol Particles of Size,” J. Chem. Soc., Faraday Trans. 2, vol. 75, pp. 790–798, 1979. [54] X. Chen, H. Gu, G. Shen, X. Dong, and J. Kang, “Spectroscopic study of surface enhanced Raman scattering of caffeine on borohydride-reduced silver colloids,” J. Mol. Struct., vol. 975, no. 1–3, pp. 63–68, 2010. [55] W. Meng, F. Hu, X. Jiang, and L. Lu, “Preparation of silver colloids with improved uniformity and stable surface-enhanced Raman scattering,” Nanoscale Res. Lett., vol. 10, no. 1, pp. 1–8, 2015. [56] G. Das, F. Gentile, M. L. Coluccio, A. M. Perri, A. Nicastri, F. Mecarini, G. Cojoc, P. Candeloro, C. Liberale, F. De Angelis, and E. Di Fabrizio, “Principal component analysis based methodology to distinguish protein SERS spectra,” in Journal of Molecular Structure, 2011, vol. 993, no. 1–3, pp. 500–505. [57] S. V. Sokolov, K. Tschulik, C. Batchelor-McAuley, K. Jurkschat, and R. G. Compton, “Reversible or Not? Distinguishing Agglomeration and Aggregation at the Nanoscale,” Anal. Chem., vol. 87, no. 19, pp. 10033–10039, 2015. [58] A. Barbara, F. Dubois, A. Ibanez, L. M. Eng, and P. Quémerais, “SERS correlation spectroscopy of silver aggregates in colloidal suspension: Quantitative sizing down to a single nanoparticle,” J. Phys. Chem. C, vol. 118, no. 31, pp. 17922– 17931, Jul. 2014. [59] S. Agnihotri, S. Mukherji, and S. Mukherji, “Size-controlled silver nanoparticles synthesized over the range 5–100 nm using the same protocol and their antibacterial efficacy,” RSC Adv., vol. 4, no. 8, pp. 3974–3983, 2014. [60] D. D. Evanoff and G. Chumanov, “Synthesis and optical properties of silver nanoparticles and arrays,” ChemPhysChem, vol. 6, no. 7, pp. 1221–1231, 2005. [61] D. Paramelle, A. Sadovoy, S. Gorelik, P. Free, J. Hobley, and D. G. Fernig, “A rapid method to estimate the concentration of citrate capped silver nanoparticles from UV-visible light spectra.,” Analyst, vol. 139, no. 19, pp. 4855–61, 2014. [62] K. B. Mogensen and K. Kneipp, “Size-dependent shifts of plasmon resonance in silver nanoparticle films using controlled dissolution: Monitoring the onset of surface screening effects,” J. Phys. Chem. C, vol. 118, no. 48, pp. 28075–28083, 2014. [63] Y. Xiaojuan, G. Huaimin, and W. Jiwei, “Surface-enhanced Raman spectrum of Gly-Gly adsorbed on the silver colloidal surface,” J. Mol. Struct., vol. 977, no. 1–3, pp. 56–61, Aug. 2010. [64] J. S. Suh and M. Moskovits, “Surface-Enhanced Raman Spectroscopy of Amino Acids and Nucleotide Bases Adsorbed on Silver,” J. Am. Chem. Soc., vol. 108, no. 21, pp. 44711–4718, 1986. [65] A. Sabur, M. Havel, and Y. Gogotsi, “SERS intensity optimization by controlling the size and shape of faceted gold nanoparticles,” J. Raman Spectrosc., vol. 39, pp. 61–67, 2008. [66] Shiohara Amane, Y. Wang, and L. M. Liz-Marzán, “Recent approaches toward creation of hot spots for SERS detection,” J. Photochem. Photobiol. C Photochem. Rev., vol. 21, pp. 2–25, 2014. [67] C. P. Shaw, M. Fan, C. Lane, G. Barry, A. I. Jirasek, and A. G. Brolo, “Statistical Correlation Between SERS Intensity and Nanoparticle Cluster Size,” J. Phys. Chem. C, vol. 117, no. 32, pp. 16596–16605, Aug. 2013.. !29!.
(36) [68] V. R. R. Cunha, V. R. L. Constantino, and R. A. Ando, “Raman spectroscopy and DFT calculations of para-coumaric acid and its deprotonated species,” Vib. Spectrosc., vol. 58, pp. 139–145, 2012. [69] J. L. Castro, M. R. López Ramírez, I. López Tocón, and J. C. Otero, “Vibrational study of the metal-adsorbate interaction of phenylacetic acid and αphenylglycine on silver surfaces,” J. Colloid Interface Sci., vol. 263, no. 2, pp. 357– 363, 2003. [70] X. Dou, Y. M. Jung, Z. Q. Cao, and Y. Ozaki, “Surface-enhanced Raman scattering of biological molecules on metal colloid II: Effects of aggregation of gold colloid and comparison of effects of pH of glycine solutions between gold and silver colloids,” Appl. Spectrosc., vol. 53, no. 11, pp. 1440–1447, 1999. [71] E. C. Le Ru, E. J. Blackie, M. Meyer, and P. G. Etchegoin, “Surface Enhanced Raman Scattering Enhancement Factors: A Comprehensive Study,” J. Phys. Chem. C, vol. 111, no. 37, pp. 13794–13803, 2007. [72] U. K. Sarkar, “A pH-dependent SERS study of thiophene-2-carboxylic acid adsorbed on Ag-sols,” Chem. Phys. Lett., vol. 374, no. 3–4, pp. 341–347, 2003. [73] S. P. Ozkorucuklu, J. Beltrán, G. Fonrodona, D. Barrón, G. Alsancak, and J. Barbosa, “Determination of dissociation constants of some hydroxylated benzoic and cinnamic acids in water from mobility and spectroscopic data obtained by CE-DAD,” J. Chem. Eng. Data, vol. 54, no. 3, pp. 807–811, 2009. [74] I. Pavel, a Szeghalmi, D. Moigno, S. Cîntă, and W. Kiefer, “Theoretical and pH dependent surface enhanced Raman spectroscopy study on caffeine.,” Biopolymers, vol. 72, no. 1, pp. 25–37, 2003. [75] C.-B. Wang, G. Deo, and I. E. Wachs, “Interaction of Polycrystalline Silver with Oxygen, Water, Carbon Dioxide, Ethylene and\rMethanol: In Situ Raman and Catalytic Studies,” J. Phys. Chem. B, vol. 103, no. 27, pp. 5645–5656, 1999. [76] G. I. N. Waterhouse, G. A. Bowmaker, and J. B. Metson, “Oxygen chemisorption on an electrolytic silver catalyst: A combined TPD and Raman spectroscopic study,” Appl. Surf. Sci., vol. 214, no. 1–4, pp. 36–51, 2003. [77] L. Wu, Z. Wang, S. Zong, Z. Huang, P. Zhang, and Y. Cui, “A SERS-based immunoassay with highly increased sensitivity using gold/silver core-shell nanorods,” Biosens. Bioelectron., vol. 38, no. 1, pp. 94–99, 2012.. !30!.
(37) CHAPTER 3 Single molecule detection. Carbon-Based Electrospun Nanofibers Decorated With Gold Nanoparticles as Substrate for SERS. !. 31!.
Figure
+7


Documento similar
Of special concern for this work are outbreaks formed by the benthic dinoflagellate Ostreopsis (Schmidt), including several species producers of palytoxin (PLTX)-like compounds,
The general objective of this thesis is the development, characterization and application of solid contact ion selective electrodes (SC-ISEs) based on a layer of carbon
The analysis of the biological effects of gold nanoparticles generated by biological reduction of HAuCl 4 gold precursor in HeLa cells and the comparison with
In yeast, Mec1 regulates RNR at different levels, from its subcellular localization and activity to its transcription. Although traditionally dNTP synthesis is believed
The main goal of this thesis is to contribute to the knowledge in planetary science through the study of the upper atmosphere of giant planets undergoing hydrody- namic escape. We
However, due to the impossibility of testing the large number of types of nanoparticles that were produced, in DNA interaction assays, cell viability tests and
“ CLIL describes a pedagogic approach in which language and subject area content are learnt in combination, where the language is used as a tool to develop new learning from a
Penelitian ini bertujuan untuk mendapatkan asal daerah bahan baku yang terbaik untuk pembuatan sirup gula kelapa dan untuk mendapatkan konsentrasi arang aktif yang
