Accepted Manuscript
Title: Continuous electrochemical reduction of carbon dioxide into formate using a tin cathode: comparison with lead cathode
Author: Manuel Alvarez-Guerra Andr´es Del Castillo Angel Irabien PII: S0263-8762(13)00449-8 DOI: http://dx.doi.org/doi:10.1016/j.cherd.2013.11.002 Reference: CHERD 1408 To appear in: Received date: 31-7-2013 Revised date: 26-10-2013 Accepted date: 3-11-2013
Please cite this article as: Alvarez-Guerra, M., Del Castillo, A., Irabien, A.,Continuous electrochemical reduction of carbon dioxide into formate using a tin cathode: comparison with lead cathode, Chemical Engineering Research and Design (2013), http://dx.doi.org/10.1016/j.cherd.2013.11.002
This is a PDF file of an unedited manuscript that has been accepted for publication. As a service to our customers we are providing this early version of the manuscript. The manuscript will undergo copyediting, typesetting, and review of the resulting proof before it is published in its final form. Please note that during the production process errors may be discovered which could affect the content, and all legal disclaimers that apply to the journal pertain.
Accepted Manuscript
Continuous electrochemical reduction of carbon dioxide into formate
1
using a tin cathode: comparison with lead cathode
2 3
Manuel Alvarez-Guerra*, Andrés Del Castillo, Angel Irabien
4Departamento de Ingeniería Química y Química Inorgánica. ETSIIT.
5
Universidad de Cantabria. Avda. Los Castros, s/n. 39005, Santander, Spain.
6
* Corresponding author. Tel.: +34 942 20 67 77; fax: +34 942 20 15 91.
7
E-mail: [email protected] (M. Alvarez-Guerra)
8 9 10
Abstract
11
Electrochemical reduction has been pointed out as a promising method for CO2
12
valorisation into useful chemicals. This paper studies the influence of key variables on 13
the performance of an experimental system for continuous electro-reduction of CO2 to
14
formate, when a tin plate is used as working electrode. Particular emphasis is placed on 15
comparing the performance of Sn and Pb as cathodes. As was previously found with Pb, 16
the influence of current density (“j”) using Sn was particularly noteworthy, and when j 17
was raised up to a limit value of 8.5 mA cm-2, important increases of the rate of formate 18
production were observed at the expense of lowering the Faradaic efficiency. However, 19
unlike what was found with Pb, the performance using Sn improved when the 20
electrolyte flow rate/electrode area ratio was increased within the range studied (0.57- 21
2.3 mL min-1 cm-2). In this way, the use of Sn as cathode allowed achieving rates of 22
formate production that were 25% higher than the maximum rates obtained with Pb, 23
together with Faradaic efficiencies close to 70%, which were 15 points higher than 24
Accepted Manuscript
those with Pb. These results reinforce the interest in Sn as electrode material in the 25 electro-reduction of CO2 to formate. 26 27 28Keywords
29Carbon dioxide; valorisation; electrochemical reduction; formate; continuous 30
filter-press cell; Sn cathode 31
Accepted Manuscript
321. Introduction
33
Fossil fuels (i.e. oil, coal and natural gas) represented 81.1% of the total primary energy 34
supply in the world in 2010, while renewable energies only accounted for 13.2% (IEA, 35
2011). Although the final objective for many countries is to phase out fossil fuels in 36
heat and power production as well as in the transport sector (Toftegaard et al., 2010), 37
prospects for the future indicate that the shift to renewable energy sources is slow and 38
that the world energy supply will still depend on fossil fuels in the next decades. 39
The anthropogenic emissions of carbon dioxide (CO2), which is the most significant
40
greenhouse gas, are a major cause of global climate change (Figueroa et al., 2008), and 41
they represent a complex challenge that needs to be tackled. Among the different 42
alternatives that are being considered, the so-called “CO2 valorisation” or “CO2
43
chemical recycling” to convert CO2 into useful and valuable products such as fuels or
44
other derived hydrocarbons (Arakawa et al., 2001; Jiang et al., 2010; Mikkelsen et al., 45
2010; Quadrelli et al., 2011; Yu et al., 2008) appears as an innovative and attractive 46
option, which has been regarded as a feasible and powerful new approach that is 47
entering the stage of gradual practical implementation (Olah et al., 2009, 2011). 48
Particularly, electrochemical valorisation of CO2 is receiving increasing attention over
49
the last years. Several papers can be found in the literature that have reviewed different 50
efforts in the study of CO2 electro-reduction and have discussed mechanistic aspects
51
and reaction pathways (Chaplin and Wragg, 2003; Gattrell et al., 2006; Jitaru et al., 52
1997; Jitaru, 2007; Lee et al., 2009; Spinner et al., 2012; Sánchez-Sánchez et al., 2001; 53
Whipple and Kenis, 2010). 54
Valorisation of CO2 by electrochemical reduction is based on the supply of electrical
55
energy to establish a potential between two electrodes in order to allow CO2 to be
Accepted Manuscript
converted into reduced forms. Different authors have suggested that the electrochemical 57valorisation of CO2 may be an excellent way of storing intermittent and unpredictable
58
renewable energy, which can be used for supplying the electricity required for this 59
process (Agarwal et al., 2011; Chen and Kanan, 2012; Narayanan et al., 2011; Olah et 60
al., 2011; Prakash et al., 2013; Wang et al., 2013; Whipple et al., 2010). A negative 61
public opinion to CO2 storage, which has already been detected recently in the lack of
62
social acceptance of some projects for storing captured CO2, may hamper its
63
implementation (Ashworth et al., 2012; Terwel and Daamen, 2012; Terwel et al., 2012; 64
Upham and Roberts, 2011) and therefore may increase the interest in finding ways of 65
converting captured CO2 into useful products. Particularly, coupled to a renewable
66
energy source such as wind or solar, electrochemical processes for CO2 conversion
67
could generate carbon neutral fuels or industrial chemicals that are conventionally 68
derived from petroleum (Kuhl et al., 2012), and at the same time, could also allow the 69
storage of electrical energy in chemical forms, which has been remarked as a key aspect 70
for levelling the output from intermittent electricity sources such as wind and solar 71
(Whipple and Kenis, 2010). Since electricity is difficult to store on a large scale, its 72
production has to closely follow the demand and to adapt to fluctuations; however, 73
renewable energies such as solar and wind are intermittent and not able to follow 74
closely the demand (i.e. solar energy cannot be produced during the night or with 75
cloudy weather, while wind does not blow constantly), so storage of electricity to 76
balance fluctuations in demand and production cycles is considered to be essential for 77
the use of renewable energies on a large scale (Olah et al., 2011; Prakash et al., 2013). 78
In this way, it has been highlighted that if the electrochemical reduction of CO2 to liquid
79
chemical compounds could be made with high efficiencies, it could become a 80
sustainable approach in the future for the production of liquid fuels, providing a high 81
Accepted Manuscript
energy density means of storing renewable electricity as chemical energy (Gattrell et al., 822006; Kuhl et al., 2012; Narayanan et al., 2011; Olah et al., 2011; Prakash et al., 2013; 83
Whipple et al., 2010). 84
In the electro-reduction of CO2, the type of products, as well as the yield in which they
85
can be obtained, are strongly dependent on different factors, emphasising the nature and 86
form of the material used as cathode, the medium where the reaction occurs or the 87
conditions of pressure and temperature (Hori et al., 1994; Jitaru et al., 1997; Jitaru, 88
2007; Sánchez-Sánchez et al., 2001). Among the number of useful products into which 89
CO2 can be electrochemically reduced, conversion to formic acid/ formate appears to
90
have the best chance for the practical development of technical and economically viable 91
processes (Oloman and Li, 2008). Apart from its different traditional industrial uses, 92
including textile finishing or additive in animal feeds (Kirk-Othmer, 2004), a growing 93
demand for formic acid in pharmaceutical synthesis and in paper and pulp production 94
has been reported (Innocent et al., 2009). Furthermore, formic acid has been pointed out 95
as one of the most promising candidate fuels for fuel cells (Rees and Compton, 2011; 96
Yu and Pickup, 2008) and recently has been proposed as an optimal hydrogen carrier 97
(Grasemann and Laurenczy, 2012; Prakash et al., 2013). However, formate/formic acid 98
is currently mainly produced by the oxidation of hydrocarbons or by thermo-chemical 99
processes based on the carbonylation of methanol or sodium hydroxide (Kirk-Othmer, 100
2004), which have negative environmental impacts (Li and Oloman, 2006) and are 101
relatively expensive production processes (Agarwal et al., 2011). 102
As a consequence, the study of the electrochemical reduction of CO2 to formate has
103
attracted renewed and growing interest over the last years. Some studies have used 104
fixed-bed reactors (Köleli et al., 2003; Köleli and Balun, 2004; Kwon and Lee, 2010) or 105
divided H-type cells (Chen and Kanan, 2012; Kaneco et al., 1998, 1999; Li et al., 2012). 106
Accepted Manuscript
Nevertheless, several works in the literature have been focussed on parallel-plate or 107filter-press flow-by type cells (Agarwal et al., 2011; Akahori et al., 2004; Alvarez-108
Guerra et al., 2012; Innocent et al., 2009; Li and Oloman, 2005, 2006, 2007; Machunda 109
et al., 2010, 2011; Narayanan et al., 2011; Subramanian et al., 2007; Whipple et al., 110
2010), under different working conditions and cathodes of very different nature, such as 111
indium-impregnated lead wire (Akahori et al., 2004), lead-plated stainless steel woven 112
mesh (Subramanian et al., 2007), tinned-copper mesh (Li and Oloman, 2005, 2006), tin 113
particles (shots and granules) (Li and Oloman, 2007), lead plates (Alvarez-Guerra et al., 114
2012; Innocent et al., 2009), or metal catalysts (such as indium (Narayanan et al., 2011), 115
lead (Machunda et al., 2010) or tin (Agarwal et al., 2011; Machunda et al., 2011; 116
Whipple et al., 2010)) electrodeposited on different substrates. Apart from very recent 117
investigations focussed on new gas diffusion electrodes (Li et al., 2012; Prakash et al., 118
2013), the CO2 electrochemical valorisation to formate in continuous mode has been
119
particularly studied in several works (Agarwal et al., 2011; Alvarez-Guerra et al., 2012; 120
Li and Oloman, 2005, 2006, 2007; Subramanian et al., 2007), revealing the growing 121
interest in this type of approach, but at the same time, emphasising that despite its great 122
potential, there is the need for carrying on obtaining experimental evidence to guide the 123
research efforts for developing and improving these processes. 124
Following previous studies of our research group using lead cathode (Alvarez-Guerra et 125
al., 2012), the aim of this work is to analyse the influence of key variables like the 126
current density and the electrolyte flow rate on the performance of an experimental 127
system for continuous electro-reduction of CO2 to formate, when a tin plate is used as
128
working electrode in a filter-press electrochemical reactor. Special emphasis will be 129
placed on comparing the performance of Sn plates with that of Pb plates previously 130
reported (Alvarez-Guerra et al., 2012), and for this reason, the same approach was 131
Accepted Manuscript
followed to carry out the analysis with Sn that will be presented in this paper, i.e. a 22 132factorial design of experiments at different levels of current density and electrolyte flow 133
rate, followed by subsequent more detailed studies of the influence of each of these 134
variables on the performance of the process. These types of studies will allow the 135
description of the system behaviour and can serve as a reference for the assessment of 136 future advances. 137 138 139
2. Methods
140In this work, the experimental laboratory system and operating conditions were the 141
same as in our previous study using lead cathode (Alvarez-Guerra et al., 2012), with the 142
only difference of using a tin plate (99.9% Sn, Amat Metalplast SA) as cathode. Details 143
about the elements of the experimental set-up and about the methodology followed to 144
carry out the experiments can be found in our previous work (Alvarez-Guerra et al., 145
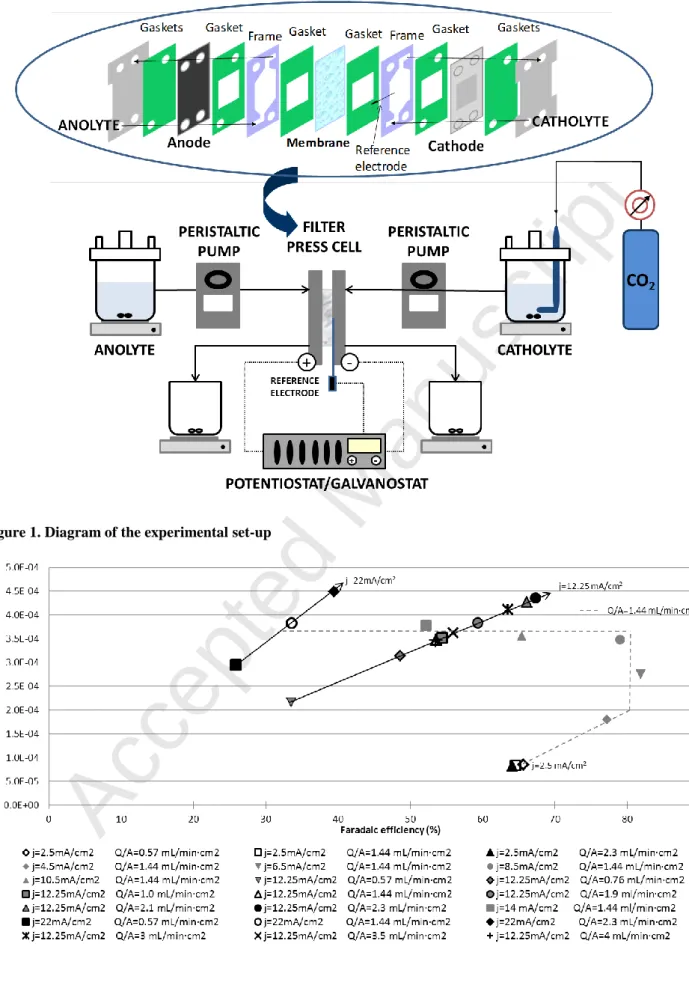
2012). Briefly, the experimental laboratory system, whose core is a filter-press or 146
parallel-plate type electrochemical cell (Micro Flow Cell, ElectroCell A/S), is 147
represented in Figure 1. A Nafion 117 cation-exchange membrane divided the cell in 148
two separated anodic and cathodic compartments. In this study, the working electrode 149
was a tin plate and a Dimensionally Stable Anode DSA/O2 plate (Ir-MMO (Mixed
150
Metal Oxide) on Platinum, Electrocell A/S) was used as the counter-electrode, both 151
electrodes with a surface area of 10 cm2. A leak-free Ag/AgCl 3.4M KCl reference 152
electrode was assembled in a PTFE frame of the cell very close to the surface of the 153
working electrode. Following the same pre-treatment that was used in the study with Pb 154
electrodes (Alvarez-Guerra et al., 2012), the Sn electrode was pre-treated before the 155
start of each experiment with 11% wt HNO3 for 1 min and then rinsed with plenty of
Accepted Manuscript
ultra-pure water in an ultrasound bath for 5 min. An aqueous solution 0.45M KHCO3 +157
0.5M KCl, which was maintained saturated with CO2 using constant bubbling
158
throughout the experiment, was used as catholyte, and 1M KOH was used as anolyte. 159
160
(FIGURE 1 HERE) 161
162
Experiments were carried out in continuous mode with an operating time of 90 min, 163
under room temperature and pressure, and at galvanostatic conditions with a 164
potentiostat/galvanostat AutoLab PGSTAT 302N (Metrohm, Inc.) that was controlled 165
with a computer using the General Purpose Electrochemical System (GPES) software. 166
Samples were taken at different times (15, 30, 60 and 90 min) of operation and the 167
average value of the concentrations of these samples was obtained for each experiment. 168
Each sample was analysed in duplicate by Ion Chromatography (Dionex ICS 1100) 169
provided with a AS9-HC column, using a solution of Na2CO3 (4.5 mM) as eluent, with 170
a flow-rate of 1 mL/min and a pressure of around 2000 psi, to quantify the 171
concentration of formate produced. As explained in our previous work (Alvarez-Guerra 172
et al., 2012), considering the intrinsic variability associated with this type of 173
electrochemical processes, at least two experiments were always performed for each of 174
the points studied. In this way, standard deviations for the replicates of most of the 175
points were below 5% of the average product concentration, with maximum deviations 176
around 10%. 177
The rate of formate production and the Faradaic current efficiency for formate 178
production were used to assess the performance of the process. The rate of formate 179
production was expressed as the quantity of formate obtained per unit of cathode area 180
and unit of time (i.e. mol m-2 s-1). The Faradaic efficiency for a certain product is a
Accepted Manuscript
figure of merit commonly used to assess the performance of an electrochemical process; 182it is defined as the yield based on the electrical charge passed during electrolysis 183
(Pletcher and Walsh, 1990), or in other words, as the percentage of the total charge 184
supplied that is used in forming that certain product. 185
186 187
3. Results and discussion
188 189
3.1. Factorial design of experiments at different current densities and
190
flow/electrode area ratio
191
The effects of current density and electrolyte flow rate on the performance of the 192
experimental laboratory-scale electro-reduction process to convert CO2 into formate
193
using Sn plate cathode were analysed with a 22 factorial design of experiments, 194
following the same approach as that used in the previous study with Pb cathode 195
(Alvarez-Guerra et al., 2012). Therefore, the variables current density (j) and 196
“flow/area” ratio (Q/A, i.e. the feed flow rate used for the catholyte divided by the 197
working electrode area, 10 cm2), were studied in the same ranges: 2.5 – 22 mA cm-2 and 198
0.57 – 2.3 mL min-1 cm-2, respectively. Three levels (low (-), medium (0) and high (+)) 199
within these ranges were defined for each variable: 0.57, 1.44 and 2.3 mL min-1 cm-2 for 200
Q/A, and 2.5, 12.25 and 22 mA cm-2 for j.
201
The results obtained in the different experiments carried out using a Sn plate as working 202
electrode are summarised in Table 1. It is important to emphasise that, in each 203
experiment, no significant changes with time were observed in the concentrations of the 204
samples taken during the 90 min of operation. For each of the points studied, the 205
deviations for these samples were below 10% of the average measured formate 206
Accepted Manuscript
concentration reported. The statistical analysis of these factorial experiments was207
carried out using Minitab® 15 (Minitab Inc.) and MATLAB® 7.10 (MathWorks, Inc.) in 208
a sequential way, as described in our previous work (Alvarez-Guerra et al., 2012): first 209
only the high and low levels of the 2 factors (j and Q/A) were considered (i.e. 22
210
factorial design); then the centre point (0, 0) was included to test for curvature; and 211
finally, the 32 combinations of the 2 factors at the 3 levels were analysed. With the aim
212
of removing the influence of the absolute values in these analyses, both the factors (j 213
and Q/A) and the responses (rate of formate production and Faradaic efficiency) were 214
normalised in the range [-1, 1]. 215
216 217
Accepted Manuscript
Table 1. Results of the factorial design of experiments using Sn cathode: levels of the variables 217(current density and flow/area ratio) and values obtained for the two responses (rate of formate 218
production and Faradaic efficiency). 219 220 Measured formate concentration (mg L-1) Current density, j Flow/are a ratio, Q/A Rate·104 (mol m-2 s-1) Faradaic efficiency (%) normalised rate [-1, +1] (-) normalised Faradaic efficiency [-1, +1] (-) Cathode potential vs. Ag/AgCl (V) Cell potential (absolute value) (V) Point X1a X 2 b r η r η Vcat Vcell 1 54.77 + + 4.73 41.5 1.00 -0.28 -1.95 3.20 49.37 + + 4.26 37.4 0.76 -0.46 -1.80 3.15 2 39.36 - - 0.83 64.1 -0.99 0.69 -1.39 2.07 41.21 - - 0.87 67.2 -0.97 0.82 -1.40 2.08 3 146.10 + - 3.08 27.1 0.16 -0.90 -1.90 3.10 133.33 + - 2.81 24.7 0.02 -1.00 -1.88 3.11 4 9.41 - + 0.81 62.7 -1.00 0.63 -1.45 2.13 9.84 - + 0.85 65.5 -0.98 0.75 -1.45 2.13 5 64.18 0 0 3.42 52.8 0.33 0.21 -1.70 2.64 65.93 0 0 3.52 54.3 0.38 0.27 -1.72 2.66 6 71.70 + 0 3.82 33.5 0.54 -0.62 -1.86 3.10 71.86 + 0 3.83 33.6 0.54 -0.62 -1.88 3.12 7 15.50 - 0 0.83 63.8 -0.99 0.67 -1.40 2.15 15.85 - 0 0.85 65.2 -0.98 0.74 -1.42 2.15 8 47.49 0 + 4.10 63.3 0.68 0.65 -1.73 2.70 53.61 0 + 4.63 71.4 0.95 1.00 -1.86 2.79 9 101.68 0 - 2.15 33.1 -0.32 -0.64 -1.77 2.68 103.96 0 - 2.19 33.9 -0.29 -0.61 -1.88 2.76
a Levels for current density (mA cm-2): 22 (+), 2.5 (-), 12.25 (0)
221
b Levels for flow/area ratio (mL min-1 cm-2): 2.3 (+), 0.57 (-), 1.44 (0)
222 223 224 225
Accepted Manuscript
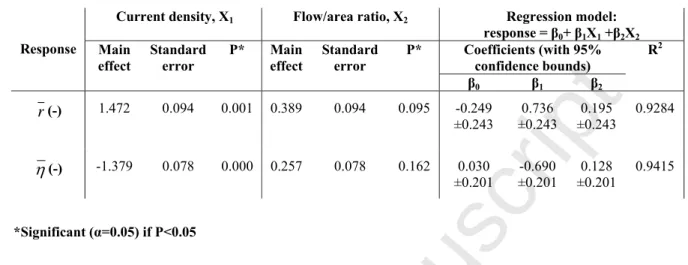
Table 2. Statistical analysis of the 22 factorial experiments with Sn cathode. ris the normalised rate225
of formate production and η is the normalised Faradaic efficiency. 226
227
*Significant (α=0.05) if P<0.05 228
229
Table 2 shows the results of the statistical analyses considering the low and high levels 230
of the factors. As can be seen, current density had strong significant main effects on 231
both rate and Faradaic efficiency, although with different sign. This means that the 232
effect of increasing j from the low (2.5 mA cm-2) to the high level studied (22 mA cm-2)
233
resulted in an increase of 1.47 in the value of rate normalised in the scale [-1, +1], but 234
also made the efficiency to decrease in 1.38 within the coded scale. These main effects 235
were similar, but greater, than the corresponding values obtained with Pb (1.316 for 236
normalised rate and -1.295 for the normalised efficiency) (Alvarez-Guerra et al., 2012). 237
It should also be emphasised that, as happened with Pb, the main effects of Q/A were 238
positive on both factors but of minor magnitude that those of j. The main effect of Q/A 239
on rate (0.389, Table 2) resulted almost identical to the corresponding value obtained in 240
the study with Pb cathode (0.393) (Alvarez-Guerra et al., 2012). However, the effect of 241
Q/A on efficiency that was obtained for Pb (0.476) almost doubled the value for Sn,
242
which reveals the even lower influence of Q/A on η in the 22 factorial experiments with
243
Sn. 244
Another way of expressing the results of a factorial design is in terms of a linear 245
regression model (Montgomery, 1997). The β parameters that multiply the variables X Current density, X1 Flow/area ratio, X2 Regression model:
response = β0+ β1X1 +β2X2 Coefficients (with 95% confidence bounds) Response Main effect Standard error P* Main effect Standard error P* β0 β1 β2 R2 r(-) 1.472 0.094 0.001 0.389 0.094 0.095 -0.249 ±0.243 ±0.243 0.736 ±0.243 0.195 0.9284 η(-) -1.379 0.078 0.000 0.257 0.078 0.162 0.030 ±0.201 ±0.201 -0.690 ±0.201 0.128 0.9415
Accepted Manuscript
and X2 (representing the factors current density and Q/A ratio, respectively) are included247
in Table 2. Looking at the values of these parameters of the regression model, the 248
already mentioned influences can be confirmed. In this way, the great influence of j 249
(positive on rate and negative on Faradaic efficiency) is revealed by the high values of 250
their corresponding regression parameters, while the low β parameters that multiply Q/A 251
indicated the much more limited influence of this variable. 252
Table 3. Statistical analysis of the 22 + centre point (0,0) factorial experiments with Sn cathode. ris
253
the normalised rate of formate production and η is the normalised Faradaic efficiency. 254
Current density, X1 Flow/area ratio, X2 Curvature
Response Main
effect Standard error P* Main effect Standard error P* Center point P*
r(-) 1.472 0.031 0.000 0.389 0.031 0.002 0.606 0.000 η(-) -1.379 0.031 0.000 0.257 0.031 0.009 0.205 0.031 255 *Significant (α=0.05) if P<0.05 256 257
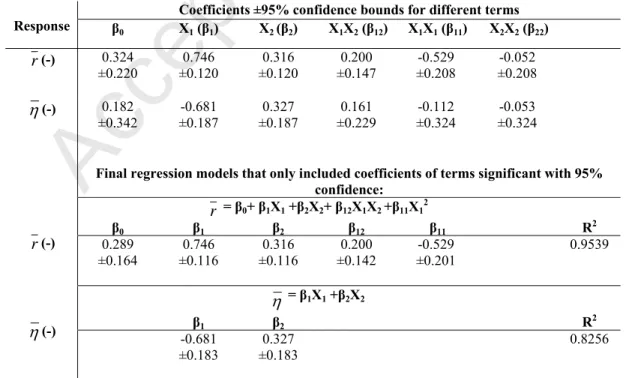
Table 4. Regression models considering all the factorial experiments with Sn cathode, i.e. including 258
the 3 levels of both factors X1 (current density) and X2 (flow/area ratio). ris the normalised rate of
259
formate production and η is the normalised Faradaic efficiency. 260
Coefficients ±95% confidence bounds for different terms
Response β0 X1 (β1) X2 (β2) X1X2 (β12) X1X1 (β11) X2X2 (β22) r(-) 0.324 ±0.220 ±0.120 0.746 ±0.120 0.316 ±0.147 0.200 ±0.208 -0.529 ±0.208 -0.052 η(-) 0.182 ±0.342 -0.681 ±0.187 0.327 ±0.187 0.161 ±0.229 -0.112 ±0.324 -0.053 ±0.324
Final regression models that only included coefficients of terms significant with 95% confidence: r = β0+ β1X1 +β2X2+ β12X1X2+β11X12 β0 β1 β2 β12 β11 R2 r(-) 0.289 ±0.164 ±0.116 0.746 ±0.116 0.316 ±0.142 0.200 ±0.201 -0.529 0.9539 η = β1X1 +β2X2 β1 β2 R2 η(-) -0.681 ±0.183 ±0.183 0.327 0.8256
Accepted Manuscript
261As done in the previous study with Pb, the results of the 22 factorial experiments were 262
then analysed adding the centre point (0,0) in order to test for curvature. Table 3 reports 263
the values of “centre point”, which measure the difference between the average of the 264
centre-point response and the average of the factorial points (Montgomery, 1997). It can 265
be seen that a large and significant value for curvature effect was obtained for rate, 266
which suggests the existence of a non-linear behaviour, as also happened when using Pb 267
as cathode. With Pb, curvature for Faradaic efficiency was very small (0.048) and 268
statistically insignificant (Alvarez-Guerra et al., 2012); as shown in Table 3, in the case 269
of Sn, curvature for η is statistically significant but smaller than for rate, which 270
indicates the more limited influence of curvature in the response function η than in r . 271
Finally, regression models considering the 3 levels of both j and Q/A (i.e. all the 272
factorial experiments, Table 1) were also calculated following the same approach as in 273
the previous work with Pb. The regression models were successively fitted in such a 274
way that those terms whose β parameters were not statistically significant with 95% 275
confidence were eliminated in the following modelling equation, until obtaining models 276
that only contained parameters with 95% confidence bounds that did not include the 277
zero value (Alvarez-Guerra et al., 2012). Table 4 summarises the results that were 278
obtained using Sn cathode. Regarding Faradaic efficiency, the important negative 279
influence of j is represented by the high and negative value of β1 parameter. It should be
280
noted that the regression model considering the results of Faradaic efficiency from all 281
the factorial experiments did not include other terms that were statistically significant 282
apart from those corresponding to linear effects of j and Q/A (β1 and β2, respectively).
283
However, the R2 achieved was low (0.826), which suggests that a better fit of these
284
results would require the inclusion of other types of more complex mathematical 285
Accepted Manuscript
expressions. However, the rate response function was satisfactorily modelled286
(R2=0.954) with the expression obtained, as shown in Table 4. The influence of j in r is 287
made again clear with the high positive influence of β1, corresponding to the linear
288
effect; moreover, the curvature detected can be especially modelled by the high and 289
negative coefficient β11 that represents quadratic effects on rate associated with j.
290 291 292
3.2. Influence of the variables current density and flow/electrode area ratio in Sn
293
cathode
294
In order to subsequently compare the behaviour of Sn and Pb plates as cathodes in our 295
electrochemical system, the same detailed study of the influence of current density and 296
catholyte flow/ electrode area ratio that had been done using Pb, was also done for Sn in 297
this work. In this way, additional experiments were carried out at the intermediate value 298
of the ranges of Q/A and j considered in the factorial study: on the one hand, using a 299
constant flow/ area ratio of Q/A = 1.44 mL min-1 cm-2 and different current densities (j= 300
4.5, 6.5, 8.5, 10.5 and 14 mA cm-2); and on the other hand, using a constant current 301
density of 12.25 mA cm-2 and different flow/ area ratios (Q/A= 0.76, 1.00, 1.90 and 2.10 302
mL min-1 cm-2). 303
The results of rate of formate production and Faradaic efficiency at all the different 304
values of Q/A and j studied are summarised in Figure 2. 305
306
(FIGURE 2 HERE) 307
308
With respect to the influence of current density, it is interesting to note that increasing j 309
from the lowest value 2.5 mA cm-2 to the medium level j= 12.25 mA cm-2 made the rate
Accepted Manuscript
of formate formation to increase between 1.5 and 4 times depending on the level of Q/A 311ratio considered (i.e. rate increased 150% at Q/A= 0.57 mL min-1 cm-2, 315% at 1.44 312
mL min-1 cm-2 and 425% at 2.3 mL min-1 cm-2). Nevertheless, when j was further 313
increased from 12.25 to 22 mA cm-2, Figure 2 shows that such remarkable increases of
314
rate were not observed; especially, for the middle and high Q/A studied, there were no 315
significant difference between the rates obtained at current densities 12.25 and 22 mA 316
cm-2, but only resulted in falls of the % of Faradaic efficiency of 20 and 28 points.
317
Focussing on the influence of j at Q/A = 1.44 mL min-1 cm-2, it can clearly be seen in 318
Figure 2 that the rate of formate production increased, nearly in a proportional way, 319
when j was progressively increased from 2.5 up to 8.5 mA cm-2. However, working at 320
higher current densities did not make it possible to keep this linear growth; for all j 321
studied higher than 8.5 mA cm-2, the rate of formate obtained only varied in the narrow 322
range between 3.47 ·10-4 and 3.83 ·10-4 mol m-2 s-1, which represents maximum 323
differences of approximately just 10%. 324
325
Regarding the influence of the catholyte flow / electrode area ratio, at the lowest level of 326
j studied, no influence of Q/A was observed, since, as can be seen in Figure 2, the 3
327
points at j= 2.5 mA cm-2 were almost overlapped. However, the Q/A ratio did have an 328
influence when working at the intermediate and high levels of j considered. In this way, 329
at a certain j= 12.25 mA cm-2 or j= 22 mA cm-2, increasing Q/A resulted in better 330
performance of the process, both in terms of higher rate and Faradaic efficiency. This 331
tendency can be clearly observed looking at the results of the experiments carried out at 332
constant j= 12.25 mA cm-2 and different Q/A (Figure 2). The increase of efficiency and
333
rate is strongly marked when Q/A was raised from 0.57 to 0.76 mL min-1 cm-2.
334
Although this rhythm of increase was not kept, in general higher formate rates and 335
Accepted Manuscript
efficiencies were obtained when Q/A was increased. The highest values of rate and 336efficiency were achieved at Q/A = 2.3 mL min-1 cm-2, which was the upper value of the 337
range initially considered. Therefore, in order to test the performance beyond this limit, 338
experiments at Q/A ratios higher than 2.3 were also carried out (i.e. at Q/A= 3, 3.5 and 4 339
mL min-1 cm-2). The results have been included in Figure 2. As can be seen, further
340
increase of Q/A did not give better results. It can be concluded that the experiments 341
carried out at Q/A ratios above 2.3 mL min-1 cm-2 involved catholyte flows that resulted
342
to be too high for our electrochemical system, which could cause effects of dragging 343
that are detrimental to the performance of the process and could explain the lower rates 344
of formate production and Faradaic efficiencies observed. 345
346
347
3.3. Comparison of performance with Sn and Pb cathodes
348
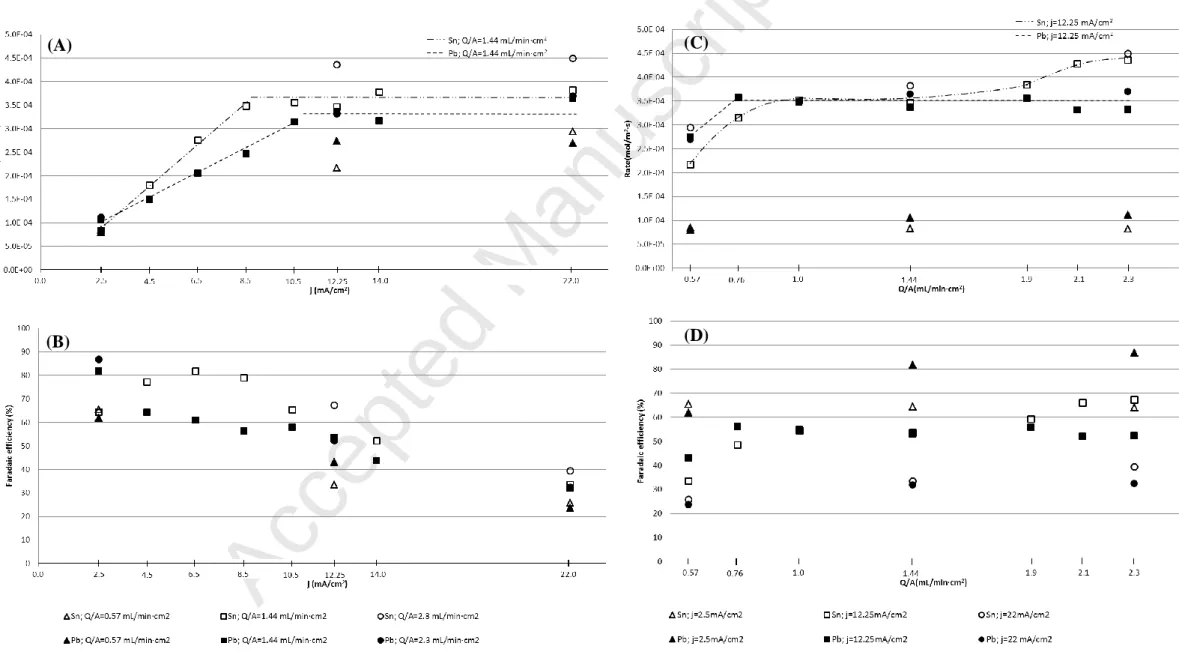
The graphs included in Figure 3 can help to compare the performance with Sn and Pb in 349
terms of rate of formate production and Faradaic efficiency. 350
351
(FIGURE 3 HERE) 352
353
Regarding the influence of current density, both with Sn and Pb plates, increasing j 354
from the low to the medium level caused the rate to increase between 2 and 4 times, 355
although in general, as shown in Figure 3A, further increase of j did not result in higher 356
rates of formation. The comparison of the results obtained with Pb and Sn at Q/A=1.44 357
mL min-1 cm-2 and different j allows detecting interesting differences (Figures 3A and
358
3B). It can be noticed in Figure 3A that when j was increased up to 10.5 mA cm-2 with
359
the Pb cathode, the rate of formation increases linearly. As already mentioned, with Sn 360
Accepted Manuscript
the proportional increase of rate with j is also observed, but in this case up to a current 361density of 8.5 mA cm-2. It is especially noteworthy that at this value j = 8.5 mA cm-2, 362
the rate of formate production achieved with Sn resulted to be 40% higher than the 363
corresponding rate obtained with Pb at this j (Figure 3A). Moreover, as can be seen in 364
Figure 3B, and differently from Pb, when j was gradually increased using Sn between 365
4.5 and this limit value of 8.5 mA cm-2, the observed Faradaic efficiency kept around
366
80%, which was higher than the value of 57% obtained at the limit j using Pb. However, 367
a look together at Figures 3A and 3B confirms that, both with Pb and Sn, continuing 368
increasing the current density (i.e. continuing increasing the supply of charge for the 369
electro-reduction) above the corresponding certain limits (10.5 mA cm-2 with Pb and 8.5 370
mA cm-2 with Sn) did not raise the rate of formate production but only caused the 371
Faradaic efficiency to fall noticeably. The interpretation of these results could be that 372
the excess of electric charge supplied above these limits would not be employed in 373
obtaining more amount of the desired product (formate), but instead, it would be used in 374
other competitive reactions like the formation of H2. Therefore, this explained the
375
decrease in Faradaic efficiencies observed. The observation of maximum current 376
densities above which Faradaic efficiency decreased and rate did not improve, as has 377
also been suggested in studies of photoelectrochemical reduction of CO2, could be
378
attributed to the limited solubility of CO2 in water at standard pressures and its transport
379
limitations (Kumar et al. 2012). 380
381
Figures 3C and 3D are useful to compare the influence of Q/A in the Pb and Sn cathode. 382
At the low level of j studied (2.5 mA cm-2), the influence of the Q/A ratio on the rate of
383
formate production resulted to be very limited, especially using Sn (Figure 3C). At 384
higher current densities, increasing the flow from the low to the medium level gave 385
Accepted Manuscript
higher rates both in Sn and Pb, but further increase of Q/A involved different behaviour 386of the metals. This situation is especially noticeable in the experiments carried out at a 387
same current density (i.e. j= 12.25 mA cm-2) and various Q/A ratios. Working at higher 388
Q/A ratios means that a higher amount of catholyte is made available per unit of time
389
and of electrode area. This should involve improving the supply of mass for the 390
reaction, and therefore, reducing mass transport limitations, which had been identified 391
in the literature as one of the challenges to be overcome in these types of 392
electrochemical processes (Lee et al., 2009; Oloman and Li, 2008; Subramanian et al., 393
2007; Sánchez-Sánchez et al., 2001). However, in the study with Pb plate, it was found 394
that increasing the catholyte flow to overcome mass transport limitations only had 395
beneficial effects for the lowest Q/A ratios (i.e. rate and efficiency only increased when 396
Q/A was raised from 0.57 to 0.76 mL min-1 cm-2), but further increase of Q/A did not
397
result in better performance of the process, which was attributed to the fact that in such 398
conditions the reaction to produce formate could be limited by other aspects, like 399
adsorption equilibria in the lead cathode surface (Alvarez-Guerra et al., 2012). 400
However, the results of the same analysis (working at j= 12.25 mA cm-2 and different 401
Q/A ratios) using Sn plate cathode revealed differences with respect to the results
402
obtained using Pb. As Figures 3C and 3D show, and unlike what was observed with Pb, 403
using Sn cathode the performance generally improved when increasing Q/A ratios 404
within the range studied (0.57- 2.3 mL min-1 cm-2); in fact, the best result was obtained 405
at 2.3 mL min-1 cm-2.Therefore, it can be concluded that while working with Pb cathode 406
at catholyte flow rates higher than a third of the maximum value of the range studied 407
did not improve the performance (Alvarez-Guerra et al., 2012), this limitation was not 408
found working with Sn cathode within the same Q/A range, which allowed achieving 409
Accepted Manuscript
(working at the same j= 12.25 mA cm-2) a formate rate production 25% higher than the 410best obtained using Pb, with a Faradaic efficiency 14 points higher in percentage. 411
412
Finally, it is worth comparing the behaviour of Pb and Sn cathodes in terms of the 413
combination of rate of production and Faradaic efficiency. Working at the lowest 414
current density studied, it can be stated that Pb had better performance than Sn. At j= 415
2.5 mA cm-2, while with Sn the rates of formate production were 0.8 ·10-4 mol m-2 s-1
416
with efficiencies of around 64% (Figure 2), using Pb it was possible to achieve an 417
experimental point that combined a higher rate of 1.1 ·10-4 mol m-2 s-1 and almost 87% 418
of Faradaic efficiency (Alvarez-Guerra et al., 2012). However, at higher current 419
densities, Sn gave better results than Pb in terms of points that combined both high rate 420
and high efficiency. As can be seen in Figure 3, the use of Sn allowed achieving a rate 421
of around 3.5 ·10-4 mol m-2 s-1 with an efficiency of almost 80%. This rate is very 422
similar to the maximum value obtained with Pb, but as can also be noticed in Figure 3, 423
this maximum rate with Pb was achieved with an efficiency of near 60% (Alvarez-424
Guerra et al., 2012), which is 20 points lower than using Sn. Finally, it is also important 425
to emphasise that a great advantage of Sn was that it allowed finding experimental 426
conditions that gave simultaneously a rate of 4.4 ·10-4 mol m-2 s-1 (25% higher than the 427
best rates obtained with Pb) together with a Faradaic efficiency of around 70%. 428
Therefore, it can be concluded that in the electrochemical system for CO2 conversion
429
into formate under study, Sn plates outperformed Pb plates as cathodes in terms of 430
making it possible to work at conditions that combined higher rates of product 431
formation with higher efficiencies than with Pb. 432
433 434
Accepted Manuscript
4. Conclusions
435
This paper presents new experimental results on the influence of key variables like the 436
current density and electrolyte flow rate on the performance of a continuous electro-437
reduction process to convert CO2 into formate in aqueous solutions under ambient
438
conditions, when using a tin plate as cathode in a filter-press type electrochemical cell. 439
Moreover, this study particularly focuses on comparing the performance of Sn plate 440
with previous results obtained in our research group using Pb plate as cathode in the 441
same experimental system (Alvarez-Guerra et al., 2012). 442
The analysis of the factorial design of experiments has allowed the quantification of the 443
influence of j and Q/A. Moreover, the experiments carried out with Sn at the 444
intermediate level of Q/A studied (1.44 mL min-1 cm-2) showed that the rate of formate 445
production increased, almost in a proportional way, when j was increased from 2.5 up to 446
a limit value of 8.5 mA cm-2. Following a similar behaviour as Pb, further increase of j 447
using Sn did not improve the rate and only drastically lowered the efficiency. However, 448
the detailed analyses done in this work also revealed interesting differences in the 449
performance of the process using Pb or Sn plate as working electrode. Particularly, 450
these comparative analyses allowed concluding that the best experimental points in 451
terms of combining high rate and high efficiency obtained with Sn plate cathodes 452
outperformed those with Pb plate, since with Sn the rates of formate production were 453
25% higher and with efficiencies close to 70%, improving the value of around 55% that 454
we previously found with Pb. These results reinforce the interest in Sn as electrode 455
material for the electro-reduction of CO2 to formate and they can be useful as a
456
reference when assessing future efforts in the development of continuous electro-457
reduction processes for CO2 valorisation. In this sense, further research focussed on the
458
application of Sn in gas diffusion electrodes (GDEs) appears as a clear possibility for 459
Accepted Manuscript
potentially overcoming current limitations of these processes. Additional great potential 460for improvement may be related to the nature of the solvent, using, for example, non-461
aqueous media like ionic liquids. However, despite some studies that stress its excellent 462
potential to aid in the electro-reduction of CO2 (Barrosse-Antle and Compton, 2009;
463
Martindale and Compton, 2012), great research efforts are still required to fully explore 464
how the use of ionic liquid as solvents can improve the performance of these processes. 465
466 467
Acknowledgements
468
This work was conducted under the framework of the Spanish Ministry of Science and 469
Innovation Project ENE2010-14828. 470
471 472
References
473Agarwal, A.S., Zhai, Y., Hill, D., Sridhar, N., 2011. The electrochemical reduction of 474
carbon dioxide to formate/formic acid: Engineering and economic feasibility. Chem. 475
Sus. Chem. 4, 1301-1310. 476
Akahori, Y., Iwanaga, N., Kato, Y., Hamamoto, O., Ishii, M., 2004. New 477
electrochemical process for CO2 reduction to from formic acid from combustion flue
478
gases. Electrochemistry 72, 266-270. 479
Alvarez-Guerra, M., Quintanilla, S., Irabien, A., 2012. Conversion of carbon dioxide 480
into formate using a continuous electrochemical reduction process in a lead cathode. 481
Chem. Eng. J. 207-208, 278-284. 482
Arakawa, H., Aresta, M., Armor, J.N., Barteau, M.A., Beckman, E.J., Bell, A.T., 483
Bercaw, J.E., Creutz, C., Dinjus, E., Dixon, D.A., Domen, K., DuBois, D.L., Eckert, J., 484
Fujita, E., Gibson, D.H., Goddard, W.A., Goodman, D.W., Keller, J., Kubas, G.J., 485
Kung, H.H., Lyons, J.E., Manzer, L.E., Marks, T.J., Morokuma, K., Nicholas, K.M., 486
Periana, R., Que, L., Rostrup-Nielson, J., Sachtler, W.M.H., Schmidt, L.D., Sen, A., 487
Somorjai, G.A., Stair, P.C., Ray Stults, B., Tumas, W., 2001. Catalysis research of 488
relevance to carbon management: Progress, challenges, and opportunities. Chem. Rev. 489
101, 953-996. 490
Accepted Manuscript
Ashworth, P., Bradbury, J., Wade, S., Ynke Feenstra, C.F.J., Greenberg, S., Hund, G., 491Mikunda, T., 2012. What's in store: Lessons from implementing CCS. Int. J. Greenh. 492
Gas Control 9, 402-409. 493
Barrosse-Antle, L.E., Compton, R.G., 2009. Reduction of carbon dioxide in 1-butyl-3-494
methylimidazolium acetate. Chem. Commun. 3744-3746. 495
Chaplin, R.P.S., Wragg, A.A., 2003. Effects of process conditions and electrode 496
material on reaction pathways for carbon dioxide electroreduction with particular 497
reference to formate formation. J. Appl. Electrochem. 33, 1107-1123. 498
Chen, Y., Kanan, M.W., 2012. Tin oxide dependence of the CO2 reduction efficiency on
499
tin electrodes and enhanced activity for tin/tin oxide thin-film catalysts. J. Am. Chem. 500
Soc. 134, 1986-1989. 501
Figueroa, J.D., Fout, T., Plasynski, S., McIlvried, H., Srivastava, R.D., 2008. Advances 502
in CO2 capture technology-The U.S. Department of Energy's Carbon Sequestration
503
Program. Int. J. Greenh. Gas Control 2, 9-20. 504
Gattrell, M., Gupta, N., Co, A., 2006. A review of the aqueous electrochemical 505
reduction of CO2 to hydrocarbons at copper. J. Electroanal. Chem. 594, 1-19. 506
Grasemann, M., Laurenczy, G., 2012. Formic acid as a hydrogen source - Recent 507
developments and future trends. Energy Environ. Sci. 5, 8171-8181. 508
Hori, Y., Wakebe, H., Tsukamoto, T., Koga, O., 1994. Electrocatalytic process of CO 509
selectivity in electrochemical reduction of CO2 at metal electrodes in aqueous media.
510
Electrochim. Acta 39, 1833-1839. 511
IEA (International Energy Agency), 2011. Key World Energy Statistics 2011. 512
http://www.iea.org/textbase/nppdf/free/2011/key_world_energy_stats.pdf. 513
Innocent, B., Liaigre, D., Pasquier, D., Ropital, F., Léger, J.-M., Kokoh, K.B., 2009. 514
Electro-reduction of carbon dioxide to formate on lead electrode in aqueous medium. J. 515
Appl. Electrochem. 39, 227-232. 516
Jiang, Z., Xiao, T., Kuznetsov, V.L., Edwards, P.P., 2010. Turning carbon dioxide into 517
fuel. Philos. Trans. Royal Soc. A 368, 3343-3364. 518
Jitaru, M., 2007. Electrochemical carbon dioxide reduction- Fundamental and applied 519
topics (review). J. Univ. Chem. Technol. Metall. 42, 333-344. 520
Jitaru, M., Lowy, D.A., Toma, M., Toma, B.C., Oniciu, L., 1997. Electrochemical 521
reduction of carbon dioxide on flat metallic cathodes. J. Appl. Electrochem. 27, 875-522
889. 523
Kaneco, S., Iwao, R., Iiba, K., Itoh, S.-I., Ohta, K., Mizuno, T., 1999. Electrochemical 524
reduction of carbon dioxide on an indium wire in a KOH/methanol-based electrolyte at 525
ambient temperature and pressure. Environ. Eng. Sci. 16, 131-137. 526
Accepted Manuscript
Kaneco, S., Iwao, R., Iiba, K., Ohta, K., Mizuno, T., 1998. Electrochemical conversion 527of carbon dioxide to formic acid on Pb in KOH methanol electrolyte at ambient 528
temperature and pressure. Energy. 23, 1107-1112. 529
Kirk-Othmer 2004. Kirk-Othmer Encyclopedia of Chemical Technology. John Wiley & 530
Sons, Inc. 531
Köleli, F., Atilan, T., Palamut, N., Gizir, A.M., Aydin, R., Hamann, C.H., 2003. 532
Electrochemical reduction of CO2 at Pb- and Sn-electrodes in a fixed-bed reactor in
533
aqueous K2CO3 and KHCO3 media. J. Appl. Electrochem. 33, 447-450.
534
Köleli, F., Balun, D., 2004. Reduction of CO2 under high pressure and high temperature
535
on Pb-granule electrodes in a fixed-bed reactor in aqueous medium. Appl. Catal. A- 536
Gen. 274, 237-242. 537
Kuhl, K.P., Cave, E.R., Abram, D.N., Jaramillo, T.F., 2012. New insights into the 538
electrochemical reduction of carbon dioxide on metallic copper surfaces. Energy 539
Environ. Sci. 5, 7050-7059. 540
Kumar, B., Llorente, M., Froehlich, J., Dang, T., Sathrum, A., Kubiak, C.P., 2012. 541
Photochemical and Photoelectrochemical Reduction of CO2. Annu. Rev. Phys. Chem.
542
63, 541-569. 543
Kwon, Y., Lee, J., 2010. Formic acid from carbon dioxide on nanolayered 544
electrocatalyst. Electrocatalysis. 1, 108-115. 545
Lee, J., Kwon, Y., Machunda, R.L., Lee, H.J., 2009. Electrocatalytic recycling of CO2
546
and small organic molecules. Chem. - Asian J. 4, 1516-1523. 547
Li, A., Wang, H., Han, J., Liu, L., 2012. Preparation of a Pb loaded gas diffusion 548
electrode and its application to CO2 electroreduction. Front. Chem. Sci. Eng. 6,
381-549
388. 550
Li, H., Oloman, C., 2007. Development of a continuous reactor for the electro-reduction 551
of carbon dioxide to formate - Part 2: Scale-up. J. Appl. Electrochem. 37, 1107-1117. 552
Li, H., Oloman, C., 2006. Development of a continuous reactor for the electro-reduction 553
of carbon dioxide to formate - Part 1: Process variables. J. Appl. Electrochem. 36, 1105-554
1115. 555
Li, H., Oloman, C., 2005. The electro-reduction of carbon dioxide in a continuous 556
Accepted Manuscript
Machunda, R.L., Ju, H., Lee, J., 2011. Electrocatalytic reduction of CO2 gas at Sn based558
gas diffusion electrode. Curr. Appl. Phys. 11, 986-988. 559
Machunda, R.L., Lee, J.-G., Lee, J., 2010. Microstructural surface changes of 560
electrodeposited Pb on gas diffusion electrode during electroreduction of gas-phase 561
CO2. Surf. Interface Anal. 42, 564-567.
562
Martindale, B.C.M., Compton, R.G., 2012. Formic acid electro-synthesis from carbon 563
dioxide in a room temperature ionic liquid. Chem. Commun. 48, 6487-6489. 564
Mikkelsen, M., Jørgensen, M., Krebs, F.C., 2010. The teraton challenge. A review of 565
fixation and transformation of carbon dioxide. Energy Environ. Sci. 3, 43-81. 566
Montgomery, D.C., 1997. Design and Analysis of Experiments, 4th ed. John Wiley & 567
Sons, Inc, New York, US. 568
Narayanan, S.R., Haines, B., Soler, J., Valdez, T.I., 2011. Electrochemical conversion 569
of carbon dioxide to formate in alkaline polymer electrolyte membrane cells. J. 570
Electrochem. Soc. 158, A167-A173. 571
Olah, G.A., Goeppert, A., Prakash, G.K.S., 2009. Chemical recycling of carbon dioxide 572
to methanol and dimethyl ether: From greenhouse gas to renewable, environmentally 573
carbon neutral fuels and synthetic hydrocarbons. J. Org. Chem. 74, 487-498. 574
Olah, G.A., Prakash, G.K.S., Goeppert, A., 2011. Anthropogenic chemical carbon cycle 575
for a sustainable future. J. Am. Chem. Soc. 133, 12881-12898. 576
Oloman, C., Li, H., 2008. Electrochemical processing of carbon dioxide. Chem. Sus. 577
Chem. 1, 385-391. 578
Pletcher, D., Walsh, F.C., 1990. Industrial Electrochemistry, Second Edition. Chapman 579
& Hall, London, UK. 580
Prakash, G.K.S., Viva, F.A., Olah, G.A., 2013. Electrochemical reduction of CO 2 over 581
Sn-Nafion ® coated electrode for a fuel-cell-like device. J. Power Sources 223, 68-73. 582
Quadrelli, E.A., Centi, G., Duplan, J.-L., Perathoner, S., 2011. Carbon dioxide 583
recycling: Emerging large-scale technologies with industrial potential. Chem. Sus. 584
Chem. 4, 1194-1215. 585
Rees, N.V., Compton, R.G., 2011. Sustainable energy: a review of formic acid 586
electrochemical fuel cells. J. Solid State Electrochem. 15, 2095-2100. 587
Sánchez-Sánchez, C.M., Montiel, V., Tryk, D.A., Aldaz, A., Fujishima, A., 2001. 588
Electrochemical approaches to alleviation of the problem of carbon dioxide 589
accumulation. Pure Appl. Chem. 73, 1917-1927. 590
Spinner, N.S., Vega, J.A., Mustain, W.E., 2012. Recent progress in the electrochemical 591
conversion and utilization of CO2. Catal. Sci. Technol. 2, 19-28.
Accepted Manuscript
Subramanian, K., Asokan, K., Jeevarathinam, D., Chandrasekaran, M., 2007.593
Electrochemical membrane reactor for the reduction of carbon dioxide to formate. J. 594
Appl. Electrochem. 37, 255-260. 595
Terwel, B.W., Daamen, D.D.L., 2012. Initial public reactions to carbon capture and 596
storage (CCS): Differentiating general and local views. Climate Policy 12, 288-300. 597
Terwel, B.W., ter Mors, E., Daamen, D.D.L., 2012. It's not only about safety: Beliefs 598
and attitudes of 811 local residents regarding a CCS project in Barendrecht. Int. J. 599
Greenh. Gas Control. 9, 41-51. 600
Toftegaard, M.B., Brix, J., Jensen, P.A., Glarborg, P., Jensen, A.D., 2010. Oxy-fuel 601
combustion of solid fuels. Prog. Energy Combust. Sci. 36, 581-625. 602
Upham, P., Roberts, T., 2011. Public perceptions of CCS: Emergent themes in pan-603
European focus groups and implications for communications. Int. J. Greenh. Gas 604
Control 5, 1359-1367. 605
Wang, H., Leung, D.Y.C., Xuan, J., 2013. Modeling of a microfluidic electrochemical 606
cell for CO2 utilization and fuel production. Appl. Energy 102, 1057-1062.
607
Whipple, D.T., Finke, E.C., Kenis, P.J.A., 2010. Microfluidic reactor for the 608
electrochemical reduction of carbon dioxide: the effect of pH. Electrochem. Solid-State 609
Lett. 13, B109-B111. 610
Whipple, D.T., Kenis, P.J.A., 2010. Prospects of CO2 utilization via direct
611
heterogeneous electrochemical reduction. J. Phys. Chem. Lett. 1, 3451-3458. 612
Yu, K.M., Curcic, I., Gabriel, J., Tsang, S.C., 2008. Recent advances in CO2 capture
613
and utilization. Chem. Sus. Chem. 1, 893-899. 614
Yu, X., Pickup, P.G., 2008. Recent advances in direct formic acid fuel cells (DFAFC). 615
J. Power Sources 182, 124-132. 616
Accepted Manuscript
Graphical Abstract
“Continuous electrochemical reduction of carbon dioxide into formate using a tin
cathode: comparison with lead cathode”
Accepted Manuscript
Highlights
“Continuous electrochemical reduction of carbon dioxide into formate using a tin
cathode: comparison with lead cathode”
The influence of key variables in a Sn cathode filter-press cell was studied
The performance of Sn plate was compared with previous results using Pb
As with Pb, the influence of current density using Sn was especially remarkable
Results with Sn plate cathodes outperformed those with Pb plate
These results reinforce the interest in Sn for CO
2electrovalorisation to formate
Accepted Manuscript
Figure 1. Diagram of the experimental set-upFigure 2. Relationship between the rate of formate production and Faradaic efficiency for formate at different flow/area ratios (Q/A) and current densities (j) using Sn cathode.
Accepted Manuscript
Figure 3. Comparison of the results obtained with Sn plate cathode and Pb plate cathode. (A) and (B): rates of formate production (A) and Faradaic efficiencies (B) vs current density (j). (C) and (D): rates of formate production (C) and Faradaic efficiencies (D) vs flow/area ratio (Q/A).
0.0E+00 5.0E-05 1.0E-04 1.5E-04 2.0E-04 2.5E-04 3.0E-04 3.5E-04 4.0E-04 4.5E-04 5.0E-04 0.5 R at e (m o l/ m 2·s ) Q/A(mL/min·cm2)
Sn; j=2.5mA/cm2 Sn; j=12.25mA/cm2 Sn; j=22mA/cm2
Pb; j=2.5mA/cm2 Pb; j=12.25mA/cm2 Pb; j=22 mA/cm2
0.57 0.76 1.0 1.44 1.9 2.1 2.3 Sn; j=12.25 mA/cm2 Pb; j=12.25 mA/cm2