Sn Nanoparticles on Gas Diffusion Electrodes: Synthesis,
characterization and use for continuous CO
2electroreduction to
formate
Authors
A. Del Castillo1, M. Alvarez-Guerra1, J. Solla-Gullón2, A. Sáez2, V. Montiel2,A. Irabien1
Affiliations
1Universidad de Cantabria, Dep. Chemical and Biomolecular Engineering, ETSIIT Avda.
Los Castros s/n, Santander 39005 Spain.
2Institute of Electrochemistry, University of Alicante Ap. 99, Alicante 03080 Spain
Corresponding author: castilloa@unican.es
Abstract
Electrochemical reduction of CO2 has been pointed out as an interesting strategy to convert CO2 into useful chemicals. In addition, coupling CO2 electroreduction with renewable energies would allow storing electricity from intermittent renewable sources such as wind or solar power. In this work, an easy and fast method is adapted for the synthesis of pure and carbon supported Sn nanoparticles. The resulting nanoparticles have been characterized by transmission electron microscopy and their electrocatalytic properties towards CO2 reduction evaluated by cyclic voltammetry. Carbon supported Sn nanoparticles have been subsequently used to prepare Gas Diffusion Electrodes (Sn/C-GDEs). The electrodes have been characterized by scanning electron microscopy and also by cyclic voltammetry.
Finally, the electrodes were tested on a continuous and single pass CO2 electroreduction filter-press type cell system in aqueous solution, to obtain formateat ambient pressure and temperature. These Sn/C-GDEs allow working at high current densities with low catholyte flow. Thus, for instance, at 150 mA cm-2, a 70 % Faradaic Efficiency (FE) was obtained with a formate concentration of 2.5 g L-1. Interestingly, by increasing the current density to 200 mA cm-2 and decreasing the flow rate, a concentration over 16 g L-1 was reached. Despite the high concentrations obtained, further research is still required to keep high FE operating at high current densities.
Keywords
Carbon dioxide, Tin nanoparticles, Formate, Electroreduction, Gas diffusion electrodes
1. Introduction
CO2 emissions are one of the major contributors to the greenhouse effect and climate change [1]. Among the different alternatives that are being considered to upgrade carbon dioxide, electrochemical reduction appears as an interesting strategy to convert CO2 into valuable chemicals such as fuels or raw material for industries [2]. Particularly attractive is the coupling of this electrochemical transformation with renewable energy, allowing the storage of the excess of electricity from intermittent sources such as wind or solar power in form of chemical products with value-added [3-6]. The storage of electricity is a critical point for the development and wide implementation of renewable energy, since these types of sources have the disadvantage of energy displacement: the energy is often produced in places or at times that do not necessary match with electric demand [7].
There are several pathways to convert CO2 into useful products [8-15]. Among all the products, formic acid or formate is particularly interesting. Previous studies suggest that the electrochemical conversion of CO2 in formic acid is a suitable reaction to be used at
industrial scale despite some drawbacks still need to be solved [16-18]. Formic acid is a raw material for industries such as pharmaceutical synthesis, textile finishing or paper and pulp production, among others [19]. Furthermore, formic acid has been proposed as a suitable fuel for low temperature fuel cells and also as a promising chemical for hydrogen storage [20-23]. The current production process of formic acid is mainly the carbonylation of methanol followed the hydrolysis of methyl formate, with negative environmental impacts. A novel and economic electrochemical process could allow to increase the use of formic acid at industries and on new applications such as fuel cells [24].
Several metals have been used as electrocatalysts for CO2 electrochemical reduction to formic acid/formate, such as Pb [25,26], In [27], Ir [24], Cu [28], Pd [29,30], Co [31] or, specially, Sn [32-42]. These metals are usually deposited in form of particles to maximize the active surface with the minimum amount of metal, and recent studies show that the structure and size of these particles have a great influence on the selectivity and behaviour of the electrochemical reduction [32-34].
Particularly, in recent years, very promising results on CO2 electroredution to formate have been obtained using Gas Diffusion Electrodes (GDEs) with Sn nanoparticles (NPs) [43-54]. This type of electrode presents a high electroactive surface which allows working at higher current densities than that used with plate electrodes. A GDE also enhances the three phase boundary area, avoiding mass transfer limitations and promoting the CO2 electroreduction,
which increases the Faradaic Efficiency (FE), formate rate of production and formate concentration in comparison with plate electrodes [44,46,52].
Most of the studies on CO2 electroreduction to formate using GDEs with Sn have been carried out in batch [46,54] or semibatch mode [47,50] obtaining FE to formate from 70 % to 85% working at current densities between 10 and 40 mA cm-2. Some references report electrodes working at high current densities, above 100 mA cm-2 with FEs over 85% [48,49]. However, details about rates of formate production are not reported. The concentration of product formate achieved is another important aspect that is usually neglected. High current density operation, high product concentration and continuous operation mode are basic requirements for the scale up and industrial implementation of this process [16,49].
In this context, the aim of this work is to develop an easy and fast method for the synthesis of Sn pure and carbon supported NPs with which preparing Sn-GDEs for a continuous process of CO2 electrochemical conversion into formate. The performance of the Sn-GDEs electrodes is finally tested using an experimental electrochemical reactor in continuous mode, which is closer to a practical application of the electrochemical process.
2. Methods
2.1 Synthesis and characterization of Sn NPs
The Sn NPs were prepared at room temperature using a chemical reduction procedure adapted from a previous contribution by Chee and Lee [55]. However, several aspects, including the nature of the solvent, the specific concentration of the chemicals and the order of their addition, among others, were modified in comparison with the original procedure
[55] to facilitate both the synthesis of the nanoparticles and the incorporation of the carbon substrate. In detail, 0.5 g of SnCl2·2H2O (Sigma-Aldrich Co.) and 0.15 g of
polyvinylpyrrolidone (PVP) (molecular weight 55000, Aldrich Chemical Co.) were dissolved in 100 ml of ethyleneglycol (EG) (Sigma-Aldrich Co.). Subsequently, 0.5 g of sodium borohydride (NaBH4) (99.99%, Sigma-Aldrich Co.) were directly added to the solution under continuous magnetic stirring. After the addition of the reducing agent, the solution turns from pale yellow to black thus suggesting an effective chemical reduction. The solution was kept under continuous stirring for at least 30 min and then about 100 ml of acetone were added. The incorporation of acetone gives rise to the destabilization of the colloidal suspension and the NPs precipitate. The so-prepared Sn NPs were filtered, washed with acetone (at least 3 times) and finally dried overnight at 70–80ºC.
Carbon supported Sn NPs were prepared using the same methodology. The required amount of carbon powder (0.614g of Vulcan XC-72R, Cabot Corp corresponding to obtain a Sn metal loading of 30 wt%) was incorporated to the solution before the addition of the reducing agent and continuously mixing, alternating both magnetic and ultrasonic for about 1 h, until getting an uniform suspension. After the reduction step is carried out, the sample was then filtered, washed and dried as previously described.
Transmission Electron Microscopy (TEM) experiments were performed with a JEOL JEM-1400 Plus working at 120 kV. The samples were prepared by dispersing a small fraction of the sample in isopropyl alcohol, IPA (≥99.7 %, Sigma Aldrich), and placing a drop of the IPA solution onto a Formvar-covered copper grid. The solvent is allowed to evaporate in air at room temperature. For each sample, usually about 200 particles from different parts of the grid were used to estimate the mean diameter and size distribution of the NPs.
The samples were also electrochemically characterized in presence and absence of CO2. The electrochemical characterization was performed by cyclic voltammetry in a standard three electrode electrochemical cell. A graphite rod and an AgCl/Ag electrode were used as counter and reference electrodes, respectively. The electrode potential was controlled using a PGSTAT302N AUTOLAB system (Metrohm Autolab, B.V.). The electrolyte was an aqueous solution of 0.45 M KHCO3 + 0.5 M KCl saturated with Ar or with CO2 at room conditions. The catalytic ink was prepared by dispersing the samples in a Nafion solution (Perfluorosulfonic acid-PTFE copolymer, 5% w/w solution, Alfa Aesar) at a Sn/Nafion mass ratio of 70:30. The mixture was then diluted to 3% in isopropyl alcohol, IPA
(P99.7%, Sigma Aldrich). Ultrasonic agitation was used to homogenize the ink for at least 30 min. An aliquot (20 µ L) of the catalytic ink was deposited on a vitreous carbon collector electrode (3 mm diameter, model EM-EDI-CVJ, 0.071 cm2 geometrical area, Radiometer) and dried under an Ar atmosphere. The vitreous carbon electrodes were mechanically polished with alumina, sonicated and rinsed with ultra-pure water before each experiment to make sure that all the NPs from previous experiments were removed. The samples were cycled between -0.2 V and -1.8 V at a scan rate of 50 mVs-1.
2.2 Sn-GDE fabrication and characterization
For the preparation of the Sn-GDEs, the Sn NPs prepared as previously described in section 2.1 were used. In brief, a Toray carbon paper was used as carbonaceous support (Toray Paper, TGPH-90). A carbon microporous layer (MPL), formed by Vulcan XC72R and PTFE in a mass ratio 40/60, was firstly air-brushed onto the carbonaceous support. This layer was sintered at 623 K during 30 min. Subsequently, the catalytic layer (CL) was prepared by air-brushing a catalytic ink similar to that previously mentioned. Using these
conditions, homemade Sn-GDEs electrodes with a geometric surface area of 10 cm2 and a Sn loading of 0.75 mg cm-2 were prepared. Additionally, smaller portions of these Sn-GDEs (about 1 cm2) were cut and electrochemically characterized as above mentioned. To characterize them, these electrodes were held with clamps by the portion of carbon paper excess. The clamps were not in contact with the electrolyte solution. The Sn-GDEs were also characterized with a Scanning electron microscope (SEM, HITACHI S-3000N microscope) working at 20 kV. The electrodes were sectioned and scanning electron micrographs of the cross section were obtained and analyzed. In this way, thickness and morphology of the different layers forming the homemade Sn-GDE can be properly evaluated. For sake of comparison two types of electrodes were prepared: a Sn-GDE with pure Sn NPs (Sn/P-GDE), and Sn-GDE with carbon supported Sn NPs (Sn/C-GDE).
2.3 Filter press tests
The fabricated electrodes were tested on a continuous filter-press cell in such a way that both the catholyte and the anolyte only passed once through the cell. This experimental set up was similar as the set up used in previous works [53]. The catholyte was a 0.45 mol L-1 KHCO3 + 0.5 mol L-1 KCl aqueous solution and the anolyte was a 1 mol L-1 KOH aqueous solution with an anolyte flow per electrode area (Q/A ratio) of 0.57mL min−1 cm−2 . Pure gaseous CO2 was fed to the cell at a flow of 200 mL min-1. The electrochemical cell is divided by a Nafion 117 membrane and the geometrical electrode surface is 10 cm-2. A leak-free Ag/AgCl 3.4 mol L-1 KCl reference electrode was assembled close to the surface of the cathode and a Dimensionally Stable Anode [DSA/O2(Ir-MMO (Mixed Metal Oxide) on Platinum)] was used as the counter-electrode. A scheme of the cell configuration can be seen in Figure 1.
Figure 1. Filter-press cell and electrode configuration
Experiments were carried out at ambient conditions of pressure and temperature during 90 minutes. Samples were taken by duplicate at time 30, 60 and 90 minutes and were analyzed by ion chromatography to quantify the formate concentration (Dionex ICS 1100 equipped with an AS9-HC column, using a solution of Na2CO3 (4.5 mmol L-1) as the eluent at a flow-rate of 1 mL min-1 and a pressure of approximately 13.79 MPa). An average
concentration of formate was obtained for each experiment to calculate the FE and the rate of formate formation. The FE is defined as the percentage of the total charge supplied that is used to produce formate and can also be seen as the yield based on the electrical charge passed during the electroreduction [56,57]. The rate of formate production was expressed as the quantity of formate produced per unit of cathode area and unit of time.
3 Results
3.1 Sn NPs characterization
Figure 2 shows some representative TEM images of the pure (Figure 2A) and carbon supported (Figure 2B) Sn NPs obtained. The TEM images of the pure Sn NPs show the presence of quasi-spherical NPs with a mean particle size of about 10-15 nm. In addition, the sample presents an important level of agglomeration although individual NPs can be clearly seen. However, as expected, the dispersion of the NPs is significantly improved when they are supported on carbon. Thus, Figure 2B shows the presence of well-dispersed carbon supported Sn NPs with a particle size similar to that found with the unsupported ones (about 10-15 nm).
Figure 2. TEM images. A) Sn pure particles. B), B1) Sn carbon supported particles.
Both samples were electrochemically characterized as previously described in the
NPs in Figure 3B and carbon supported Sn NPs in Figure 3C) both in Ar (black line) and CO2 (red line) saturated conditions. For sake of comparison, the response of a Sn rod (99.85% Alfa Aesar) is also included (Figure 3A). The voltammetric response of the different samples is qualitatively similar to that reported in previous contributions [53]. In brief, the CVs show, between -1.0 and -0.2 V, anodic and cathodic contributions related to the oxidation of Sn to SnOX and its subsequent reduction in basic media [58]. As previously indicated, the shift of the oxidation-reduction contribution between the Ar and CO2
saturated solutions is due to a pH effect [33]. Finally, from -1.2 V, an evident reduction process is observed which can be mainly attributed to the reduction of water (H2 evolution) and/or CO2 in Ar and CO2 saturated solutions, respectively. Interestingly, in comparison with the Sn rod (figure 3A) and with larger and commercially available Sn NPs [53], the ratio between the signals due to the CO2/H2O reduction and that associated with the surface oxidation/reduction is significantly higher with the present Sn NPs. This fact may indicate that by decreasing the particle size, the CO2/H2O reduction process is enhanced towards the surface oxidation reduction one.
-0.9 -0.6 -0.3 -0.05 0.00 0.05 -0.9 -0.6 -0.3 -0.1 0.0 0.1 -2.0 -1.6 -1.2 -0.8 -0.4 0.0 -2.0 -1.5 -1.0 -0.5 0.0 E / V vs AgCl/Ag
A
E / V vs AgCl/Ag -2.0 -1.5 -1.0 -0.5 0.0B
-10 -5 0 5 -2.0 -1.6 -1.2 -0.8 -0.4 0.0 I / m A I / m A I / µ AC
I / m A E / V vs AgCl/Ag I / m A E / V vs AgCl/AgFigure 3. Voltammetric profiles of A) Sn rod, B) Sn pure particles, C) Sn carbon supported particles in 0.45 mol L-1 KHCO
3 + 0.5 mol L-1 KCl solution Ar saturated
(black line) and CO2 saturated (red line).
3.2 Sn-GDE characterization
As described in the experimental section, small portions (about 1 cm2) of the Sn-GDEs were again electrochemically characterized by cyclic voltammetry. It is worth noting that in these experiments the electrodes were fully immersed into the electrolyte, that is, the back side of the Toray paper will also contribute to the electrochemical response. In any case, the
voltammetric profile of both electrodes is qualitatively similar to that obtained in Figure 3. These results clearly suggest that the main electrocatalytic properties of the Sn NPs remain unaltered during the preparation of the GDEs.
-2.0 -1.6 -1.2 -0.8 -0.4 0.0 -0.04 -0.03 -0.02 -0.01 0.00 0.01 E / V vs AgCl/Ag
A
E / V vs AgCl/Ag -0.03 -0.02 -0.01 0.00 0.01 -2.0 -1.6 -1.2 -0.8 -0.4 0.0 i / m AB
i / m AFigure 4. Sn-GDE voltammetric profiles of A) GDE with Sn pure particles (Sn/P-GDE), B) GDE with Sn carbon supported particles (Sn/C-(Sn/P-GDE), in 0.45 mol L-1
KHCO3 + 0.5 mol L-1 KCl solution Ar saturated (black line) and CO2 saturated (red
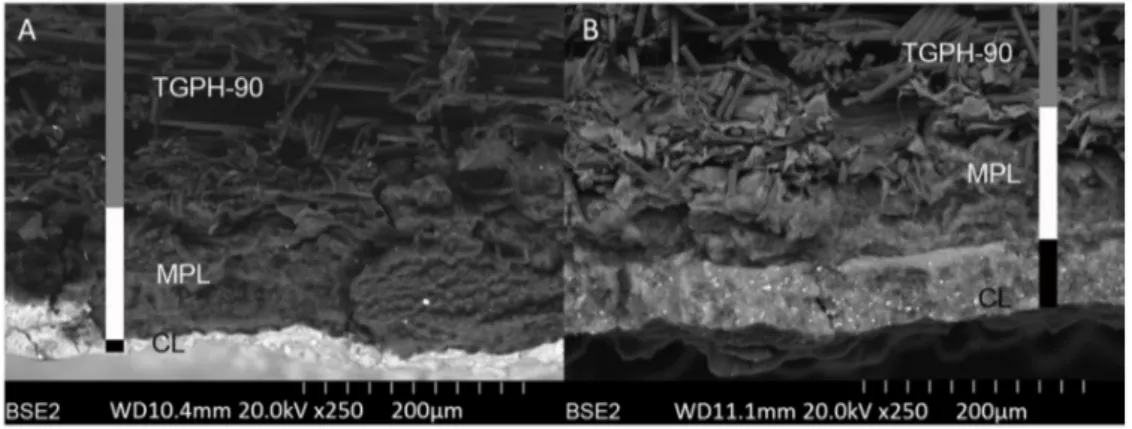
These electrodes were also sectioned and scanning electron micrographs of their cross section were obtained. Some representative SEM images obtained using backscattered electrons are included in Figure 5. The backscattered electron signal depends strongly on the atomic number of the sample (higher atomic number brighter signal) so these images allow the thickness of the microporous (MPL) and the catalytic layers (CL) present at the GDEs to be analyzed. In both electrodes, the thickness of the MPL is similar (about 100 µm). However, as expected, the thickness of catalytic layer (distinguished at the bottom of the images) formed with pure Sn nanoparticles (Figure 5A) is much thinner than that obtained with the carbon supported Sn nanoparticles (about 10 and 50-60µm, respectively) at the same Sn loading (0.75 mg cm-2). Obviously, this higher thickness is also associated with a higher porosity at the catalytic layer with the same catalytic loading. It is worth mentioning that, in a GDE configuration, carbon dioxide has to cross through the electrode. In this sense, and as previously discussed with commercial Sn NPs [53], the formation of a massive and compact Sn layer is not convenient. Consequently, in the next section, only those GDE prepared from carbon supported Sn NPs (Sn/C-GDEs) were used.
3.3 Filter press experiments
Table 1 summarizes the main results obtained during the filter press experiments performed with the Sn/C-GDEs prepared.
Table 1. Results of Sn/C-GDE in continuous electrochemical filter press cell.Electrode metal loading: 0.75 mg Sn (10-15 nm) cm-2 of carbon supported particles.
Point Current density, j (mA/cm2) Electrolyte flow/area, Q/A (ml/min·cm2) Average Faradaic Efficiency FE (%) Formate Average Rate r (mmol/m2·s) Standard Deviation % Cathode Potential (V) Absolute Cell Potential (V) 1 90 0.15 60.2 2.81 3.99 -1.2 3.0 2 90 0.57 69.4 3.23 2.39 -1.3 3.1 3 150 0.57 70.2 5.45 5.14 -1.5 3.7 4 200 0.57 54.1 5.61 3.27 -1.4 4.0 5 200 0.15 55.6 5.77 5.82 -1.5 4.1 6 200 0.07 42.3 4.38 7.69 -1.8 4.3
In comparison with the results previously obtained with electrodes prepared with commercial 150 nm Sn NPs [53], in which the optimal operating conditions were j = 90 mA cm-2 and Q/A = 0.57 mL min-1 cm-2, at similar conditions, these new Sn/C-GDEs provide comparable results, that is, FE about 70% and a formate rate of about 3.2 mmol m-2 s-1 (point 2, Table 1). However, for current densities higher than 150 mA cm-2 (point 3, Table 1) for which the FE decreased to 53% with the electrodes with 150 nm Sn particles [53], the FE remained remarkably stable at about 70% with a rate of 5.45 mmol m-2 s-1 with the present electrodes. This finding represents an important step forward in the process. In fact, by increasing j up to 200 mA cm-2, a production formate rate of 5.6 mmol m-2 s-1 (point 4, Table 1) is even possible to be obtained although at expenses of a decrease in the FE. The higher surface area and appropriate dispersion of the Sn NPs on the Sn/C-GDE
could allow a better diffusion of reactants and products, thus enhancing the mass transport and maintaining the same efficiency at 150 mA cm-2. Therefore, the results obtained using the Sn/C-GDEs prepared in this study reveal that it is possible to work at current densities of 150 mA cm-2,and therefore to achieve a higher rate of formate production, keeping FE around 70%.
As mentioned previously, the product concentration is an important issue for a possible industrial implementation of this process. Together with the need of achieving high efficiencies, it has been highlighted that the energy requirements to increase the
concentration of formate obtained up to levels of commercial interest will play a key role in the practical feasibility of this type of process [3]. Therefore, further tests were carried out with the aim of obtaining product formate as concentrated as possible (Table 1 and Figure 6).
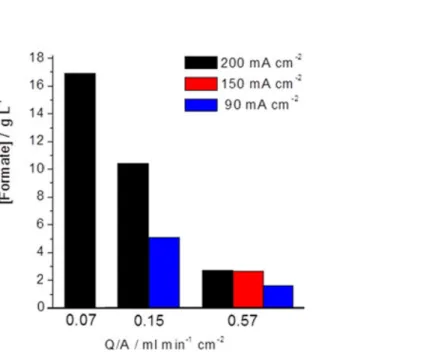
Figure 6. Formate concentration as a function of the applied current density and Q/A ratio.
Taking as reference the conditions: j = 90 mA cm-2 and Q/A = 0.57 mL min-1 cm-2 (point 2, Table 1), the effect of decreasing the electrolyte flow/area ratio to a quarter (i.e. from 0.57 to 0.15 mL min-1 cm-2) was firstly assessed (point 1, Table 1). As shown in Figure 6, the concentration of formate achieved increased from 1.5 g L-1 to more than 5 g L-1, although at the expense of a fall in FE from 69% to 60% (Table 1).
A similar analysis with lower Q/A ratios (points 5 and 6, Table 1) was subsequently performed at j = 200 mA cm-2. The results shown in Figure 6 clearlyindicate that lowering Q/A a remarkable increase of the concentration of formate is obtained. When the Q/A ratio was lowered from 0.57 mL min-1 cm-2 to a quarter of this value (i.e. 0.15 mL min-1 cm-2), the formate concentration achieved increased approximately 4 times, from 2.6 g L-1 to 10.4 g L-1, keeping similar FE around 55%. With an additional reduction of catholyte flow / area ratio to 0.07 mL min-1 cm-2 (point 6, Table 1) a formate concentration as high as 16.9 g L-1 can be achieved (Figure 6), but with a FE of 42%, which can be attributed to mass transport limitations in supply of reactants or removal of product formate due to the very low flows of electrolyte corresponding to Q/A = 0.07 mL min-1 cm-2 in the system.
It should be finally remarked that these results have been obtained operating in a
continuous mode with only one pass of the electrolyte through the electrochemical cell. The concentration of 2.5 g L-1 achieved with a 70% FE at 150 mA cm-2 is also noteworthy, which confirms that the Sn/C-GDEs developed allow working at high current density with relatively high efficiencies. Another interesting point is the high concentration obtained for a current density of 200 mA cm-2 and 0.07 mL min-1 cm-2. In these conditions, it is possible to obtain formate with a concentration near to 17 g L-1, approximately 0.35 M, but at the expense of decreasing the FE. According to recent references [22], this concentration is not
far from those required for direct formate fuel cells (DFFC), since above 0.5 M it may be possible to use formate as a fuel for DFFC. This fact could help to stimulate the
development of both technologies and their future implementation at commercial scale.
4. Conclusions
This study presents the results of a continuous process for the electrochemical reduction of CO2 to formate using Sn/C-GDEs. A simple method for synthetizing Sn NPs was adapted from the literature and modified for producing Sn NPs of about 10-15 nm. The Sn/C-GDEs, fabricated with carbon supported Sn NPs, were able to work at high current densities, obtaining high formate concentrations. At the expense of lowering FE, it was possible to obtain relevant formate concentrations up to 16 g L-1. At a current density of 150 mA cm-2 it is possible to achieve a formate concentration of 2.5 g L-1 with a FE of 70%. It is worth mentioning that these results were obtained on a continuous mode, and with only one pass of the catholyte through the cell, which is desirable for the practical implementation of this type of approach. Moreover, these results represent a step forward into the still relatively scarce studies dealing with the electroreduction of CO2 to formate in continuous mode. The use of high current density and the achievement of high
concentrations remark the feasibility of developing a CO2 electroreduction process with these type of electrodes and NPs.
Acknowledgements
This work was conducted under the framework of the Spanish Ministry of Economy and Competitiveness CTQ2013-48280-C3-1-R and CTQ2013-48280-C3-3-R. Andrés Del
Castillo also acknowledges the research grant from University of Cantabria, co-financed by the Regional Government of Cantabria.
References
[1] Intergovernmental Panel on Climate Change (IPCC), Climate Change 2014: Mitigation of Climate Change. Contribution of Working Group III to the Fifth Assessment Report of the Intergovernmental Panel on Climate Change. Cambridge University Press, Cambridge, United Kingdom and New York (2014) NY, USA.
[2] J. Albo, A. Irabien, Cu2O-loaded gas diffusion electrodes for the continuous electrochemical reduction of CO2 to methanol, J. Catal. 343 (2016) 232-239.
[3] A. Dominguez-Ramos, B. Singh, X. Zhang, E.G. Hertwich, A. Irabien, Global warming footprint of the electrochemical reduction of carbon dioxide to formate, J. Clean. Prod. 104 (2015) 148-155.
[4] K.P. Kuhl, E.R. Cave, D.N. Abram, T.F. Jaramillo, New insights into the
electrochemical reduction of carbon dioxide on metallic copper surfaces, Energy Enviro. Sci. 5 (2012) 7050-7059.
[5] L.M. Aeshala, R.G. Uppaluri, A. Verma, Effect of cationic and anionic solid polymer electrolyte on direct electrochemical reduction of gaseous CO2 to fuel, J. CO2 Util 3-4 (2013) 49-55.
[6] J. Albo, A. Sáez, J. Solla-Gullón, V. Montiel, A. Irabien, Production of methanol from CO2 electroreduction at Cu2O and Cu2O/ZnO-based electrodes in aqueous solution, Appl. Catal. B 176–177 (2015) 709-717.
[7] J.D. Watkins, A.B. Bocarsly, Direct reduction of carbon dioxide to formate in high-gas-capacity ionic liquids at post-transition-metal electrodes, ChemSusChem 7 (2014) 284-290.
[8] J. Qiao, Y. Liu, F. Hong, J. Zhang, A review of catalysts for the electroreduction of carbon dioxide to produce low-carbon fuels, Chem. Soc. Rev. 43 (2014) 631-675.
[9] M. Alvarez-Guerra, J. Albo, E. Alvarez-Guerra, A. Irabien, Ionic liquids in the electrochemical valorisation of CO2, Energy Environ. Sci. 8 (2015) 2574-2599.
[10] J. Albo, M. Alvarez-Guerra, P. Castaño, A. Irabien, Towards the electrochemical conversion of carbon dioxide into methanol, Green Chem. 17 (2015) 2304-2324.
[11] A.J. Martín, G.O. Larrazábal, J. Pérez-Ramírez, Towards sustainable fuels and chemicals through the electrochemical reduction of CO2: Lessons from water electrolysis, Green Chem. 17 (2015) 5114-5130.
[12] J.P. Jones, G.K.S. Prakash, G.A. Olah, Electrochemical CO2 Reduction: Recent Advances and Current Trends, Isr. J. Chem. 54 (2014) 1451-1466.
[13] I. Merino-Garcia, E. Alvarez-Guerra, J. Albo, A. Irabien, Electrochemical membrane reactors for the utilisation of carbon dioxide, Chem. Eng. J. 305 (2016) 104-120.
[14] Q. Lu, F. Jiao, Electrochemical CO2 reduction: Electrocatalyst, reaction mechanism, and process engineering, Nano Energy 29 (2016) 439-456.
[15] J. Qiao, Y. Liu, J. Zhang (Eds). Electrochemical Reduction of Carbon Dioxide: Fundamentals and Technologies. CRC Press, Boca Raton, FL, (2016).
[16] C. Oloman, H. Li, Electrochemical processing of carbon dioxide, ChemSusChem 1 (2008) 385-391.
[17] H. Li, C. Oloman, Development of a continuous reactor for the electro-reduction of carbon dioxide to formate - Part 1: Process variables, J. Appl. Electrochem. 36 (2006) 1105-1115.
[18] A.S. Agarwal, Y. Zhai, D. Hill, N. Sridhar, The electrochemical reduction of carbon dioxide to formate/formic acid: Engineering and economic feasibility, ChemSusChem 4 (2011) 1301-1310.
[19] Kirk-Othmer Encyclopedia of Chemical Technology. New York (2004) Wiley.
[20] A.K. Mishra, N.H. de Leeuw, Mechanistic insights into the Cu(I) oxide-catalyzed conversion of CO2 to fuels and chemicals: A DFT approach J. CO2 Util. 15 (2016) 96-106.
[21] N.V. Rees, R.G. Compton, Sustainable energy: A review of formic acid electrochemical fuel cells, J. Solid State Electrochem. 14 (2011) 2095-2100.
[22] L. An, R. Chen, Direct formate fuel cells: A review, J. Power Sources 320 (2016) 127-139.
[23] M. Grasemann, G. Laurenczy, Formic acid as a hydrogen source - Recent developments and future trends, Energy Enviro. Sci. 5 (2012) 8171-8181.
[24] P. Kang, S. Zhang, T.J. Meyer, M. Brookhart, Rapid selective electrocatalytic
reduction of carbon dioxide to formate by an iridium pincer catalyst immobilized on carbon nanotube electrodes, Angew. Chem. Int. Edit. 53 (2014) 8709-8713.
[25] C.H. Lee, M.W. Kanan, Controlling H+ vs CO
2 Reduction Selectivity on Pb Electrodes, ACS Catal. 5 (2015) 465-469.
[26] V.S.K. Yadav, M.K. Purkait, Synthesis of Pb2O electrocatalyst and its application in the electrochemical reduction of CO2 to HCOOH in various electrolytes, RSC Adv. 5 (2015) 40414-40421.
[27] Z. Bitar, A. Fecant, E. Trela-Baudot, S. Chardon-Noblat, D. Pasquier, Electrocatalytic reduction of carbon dioxide on indium coated gas diffusion electrodes-Comparison with indium foil, Appl. Catal. B 189 (2016) 172–180.
[28] Y. Lan, C. Gai, P.J.A. Kenis, J. Lu, Electrochemical Reduction of Carbon Dioxide on Cu/CuO Core/Shell Catalysts, ChemElectroChem. 1 (2014) 1577-1582.
[29] R. Kortlever, C. Balemans, Y. Kwon, M.T.M. Koper, Electrochemical CO2 reduction to formic acid on a Pd-based formic acid oxidation catalyst, Catal. Today 244 (2015) 58-62.
[30] X. Min, M.W. Kanan, Pd-Catalyzed Electrohydrogenation of Carbon Dioxide to Formate: High Mass Activity at Low Overpotential and Identification of the Deactivation Pathway, J. Am. Chem. Soc. 137 (2015) 4701-4708.
[31] Gao, S., Lin, Y., Jiao, X., Sun, Y., Luo, Q., Zhang, W., Li, D., Yang, J., Xie, Y. Partially oxidized atomic cobalt layers for carbon dioxide electroreduction to liquid fuel Nature 529 (2016) 68-71.
[32] A. Dutta, A. Kuzume, M. Rahaman, S. Vesztergom, P. Broekmann, Monitoring the Chemical State of Catalysts for CO2 Electroreduction: An In Operando Study, ACS Catal. 5 (2015) 7498-7502.
[33] W. Lv, J. Zhou, F. Kong, H. Fang, W. Wang, Porous tin-based film deposited on copper foil for electrochemical reduction of carbon dioxide to formate, Int J Hydrogen Energy. 41 (2016) 1585-1591.
[34] D.H. Won, C.H. Choi, J. Chung, M.W. Chung, E. Kim, S.I. Woo, Rational Design of a Hierarchical Tin Dendrite Electrode for Efficient Electrochemical Reduction of CO2, ChemSusChem. 8 (2015) 3092-3098.
[35] M. Alvarez-Guerra, A. Del Castillo, A. Irabien, Continuous electrochemical reduction of carbon dioxide into formate using a tin cathode: comparison with lead cathode, Chem. Eng. Res. Des. 92 (2013) 692-701.
[36] S. Lee, J.D. Ocon, Y. Son, J. Lee, Alkaline CO2 electrolysis toward selective and continuous HCOO- production over SnO
2 nanocatalysts, J. Phys. Chem. C 119 (2015) 4884-4890.
[37] Anawati, G.S. Frankel, A. Agarwal, N. Sridhar, Degradation and deactivation of Sn catalyst used for CO2 reduction as function of overpotential, Electrochim. Acta 133 (2014) 188-196.
[38] S. Zhang, P. Kang, T.J. Meyer, Nanostructured tin catalysts for selective
electrochemical reduction of carbon dioxide to formate, J. Am. Chem. Soc. 136 (2014) 1734-1737.
[39] P. Bumroongsakulsawat, G.H. Kelsall, Effect of solution pH on CO: formate formation rates during electrochemical reduction of aqueous CO2 at Sn cathodes, Electrochim. Acta 141(2014) 216-225.
[40] V.S.K. Yadav, M.K. Purkait, Electrochemical reduction of CO2 to HCOOH on a synthesized Sn electrocatalyst using a Co3O4 anode, RSC Adv. 5 (2015) 68551-68557.
[41] O. Scialdone, A. Galia, G.L. Nero, F. Proietto, S. Sabatino, B. Schiavo,
Electrochemical reduction of carbon dioxide to formic acid at a tin cathode in divided and undivided cells: effect of carbon dioxide pressure and other operating parameters,
Electrochim. Acta 199 (2016) 332-341.
[42] C. Zhao, J. Wang, Electrochemical reduction of CO2 to formate in aqueous solution using electro-deposited Sn catalysts, Chem. Eng. J. 293 (2016) 161-170.
[43] Y. Fu, Y. Li, X. Zhang, Y. Liu, J. Qiao, J. Zhang, D.P. Wilkinson, Novel hierarchical SnO2 microsphere catalyst coated on gas diffusion electrode for enhancing energy
efficiency of CO2 reduction to formate fuel, Appl. Energy 175 (2016) 536-544.
[44] A. Del Castillo, M. Alvarez-Guerra, A. Irabien, Continuous electroreduction of CO2 to formate using sn gas diffusion electrodes, AIChE J. 60 (2014) 3557-3564.
[45] Q. Wang, H. Dong, H. Yu, Fabrication of a Novel Tin Gas Diffusion Electrode for Electrochemical Reduction of Carbon Dioxide to Formic Acid, RSC Adv. 4 (2014) 59970-59976.
[46] Q. Wang, H. Dong, H. Yu, Development of rolling tin gas diffusion electrode for carbon dioxide electrochemical reduction to produce formate in aqueous electrolyte, J. Power Sources 271 (2014) 278-284.
[47] J. Wu, F.G. Risalvato, P.P. Sharma, P.J. Pellechia, F.S. Ke, X.D. Zhou,
Electrochemical reduction of carbon dioxide: II. Design, assembly, and performance of low temperature full electrochemical cells, J. Electrochem. Soc. 160 (2013) F953-F957.
[48] S. Guan, A. Agarwal, E. Rode, D. Hill, N. Sridhar, 3-D tin-carbon fiber paper
electrodes for electrochemically converting CO2 to formate/formic acid, Ceram.Trans. 241 (2013) 231-243.
[49] D. Kopljar, A. Inan, P. Vindayer, N. Wagner, E. Klemm, Electrochemical reduction of CO2 to formate at high current density using gas diffusion electrodes, J. Appl. Electrochem. 44 (2014) 1107-1116.
[50] J. Wu, F.G. Risalvato, S. Ma, X. Zhou, Electrochemical reduction of carbon dioxide III: the role of oxide layer thickness on the performance of Sn electrode in a full
electrochemical cell, J. Mater. Chem. A 2 (2014) 1647-1651.
[51] S. Lee, H. Ju, R. Machunda, S. Uhm, J.K. Lee, H.J. Lee, J. Lee, Sustainable production of formic acid by electrolytic reduction of gaseous carbon dioxide, J. Mater. Chem. A 3 (2015) 3029-3034.
[52] Q. Wang, H. Dong, H. Yu, H. Yu, Enhanced performance of gas diffusion electrode for electrochemical reduction of carbon dioxide to formate by adding
polytetrafluoroethylene into catalyst layer, J. Power Sources 279 (2015) 1-5.
[53] A. Del Castillo, M. Alvarez-Guerra, J. Solla-Gullón, A. Sáez, V. Montiel, A. Irabien, Electrocatalytic reduction of CO2 to formate using particulate Sn electrodes: Effect of metal loading and particle size, Appl. Energy 157 (2015) 165-173.
[54] J. Wu, P.P. Sharma, B.H. Harris, X. Zhou, Electrochemical reduction of carbon
dioxide: IV dependence of the Faradaic efficiency and current density on the microstructure and thickness of tin electrode, J. Power Sources 258 (2014) 189-194.
[55] S. Chee, J. Lee, Reduction synthesis of tin nanoparticles using various precursors and melting behavior, Electron. Mater. Lett. 8 (2012) 587-593.
[56] H. Jhong, S. Ma, P.J. Kenis, Electrochemical conversion of CO2 to useful chemicals: current status, remaining challenges, and future opportunities, Curr. Opin. Chem. Eng. 2 (2013) 191-199.
[56] D.D. Zhu, J.L. Liu, S.Z. Qiao, Recent Advances in Inorganic Heterogeneous Electrocatalysts for Reduction of Carbon Dioxide. Adv. Mat. 28 (2016) 3423-3452.
[57] S.D. Kapusta, N. Hackerman, Anodic Passivation of Tin in Slightly Alkaline Solutions, Electrochim. Acta 25 (1980) 1625-1639.
Figure Captions
Figure 1. Filter-press cell and electrode configuration.
Figure 2. TEM images. A) Sn pure particles. B), B1) Sn carbon supported particles.
Figure 3. Voltammetric profiles of A) Sn rod, B) Sn pure particles, C) Sn carbon supported particles in 0.45 mol L-1 KHCO
3 + 0.5 mol L-1 KCl solution Ar saturated (black line) and CO2 saturated (red line).
Figure 4. Sn-GDE voltammetric profiles of A) GDE with Sn pure particles (Sn/P-GDE), B) GDE with Sn carbon supported particles (Sn/C-GDE), in 0.45 mol L-1 KHCO
3 + 0.5 mol L -1 KCl solution Ar saturated (black line) and CO
2 saturated (red line).
Figure 5. Sn-GDEs SEM images. A) Sn/P-GDE; B) Sn/C-GDE.