Universidad de Valladolid
Facultad de Ciencias
Departamento de Física de la Materia Condensada, Cristalografía y
Mineralogía
SYNTHESIS AND CHARACTERIZATION OF A SILK-ELASTIN-LIKE
RECOMBINAMER FUSED TO ENHANCED GREEN FLUORESCENT
PROTEIN (SELR-EGFP) FOR THE ACHIEVEMENT OF
SELF-ASSEMBLED FLUORESCENT NANOPARTICLES AND PHYSICALLY
CROSS-LINKED HYDROGELS
A Master Thesis for the Degree of M.Sc. Molecular Nanoscience and
Nanotechnology presented by
Arturo Ibáñez Fonseca
Supervised by
AGRADECIMIENTOS
En primer lugar, agradecer a mi director de este TFM, Carlos, por dirigir mi trabajo y por darme la oportunidad de adentrarme en los entresijos de la ciencia y, más concretamente, de los recombinámeros de tipo elastina. Asimismo, he de dar las gracias al resto de “seniors” del G.I.R. Bioforge, por su constante apoyo y, en algunos casos, dirección, empezando por Javier Arias, que, indudablemente, ha colaborado a que este trabajo llegue a buen puerto. También a Matilde, Merche, Luis, y Alessandra, que tanto me ayudó en mis inicios y aún hoy sigue aportándome enseñanzas.
También a mis compañeros, a todos ellos, por aportar un ambiente de trabajo agradable y ameno, además de ser fuente de soluciones a todas aquellas dificultades que surgen durante el día a día.
No quiero olvidarme de la profesora María Luz Rodríguez Méndez, coordinadora del máster en la Universidad de Valladolid, que siempre me ha dado facilidades a lo largo del mismo para poder compaginarlo adecuadamente con la tarea investigadora.
Y, sin duda, un especial agradecimiento se merecen las personas que me han apoyado desde fuera, empezando por los amigos, que en momentos de dificultad me han ayudado a sobreponerme, pasando por la familia, que ha sido un apoyo en todo momento, y terminando por María, que tanto ha soportado cuando sobrevenían adversidades.
“Life's but a walking shadow, a poor player That struts and frets his hour upon the stage And then is heard no more: it is a tale Told by an idiot, full of sound and fury, Signifying nothing.”
CONTENTS
1. Introduction ... 1
1.1 Introduction to nanoscience and nanotechnology ... 1
1.2 Protein based materials ... 1
1.2.1 Elastin-like recombinamers (ELRs) ... 2
1.2.2 Silk-like and silk-elastin-like recombinamers (SELRs) ... 6
1.3 Enhanced Green Fluorescent Protein (EGFP) ... 7
2. Materials and Methods ... 8
2.1. Materials ... 8
2.1.1. Chemical reagents ... 8
2.1.2 Other materials ... 9
2.1.3 Molecular biology materials ... 9
2.1.4 Bacterial strain ... 11
2.1.5 Culture media ... 11
2.1.6 Buffers ... 11
2.1.7 Elastin-like recombinamers (ELRs) ... 12
2.2 Methods ... 13
2.2.1 DNA agarose gel electrophoresis ... 13
2.2.2 Plasmid purification ... 15
2.2.3 DNA digestion with restriction enzymes ... 15
2.2.4 DNA dephosphorylation ... 15
2.2.5 DNA fragments purification from an agarose gel ... 15
2.2.6 Ligation reaction ... 15
2.2.9 Glycerol stock preparation ... 17
2.2.10 Production and purification of recombinant polymers ... 17
2.2.11 Denaturing polyacrylamide gel electrophoresis ... 18
2.2.12 Nanoparticle formation ... 20
2.2.13 Cell culture experiments ... 21
2.2.14 Hydrogel formation ... 21
2.2.15 Experimental techniques ... 21
2.2.16 Experimental techniques performed by external services ... 23
3 Results and Discussion ... 25
3.1 Design, construction and recombinant production of (E50I60Silk)2 -EGFP ... 25
3.2 (E50I60Silk)2-EGFP physicochemical characterization ... 29
3.2.1 Evaluation of lyophilized SELR-EGFP pureness and molecular weight by SDS-PAGE ... 29
3.2.2 Determination of SELR-EGFP molecular weight by MALDI-TOF mass spectrometry ... 30
3.2.3 Secondary structure analysis of SELR-EGFP by Fourier Transform Infrared (FTIR) spectroscopy ... 31
3.2.4 Determination of the Inverse Temperature Transition (ITT) by Differential Scanning Calorimetry (DSC) as a function of pH and solvent... 32
3.2.5 Amino acid analysis (HPLC) ... 34
3.3 Evaluation of the fluorescence and nanoparticle formation of (EIS)2 -EGFP as recombinamer intrinsic properties ... 35
3.3.2 Assessment of the SELR-EGFP nanoparticle formation by Dynamic light scattering (DLS) and Transmission Electron Microscopy
(TEM) ... 37
3.4 Development of Layer by Layer nanotechnological approach for the obtaining of fluorescent cell adhesive nanopartibles ... 41
3.4.1 Zeta potential and size measurements ... 42
3.4.2 Cell culture of LbL nanoparticles ... 44
3.5 Qualitative examination of the fluorescent hydrogel ... 47
4. Conclusions ... 49
ABSTRACT
Nanoscience and nanotechnology constitute a combination of knowledge and tools very powerful in the fields of chemistry, physics and biology. The application of these tools in different experimentation areas has allowed, in the last few years, multiple technological progresses already available for final users.
Future perspectives make us anticipate that nanotechnology is going to be even more involved in the development of new biomedical devices for its clinical use. In this subject we can find elastin-like recombinamers (ELRs), of which self-assembly properties in response to different stimuli such us temperature let them to be classified as nanoscience based nanotechnological tools. Briefly, this self-assembly property, related to protein folding, takes place when temperature is raised above what is called transition temperature (Tt), specific for each designed ELR, triggering a phase transition from soluble to non-soluble in an aqueous solution, due to destabilization of water clathrates surrounding hydrophobic residues of the ELR and the hydrophobic interactions between them.
Previous works have given us evidence of the ability of some amphiphilic ELRs to form either nanoparticles (micelles) or hydrogels, depending on the recombinamer concentration (high or low, respectively). These hydrogels are a very promising tool in biomedicine due to its capability of simulate extracellular matrix (ECM), being extremely biocompatible. Furthermore, the combination of these recombinamers with motifs from Bombyx mori silk (referred to as silk domains) has reported and improvement of the mechanical properties and the stabilization of the structured hydrogels.
In addition, its recombinant characteristic permits the fusion of other proteins or peptides to an SELR backbone able to self-assemble, by the usage of recombinant DNA technology with the aim of obtaining fusion recombinamers with different bioactivities.
described above. These hydrogels, combined with other hydrogel forming SELRs with other bioactivities, could lead, when implanted, to the tracking of the material throughout the body with different fluorescence in vivo imaging devices.
It is also part of the work the characterization of the designed SELR, taking into account its protein composition, as well as in vitro experiments in cell cultures of micro and nanoparticles obtained by an approach of Layer by Layer (LbL) technique with the combination of two different SELRs with positively and negatively charged groups, being one of them the recombinamer presented in this work, named (EIS)2
RESUMEN
La nanociencia y la nanotecnología constituyen un conjunto de conocimientos y herramientas muy poderosas en el ámbito de la química, la física y la biología. La aplicación de estas herramientas en los distintos campos de experimentación ha permitido, en los últimos años, múltiples avances tecnológicos disponibles para el usuario final.
Las perspectivas de futuro nos hacen prever que la nanotecnología estará aún más implicada de lo que ya lo está en la fabricación de dispositivos biomédicos para su uso en clínica. Dentro de este apartado se encuentran los recombinámeros de tipo elastina (ELRs, en inglés), cuya propiedad de auto-ensamblado en respuesta a estímulos como la temperatura permite enmarcarlos dentro de la nanociencia y la nanotecnología. Brevemente, su característica principal es el plegamiento o self-assembly cuando la temperatura es superior a la que se denomina temperatura de transición (Tt), lo que conlleva una transición de soluble a insoluble en un disolvente
acuoso, debido a la ruptura de las jaulas de clatrato y a las interacciones hidrofóbicas. Estudios previos han demostrado la capacidad de algunos ELRs anfifílicos de formar bien micelas o bien hidrogeles, en función de la concentración de recombinámero (baja o alta, respectivamente). Estos hidrogeles son una herramienta con un elevado potencial en biomedicina por su capacidad de simular la matriz extracelular, siendo extremadamente biocompatible. Además, la adición de secuencias de aminoácidos provenientes de la secuencia de la seda de Bombyx mori ha demostrado mejorar tanto las propiedades mecánicas como la estabilidad de los hidrogeles.
También, su característica recombinante permite la fusión de otras proteínas presentes en la naturaleza mediante la tecnología de ADN recombinante, con el objetivo de obtener polímeros de fusión que, además de proporcionar un esqueleto para el desarrollo de matrices, tengan diferentes bioactividades.
distintas bioactividades, permitiría, una vez implantado, monitorizar, mediante distintos dispositivos de visualización de fluorescencia in vivo, el tránsito del hidrogel por el organismo en el cual se ha implantado.
Se presenta, además, la caracterización completa del material teniendo en cuenta su carácter proteico, así como experimentos in vitro en cultivos celulares de micro y nanopartículas obtenidas por Layer by Layer (LbL) mediante la combinación de dos ELRs distintos con grupos funcionales cargados positiva y negativamente, siendo uno de ellos el recombinámero objeto de estudio en este trabajo denominado (EIS)2-EGFP o, simplemente, SELR-EGFP, lo que permite su observación en el
1.
INTRODUCTION
1.1 Introduction to nanoscience and nanotechnology
Nanoscience is the study of phenomena at nanometre scale in many research fields, like physics (e.g. quantum effects), chemistry (e.g. study of supramolecular structures like micelles) and biology (e.g. investigation of DNA, proteins and other biomolecules assembling). The knowledge and the improvements derived from nanoscience can be applied to the development of tools, which make up nanotechnology. As the properties of materials in the nano scale are completely different from the ones in bulk size, new applications arise from nanotechnology.
The development of nanotechnological tools can be achieved by two different approaches:
Top-down: this approach consist in obtaining very small structures from larger ones by different techniques, such as photolithography, but has drastic limitations for getting objects of dimensions smaller than 100nm.
Bottom-up: in this approach, small molecules are used to build up supramolecular nanostructures, by the use of methods like layer by layer, colloid formation and others related to polymer science, for example. In this work, this approach will be used to obtain nanoparticles (NPs) by the aggregation of an amphiphilic protein polymer in a self-assembling process and later to get larger NPs by the combination of two different polymers with a layer by layer approach. 1.2 Protein based materials
nature this new nomenclature was proposed [5] in replacement of the more conventional terminology elastin-like polymers (ELPs), which include those first chemically synthesized materials.
1.2.1 Elastin-like recombinamers (ELRs)
ELRs are smart, genetically engineered biomaterials inspired by natural elastin and based on the very same recurring amino acid sequences as an ability to undergo high deformation without breaking and subsequent recovery of the original conformation once the stress disappears [6, 7]. The origin of this ability resides in the structure of the recurrent sequences (VPGVG, VPGG, VGVAPG) found in tropoelastin [8]. Some of the most relevant characteristics of ELRs, which are derived from those of the natural protein, serve as an example of how elastin’s mechanical properties are retained by way of cross-linked ELR matrices [9]. These mechanical properties become more interesting in conjunction with other properties such as biocompatibility, stimuli-responsive behavior and the ability to self-assemble [10, 11]. The most widely studied ELRs are based on the recurring pentapeptide sequence Val-Pro-Gly-Xaa-Gly, where Xaa is any natural amino acid except proline.
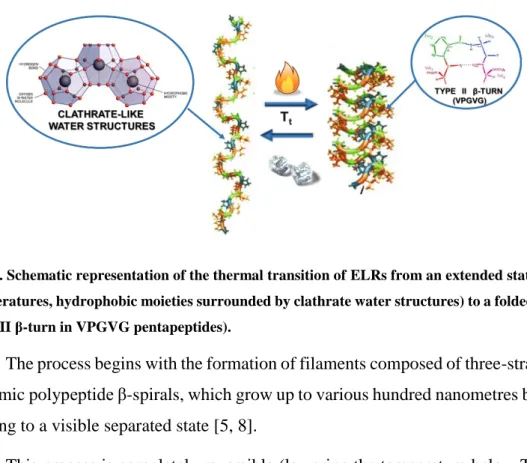
1.2.1.1 Inverse temperature transition (ITT)
Fig. 1. Schematic representation of the thermal transition of ELRs from an extended state (low
temperatures, hydrophobic moieties surrounded by clathrate water structures) to a folded state
(type II β-turn in VPGVG pentapeptides).
The process begins with the formation of filaments composed of three-stranded dynamic polypeptide β-spirals, which grow up to various hundred nanometres before settling to a visible separated state [5, 8].
This process is completely reversible (lowering the temperature below Tt, the initial state is recovered) and has an associated latent heat, ΔHt [5].This ΔHt is the result of the combination of the disruption of the water structure and the folding and stabilization owing to the Van der Waals interactions [14].One VPGVG is enough to permit the transition from random coil to an order β turn, but higher molecular weight polymers are required to obtain materials presenting useful properties [15].
1.2.1.2 ΔTt mechanism
Previously, it has been described the capacity of mechanical work creation as a result of the temperature increment above a certain transition temperature Tt. It
consist on a transition from a state where the molecules are extended in solution, to a phase separated state where the molecules are ordered and aggregated, consequently a mechanical work is being done. Thus, the process is a thermo-mechanical transduction.
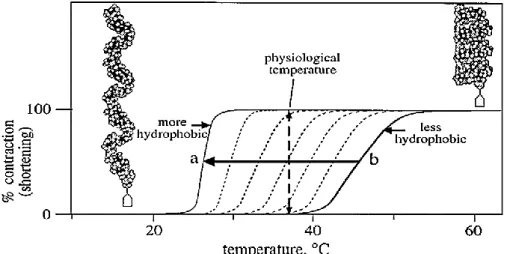
Different methods for modification of Tt have been described, most of them
based on the modification of the polarity of certain functional groups present in the fourth residue of the VPGXG pentapeptide, which can exist in two different states depending on a certain external stimulus. This change in the Tt, as result of different
hydrophobicity, open up a working temperature window in which the polymer isothermally and reversibly switches between the folded and unfolded states in response to environmental changes (Fig. 2).
Fig. 2. Plot as a function of temperature of the contraction of ELRs of different hydrophobicities.
Reproduced from [16].
This effect of changing the Tt is the basis of the ΔTt mechanism and has been
exploited to obtain pH, electric potential, light, chemical and other responsive interconvertible energy processes.
engineering of protein based materials capable of inverse temperature transitions [16]:
Axiom 1: The temperature intervals for the hydrophobic folding and assembly transition of a host protein or protein-based polymer with different guest substituents becomes a functional measure of their relative hydrophobicity.
Axiom 2: Heating to raise the temperature from below to above, the temperature interval for hydrophobic folding and assembly of macromolecules can drive contraction with the performance of mechanical work.
Axiom 3: At constant temperature, an energy input that changes the temperature interval for thermally-driven folding and assembly in a macromolecule can itself, drive hydrophobic folding and self-assembly.
Axiom 4: Two or more different functional groups of a macromolecule, each of which can be acted upon by a different energy input that changes the temperature interval for hydrophobic folding and assembly, become coupled one to another by being part of the same hydrophobic folding and self-assembling domain, that is, the energy input acting on one functional constituent alters the property of another functional constituent as an energy output.
Axiom 5: More hydrophobic domains make more efficient the energy conversions involving constituents undergoing conversion between more and less hydrophobic states.
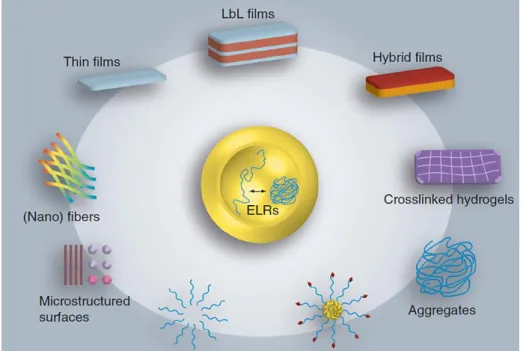
1.2.1.3 ELRs for biomedical applications
Fig. 3. Summary of the different structures that ELR-based systems can adopt for its usage in
biomedical applications. Reproduced from [21].
1.2.2 Silk-like and silk-elastin-like recombinamers (SELRs)
Silk-like recombinamers (SLRs) based on the repeating motif [GAGAGS], present in the silk of the silkworm Bombyx mori, produce crystalline structures similar to the β-sheet structures of native silk proteins [22]. This protein is insoluble by itself, but when combined with elastin-like recombinamers (SELRs), they become soluble in cold aqueous solvents [23]. Furthermore, although ELRs are reversible when factors like temperature are modified, SELRs are irreversible because of the high hydrophobic interactions between silk motifs which conduct to crystallization [24].
By the arrangement of a repetition of the silk hexapeptide described above together with a tetrablock structure of an amphiphilic elastin-like recombinamer, a co-recombinamer is obtained, being capable of self-assembling into structures that form nanoparticles at low concentrations and hydrogels when solution collapse into a mesh at high recombinamer concentration, with a very strong stability and irreversibility.
1.3 Enhanced Green Fluorescent Protein (EGFP)
Green Fluorescent Protein (GFP) is an auto-fluorescent protein first discovered by Shimomura et al. in 1962 in a protein extract from the jellyfish Aequorea Victoria
[26]. This protein is able to emit intense and stable fluorescence without the presence of any cofactors and in a very wide range of conditions (pH, temperature, salts) [27-29], which makes it very useful for molecular biology applications such as markers for gene expression analysis, tracking of analytes within cells or organelles [28, 30]. Other nanotechnological approaches can also take advantage of GFP by the inclusion of this protein in delivery systems or biomedical devices to allow tracking of materials through an organism [31-33]. Crystal structure of GFP can be observed in Fig. 4 [34].
Fig. 4. Green Fluorescent Protein crystal structure.
2.
MATERIALS AND METHODS
2.1. Materials
2.1.1. Chemical reagents
All the reagents employed on this work are listed on Table 1.
Reactive Brand
Acrylamide/Bis-acrylamide Amresco
AEBSF Apollo Scientific
Agarose Seakem. Cambrex
Ammonium persulphate (APS). Sigma-Aldrich
Ampicillin Apollo Scientific
Bromophenol blue Sigma-Aldrich
Chloridric acid Merck
Copper chloride Sigma-Aldrich
Dimethyl sulfoxide (DMSO) Carlo Erba
E-64 Apollo Scientific
Ethanol Merck
Ethylenediaminetetraacetic acid (EDTA) Sigma-Aldrich
Glycerol Sigma-Aldrich
Glycine Sigma-Aldrich
Leupeptin Apollo Scientific
Pepstatin A Apollo Scientific
Phenylmethylsulfonyl fluoride (PMSF). Apollo Scientific Phosphate buffered saline (PBS) Gibco
Sodium chloride (NaCl)- Sigma-Aldrich Sodium dodecyl sulfate (SDS) Sigma-Aldrich
Sodium hydroxide Sigma-Aldrich
Tetramethylethylenediamine (TEMED). Sigma-Aldrich
Ultrapure water Millipore
β-Mercaptoethanol. Sigma-Aldrich
2.1.2 Other materials
Glass material was conveniently washed with detergents if needed and rinsed with distilled wáter prior use.
Other materials, such us tips, microtubes, falcon tubes, etc. are bought sterile or are sterilized on an autoclave (Autotester E-75) for 20 minutes at 121ºC and 1 atm pressure.
2.1.3 Molecular biology materials
2.1.3.1 Restriction enzymes
The restriction enzymes used in this work are listed below:
DpnI, EcoRI, SapI,Eam1104I (Thermo Fisher).
All enzymes are used according to the manufacturer instructions.
2.1.3.2 Other enzymes
During the realization of this work the following enzymes have been employed, being all of them purchased to Thermo Fisher and used under the suggested conditions: T4 DNA Ligase, Shrimp alkaline phosphatase (SAP), FastAP Phosphatase (Thermo Fisher).
2.1.3.3 Cloning and expression vectors
Fig. 5. pDrive cloning vector.
For the expression of the different recombinant polymers a p7 expression vector has been employed (Fig. 6). The p7 plasmid was constructed in our laboratory from Novagen’s pET-25b (+) vector, by Dr. A. Girotti.
2.1.3.4 Other reagents
Three kits were used for the plasmid and DNA purification either from an
Escherichia coli (E.coli) culture or from an agarose gel: NucleoSpin Plasmid
(Macherey-Nagel), Quantum Prep Plasmid Midiprep Kit (Bio-Rad) and PureLink Quick Gel Extraction Kit (Life Technologies).
2.1.4 Bacterial strain
During the realization of this work different strains of E.coli for plasmid transformation have been employed: XL1-Blue Subcloning Grade and XL1-Blue Competent Grade (Stratagene).for plasmid cloning and BL21(DE3) Star (Invitrogen) and BLR(DE3) (Novagen) for plasmid expression.
2.1.5 Culture media
The culture media used for bacterial growth and transformation are listed below:
- Luria-Broth (LB) (Pronadisa): Concentration 25 g/L.
- Terrific Broth (TB) (Formedium): 55.85 g/L supplemented with 8 mL/L Glycerol (Fisher).
- LB-Agar: LB 25 g/L + 1.5% (w/v). Agar (Fluka).
- SOC Broth (Sigma Aldrich).
2.1.6 Buffers
The buffers employed along this work are the following:
- PBS: 5 mM Na2HPO4 (pH 7.4), NaCl 140 mM.
- TAE: 40 mM Tris-acetate (pH 8), 1 mM EDTA.
- TBS (washing buffer) :20 mM Tris-base (pH 8), 140 mM NaCl.
- TE (sonication buffer): 10 mM Tris-base (pH 8), 1 mM EDTA, 1mM PMSF.
- DNA loading buffer for agarose gel electrophoresis: 30% (v/v) glycerol, 0.1% (w/v) SDS, 0.05% (w/v) bromophenol blue (BPB), 50mM Tris-base (pH 8), 0.05 mM EDTA.
- Protein loading buffer: Tris-base 1M (pH 6.5), 312.5 mM, SDS 10% (w/v), Glycerol (v/v), β-Mercaptoethanol 25% (v/v), bromophenol blue (BPB) 2% (v/v).
All the solutions were prepared using ultrapure water (Millipore).
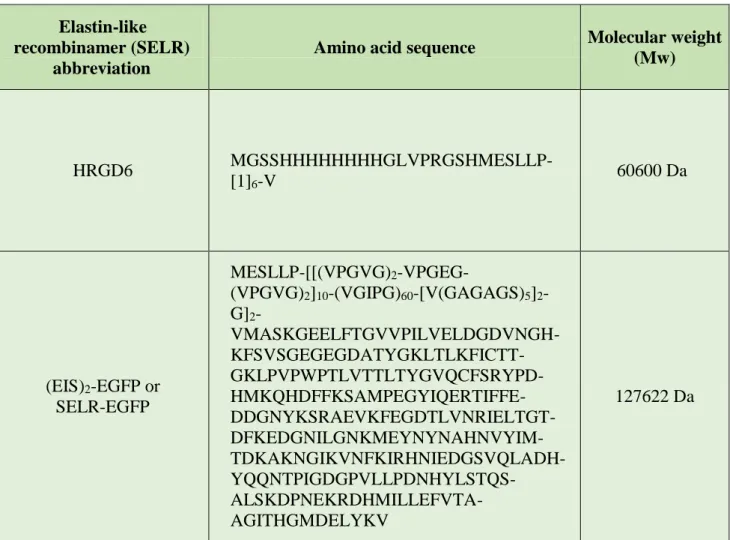
2.1.7 Elastin-like recombinamers (ELRs)
All the elastin-like recombinamers (ELRs) employed in the development of this work have been designed and produced in our laboratory (G.I.R. Bioforge) by recombinant DNA techniques. DNA corresponding the amphiphilic backbone plus a silk domain, named (EIS)2, was constructed by A. Fernández-Colino, while EGFP
gene was first cloned into a pDrive vector by M. Pierna. For the purpose of this work, (E50I60Silk)2-EGFP (also named (EIS)2-EGFP or SELR-EGFP) was specifically
designed and produced while HRGD6, a recombinamer used for a layer by layer approach, with a 6 times repetition of a cell adhesion bioactive sequence was already part of Bioforge’s list of recombinamers.
The production was done in E.coli fermentation (see Methods) and purified taking advantage of both the smart nature and the reversible thermo-dependent segregation showed by this kind of materials, by inverse transition cycling (ITC).
Elastin-like recombinamer (SELR)
abbreviation
Amino acid sequence Molecular weight (Mw)
HRGD6
MGSSHHHHHHHHGLVPRGSHMESLLP-[1]6-V 60600 Da
(EIS)2-EGFP or
SELR-EGFP
MESLLP-[[(VPGVG)2
-VPGEG-(VPGVG)2]10-(VGIPG)60-[V(GAGAGS)5]2
-G]2
- VMASKGEELFTGVVPILVELDGDVNGH- KFSVSGEGEGDATYGKLTLKFICTT- GKLPVPWPTLVTTLTYGVQCFSRYPD- HMKQHDFFKSAMPEGYIQERTIFFE- DDGNYKSRAEVKFEGDTLVNRIELTGT- DFKEDGNILGNKMEYNYNAHNVYIM- TDKAKNGIKVNFKIRHNIEDGSVQLADH- YQQNTPIGDGPVLLPDNHYLSTQS- ALSKDPNEKRDHMILLEFVTA-AGITHGMDELYKV 127622 Da
Table 2. Amino acid composition and molecular weight of the elastin-like recombinamers used in
this work.
2.2 Methods
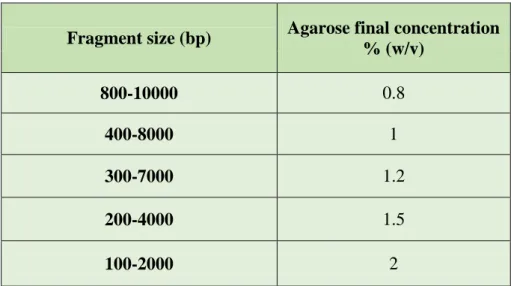
2.2.1 DNA agarose gel electrophoresis
Fragment size (bp) Agarose final concentration % (w/v)
800-10000 0.8
400-8000 1
300-7000 1.2
200-4000 1.5
100-2000 2
Table 3. Resolution in electrophoresis of different agarose gel concentrations.
The gels are prepared in a glass-made Erlenmeyer flask by adding the quantity of agarose and volume of TAE 1x required for each concentration. The agarose is melted in a microwave. Once melted the flask is weighted and ultrapure water (MQ) is added until reaching the initial weight, thus maintaining the initial concentration and gel uniformity. After cooling down to 60°C, the gel is casted in a horizontal tray with the desired comb.
DNA loading buffer 5x is added to the samples to reach a 1x concentration. A fixed voltage, between 2 and 7 V/cm – according to each sample, is then applied. The electrophoresis is run having as references the colored markers (Table 4). Last, the gel is stained for 10 to 30 minutes in a 1x Gselred solution, and the DNA bands are visualized by exposition to UV light in a Viber Lourmat, TFX-20M transilluminator.
TAE 1x –BPB Agarose concentration % (w/v)
2900 0.3
1650 0.5
1000 0.75
500 1
370 1.25
200 1.75
150 2
2.2.2 Plasmid purification
The plasmids employed in this work were purified using the commercial kits listed above following the manufacturer’s instructions. DNA was eluted with Elution Buffer from the kit or ultrapure water. For applications were higher DNA concentration is required only half of the recommended elution volume is used and the elution buffer is used at 65°C to enhance the purification yield.
2.2.3 DNA digestion with restriction enzymes
Reaction conditions (temperature, concentration, time of reaction, buffer) for the digestion are supplied by the enzyme manufacturer. The rate of digestion is controlled by DNA agarose gel electrophoresis.
2.2.4 DNA dephosphorylation
Dephosphorylation reaction conditions (temperature, time of reaction, buffer) are supplied by the phosphatase manufacturer. For the p7 expression vector two different consecutive phosphatases were used and the incubation time was enlarged until one hour to assure the correct dephosphorylation.
2.2.5 DNA fragments purification from an agarose gel
The target DNA band is first separated by electrophoresis and visualized in an agarose gel of an appropriated concentration and stained with RedGel. Secondly, the band is extracted from the gel with the help of a scalpel. Minimum quantity of agarose should be cut during band extraction.
The purification of the fragment is carried out using the commercial kit
PureLink Quick Gel Extraction Kit (Life Technologies) following the protocol indicated by the manufacturer.
2.2.6 Ligation reaction
reaction is interrupted by the inactivation of the T4 DNA ligase by incubation during 10 minutes at 70°C.
2.2.7 Cloning on the pDrive/p7 vector
Once the ligation reaction is concluded, a certain quantity of the ligation solution is used to transform competent cell as specified below.
2.2.8 Transformation of competent cells
2.2.8.1 Transformation of XL1 blue subcloning grade competent cells
This bacterial strain has an efficiency ≥ 106 transformants per microgram of DNA. Plasmid DNA to be amplified by cloning is transformed in this bacterial strain following the protocol specified by the supplier.
2.2.8.2 Transformation of XL1 blue competent cells
This bacterial strain has an efficiency ≥ 108 transformants per microgram of DNA. Ligation products were transformed into this bacterial strain following the protocol specified by the supplier.
2.2.8.3 Transformation of BLR(DE3) competent cells
This bacterial strain is transformed with the expression plasmid p7 following the chemical method TSS reagent (“Transformation and Storage Solution”) [36].
A single colony, isolated and grown in a LB-agar plate, is used to inoculate 10 mL of LB medium and grown at 37ºC with shaking (250rpm), until reach a OD600
Fig. 7. Schematic representation of ELR transformation process to a BLR(DE3) expression E.coli
strain.
2.2.9 Glycerol stock preparation
Positive clones of expression strains like BLR(DE3), which are of special interest, selected by SDS-PAGE electrophoresis, are grown at 37°C with shaking (250rpm) on LB with 0.5% of glucose (for the expression strains) and antibiotic at the optimal concentration, until reaching an OD600=0.6-0.8. Then, 0.1 volumes of 80%
(v/v) sterile glycerol and 0.9 volumes of cell suspension are added to a cryovial and stored at -80ºC.
2.2.10 Production and purification of recombinant polymers
2.2.10.1Production of ELRs
During the biosynthesis of SELR-EGFP, the expression vector p7 has been employed. p7 has been obtained in our laboratory by mutagenesis of pET25b (+) by Dr. Alessandra Girotti. The final constructions were transformed on the bacterial strain BLR(DE3) following the above mentioned protocol.
SELRs expression starts inoculating the desired colony in liquid LB medium plus antibiotic at 37°C with orbital shaking (250rpm) during approximately 6 hours. This culture is used as inoculum for a fresh TB medium (plus antibiotic), in a volume ratio of 1:500.
For large batches production, as this case, a 15L Bioreactor is used (Applikon Biotechnology), allowing the full control of variables like temperature, pH, OD600
from 14 to 16h, setting temperature at 37ºC, pH at 7, oxygen control at 50% of the initial oxygen concentration and stirring at 499rpm.
2.2.10.2Bacteria disruption
Once the induction is finished, the bacteria’s metabolism and growth are stopped by cooling it down to 4ºC and cells are centrifuged and washed with washing buffer until having a clear supernatant. Then, the cell pellet is re-suspended in 25 mL of TE per liter of culture. Cell suspension is kept at 4ºC and protease inhibitors (PMSF, AEBSF, E-64, Pepstatin A, Leupeptin) are added to the desired concentration to avoid ELR degradation by E.coli proteases.
Bacteria are disrupted (lysated) by changing pressure disruption employing a Constant Cell Disruption System (Model TS 0.75KW, Constant System). Finally, the lysate is centrifuged at 4ºC for 60 minutes at 15000xg. The supernatant contains the recombinant polymer biosynthesized.
2.2.10.3Purification of ELR
The purification of ELRs starts from the supernatant obtained at the end of the lysis process, taking advantage of the ELRs’ smart nature and inverse temperature transition (ITT). Therefore, the purification process is based on successive cycles of precipitation (heating) and resuspension (cooling) of the supernatant, named Inverse Transition Cycling (ITC). In order to reduce the Transition temperature (Tt) and facilitate the precipitation of the ELRs, NaCl is added during the purification process until a 1M concentration is achieved.
Finally, after the last purification cycle, the re-suspended polymer is dialyzed against cold ultrapure water. The solution is then adjusted to pH 7, frozen, lyophilized and stored at -20°C. Purification steps, as well as the final product, are checked by polyacrylamide gel electrophoresis.
2.2.11 Denaturing polyacrylamide gel electrophoresis
systems described by Laemmli [37] to achieve the separation of a mixture of proteins in a sample, being the gel composed of two different sub-gels: stacking and resolving. The proteins’ effective charge almost does not differ because the SDS strongly interacts with proteins providing them with approximately one negative charge per each amino acid residue The SDS completely denatures the proteins by breaking the non-covalent interactions responsible for the quaternary and tertiary structure. Besides, a reducing agent (β-mercaptoethanol) is added to the samples in the protein loading buffer in order to break the disulfide bonds that might exist. The reducing and denaturing process is facilitated with the heating of the samples during 5 minutes at 95ºC.
A “MiniVE vertical electrophoresis system” from Hoefer (Amersham Pharmacia Biotech, Pittsburg, USA) electrophoretic system was employed to perform the polyacrylamide electrophoresis. The total percentage of acrylamide (%T) in the resolving gel varies according to the molecular weight of the polypeptide we want to separate. A 10%T resolving gel was used in every SDS-PAGE experiment with the following composition (Table 5):
Reactive Resolving gel Stacking gel
Acrylamide 40% 10% (w/v) 4% (w/v)
Tris-HCl pH 8.8 375 mM ---
Tris-HCl pH 6.8 --- 125 mM
SDS 10% 0.1% (w/v) 0.1% (w/v)
APS 10 % 0.05% (w/v) 0.05% (w/v)
TEMED 0.05% (w/v) 0.08% (w/v)
Table 5. Gel composition for SDS-PAGE.
Staining is performed according to Lee’s method [38]: 10 minutes incubation at room temperature of the gel in a 0.3M Copper chloride solution followed by a washing step in distilled water for 5 minutes. Pictures are taken by Gel Logic 100 Imaging System camera system and Kodak 1D Image Analysis (Kodak) software.
2.2.12 Nanoparticle formation
2.2.12.1(EIS)2-EGFP nanoparticles
SELR-EGFP nanoparticles were formed by the dissolution of lyophilized recombinamer in ultrapure cold water or cold PBS at different concentrations: 10, 5 and 2 mg/mL. Samples were filtered with a 0.45µm filter to eliminate dust particles and then, each concentration of the samples dissolved in water was aliquoted in different tubes for following adjusting to different pH (4, 7 and 10.5). Tubes were stored at 4ºC until use in DLS experiments or in a plate reader for the measurement of the fluorescence intensity (see 2.2.15.1 and 2.2.15.5).
2.2.12.2Layer by Layer nanoparticles
For the purpose of obtaining (EIS)2-EGFP nanoparticles covered with HRGD6
by charge interactions between COO- groups of glutamic acid residues in the first one and NH3+ groups of lysine residues in the latter, SELR-EGFP solutions were
prepared by the dissolution of lyophilized recombinamer at different concentrations in ultrapure water: 1, 0.5 and 0.2 mg/mL. Samples were filtered with a 0.45µm filter to eliminate dust particles. This lower concentrations than the ones prepared for DLS experiments are due to the possibility of particle aggregation when HRGD6 is added to the suspension if higher concentrations are used.
Solutions were placed in a water bath at 37ºC on a magnetic stirrer (MR Hei-Tee, Heidolph) and a specified volume (depending on the charges ratio) of a 10 mg/mL HRGD6 solution (ultrapure water) was added drop by drop to the SELR-EGFP suspension with strong stirring and mixture was left at this conditions for 30 minutes for further stabilization. NH3+:COO- ratios used were 1:1, 2:1 and 5:1 for
2.2.13 Cell culture experiments
Cell culture experiments were performed with HFF-1 (human fibroblasts) cell line (ATCC, SCRC-1041). Medium used was DMEM GlutaMAX (Life Technologies) without the addition of serum to avoid particle adhesion to serum proteins.
First, cells were seeded on a 48-well plate, at a concentration of 10000 cells/well in a volume of 200µL of medium and it was incubated overnight at 37ºC, 5% CO2 (Steri-Cycle CO2 Incubator, Thermo Fisher). Afterwards, 5 mL of DMEM
were supplemented with 500µL of micro and nanoparticle suspension obtained by LbL, either of 1 or 0.5 mg/mL concentration to test both conditions. Then, medium in the wells was replaced by the supplemented one (200µL per well) and incubated at 37ºC and 5% CO2 for 2 hours and then for 24 hours.
Photographs were taken with a Nikon ECLIPSE Ti microscope coupled to a Digital Sights DS-2MBWc camera with the software NIS Elements (Nikon).
2.2.14 Hydrogel formation
Hydrogels were formed dissolving SELR-EGFP either in ultrapure water or PBS at a concentration of 125 mg/mL in an eppendorf tube during 16h at 4ºC in a rotational shaker. After complete dissolution, incubation at 37ºC was performed during 24h, taking pictures of the gel at 1h, 2h, 4h and 24h excited with visible and UV light to monitor the hydrogel formation.
2.2.15 Experimental techniques
2.2.15.1Dynamic light scattering
Brownian motion is the random movement of particles suspended in a fluid due to their collision with the solvent molecules that surround them. Thus, the random motion will be affected by different factors, mainly the size of the molecules (the bigger the molecules, the slower they move), the viscosity of the solvent (the more viscous the solvent, the slower the molecules move) and temperature. Temperature is a crucial parameter, both temperature stability and temperature accurate knowledge are required, due to its influence on the solvent viscosity and owing to, temperature instability will lead to convection currents in the sample, thus non- random motion, resulting in incorrect size interpretation.
The velocity of the Brownian motion is defined by the translational diffusion coefficient (D), which is used to calculate the size of the particles by using the Stokes-Einstein equation:
Where kB is the Boltzmann constant, T is the temperature and η is the
viscosity. It is worth noting, that DLS refers to how a particle diffuse within a fluid so the calculated diameter is a hydrodynamic diameter (Dh), (effective molecule
diameter plus hydration layer).
Light scattering measurements were performed using a Zetasizer nano ZSP (Malvern instruments) equipped with a 10mW He-Ne laser at a wavelength of 633nm. Size data were obtained at 37ºC (above Tt).
2.2.15.2Zeta potential
ζ-potential analysis is a technique for determining the surface charge of nanoparticles in solution. The ζ-potential of the ELR and Layer by Layer (LbL) obtained nanoparticles was monitored at 37ºC (above Tt) using a Zetasizer nano ZSP apparatus (Malvern instruments). Measurements were carried out in a range of SELR-EGFP concentrations and HRGD6:SELR-EGFP (or more precisely, NH3+:COO-) rates. The ζ-potential values, which were determined using the
2.2.15.3Differential scanning calorimetry (DSC)
Differential scanning calorimetry (DSC) is a technique in which the difference in the amount of heat required to increase the temperature of a sample and reference is measured as a function of temperature.
DSC experiments were performed using a Mettler Toledo 822e with a liquid-nitrogen cooler. The solutions were prepared at 50 mg/mL either in ultrapure water (MQ) at different pH, above and below the pKa of COOH side chain groups, or in PBS. For analysis, 20µL of the solution was placed in a standard 40µL aluminum pan and sealed hermetically. The same volume of MQ or PBS was placed in the reference pan.
2.2.15.4Fourier Transform Infrared Spectroscopy
FTIR analysis was conducted with a BRUKER TENSOR 27 spectrometer. A 64 scan spectrum was collected at single beam absorption mode with a 4 cm-1 resolution in an interval from 4000 to 600 cm-1. Calculations were done by OPUS software (Mattson Instrument Inc.).
2.2.15.5Measurement of fluorescence intensity
Fluorescence intensity was measured at every condition by the addition of 100uL of each sample to a 96-well plate and the introduction into a plate reader (SpectraMax M2e, Molecular Devices), setting λex = 488nm and λem = 530nm.
2.2.16 Experimental techniques performed by external services
2.2.16.1Amino-acid analysis
The amino acid composition of the ELR employed during this work was determined by Laboratorio de Técnicas Instrumentales (LTI, University of Valladolid).
represented amino acids from the 1/10 dissolution. One aliquot of each dissolution was derivatizated according to the AccQ-Tag Waters method and analyzed by HPLC with UV detection, using a WATERS600 HPLC gradient system with a WATERS2487 detector.
2.2.16.2MALDI-TOF
Determination of the SELR-EGFP molecular weight was made by MALDI-TOF at the Laboratorio de Técnicas Instrumentales (LTI, University of Valladolid).
2.2.16.3Transmission electron microscopy (TEM)
TEM measurements were conducted using a JEOL JEM-1230 electron microscope (cicBiogune, Bilbao) operating at 120 kV, in order to visualize the structures formed by (EIS)2-EGFP recombinamer. Specimens were prepared by
3
RESULTS AND DISCUSSION
3.1 Design, construction and recombinant production of (E50I60Silk)2-EGFP
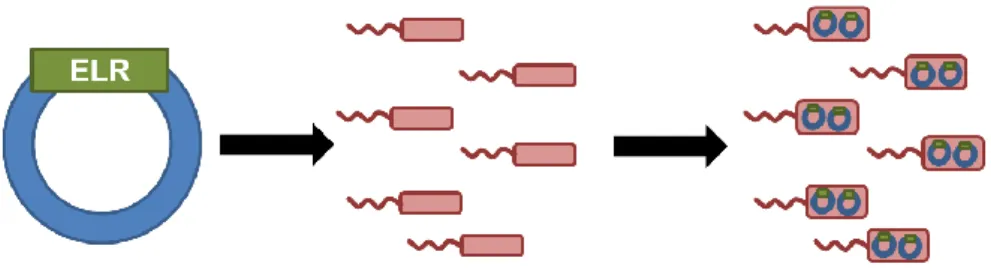
The combination of previous and recent work in our group, the first ones regarding the construction of amphiphilic ELRs, that showed a thermoresponsive gel formation at high concentrations [39], and the others concerning the addition of a silk domain in order to add strength to the hydrophobic interactions that stabilize the structure [23, 24], led us to the design of a naturally fluorescent hydrogel based on SELRs, by the fusion of the Enhanced Green Fluorescent Protein to the SELR backbone capable of forming very stable hydrogels (Fig. 8).
Fig. 8. SELR-EGFP schematic representation. E50 stands for [(VPGVG)2-VPGEG-(VPGVG)2]10;
I60 for (VGIPG)60; S for silk motif repetitions and EGFP for Enhanced Green Fluorescent
Protein sequence.
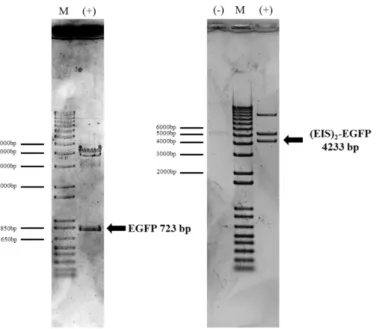
The construction of (E50I60Silk)2-EGFP gene was performed following the
guidelines described in materials and methods . The gene construction was assessed by agarose gel electrophoresis in every step of the process, as showed in Fig. 9.
Fig. 9. Agarose gel electrophoresis of two different steps in the SELR-EGFP gene construction
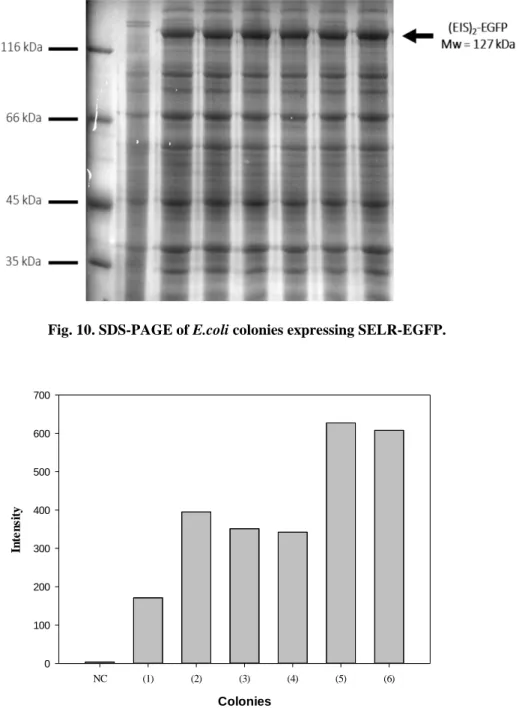
Finally, gene construction was achieved and subsequent production was done, by the transformation of a protein expression bacterial strain named BLR(DE3). Expression was qualitatively assessed by SDS-PAGE (Fig. 10) and quantitatively by the measure of fluorescence in a bacterial suspension (Fig. 11). Colonies were selected for their high expression, combining both qualitative and quantitative results. Negative control (NC or (-)) was a non-expressing colony for both experiments.
Fig. 10. SDS-PAGE of E.coli colonies expressing SELR-EGFP.
Colonies
NC (1) (2) (3) (4) (5) (6)
In
te
n
si
ty
0 100 200 300 400 500 600 700
By means of these results, colonies (5) and (6) were selected for the subsequent scaled-up expression and production.
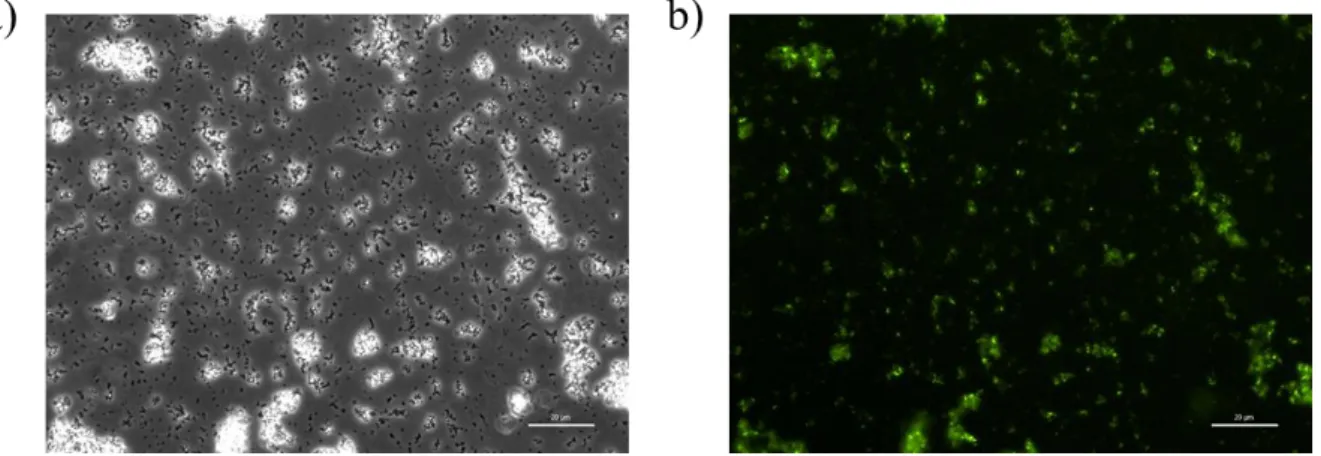
Bacteria could also be observed in a fluorescence microscope (Fig. 12), although a high green background can also be seen, small points corresponding bacteria can be detected.
Fig. 12. SELR-EGFP expressing bacteria observed by a) phase contrast and b) fluorescence
microscopy.
Fig. 13. SDS-PAGE of ITC steps during SELR-EGFP purification.
Fig. 14. SELR-EGFP fluorescence during ITC purification procedure.
3.2 (E50I60Silk)2-EGFP physicochemical characterization
Characterization was carried out by the preparation of a lyophilized sample, accordingly to the requirements of each technique.
3.2.1 Evaluation of lyophilized SELR-EGFP pureness and molecular
weight by SDS-PAGE
SDS-Polyacrilamide Gel Electrophoresis of the ultra-pure water solubilized freeze-dried recombinamer confirm the 99% purity of the final (EIS)2-EGFP
Fig. 15. SDS-PAGE of lyophilized SELR-EGFP at a concentration of 1 mg/mL.
3.2.2 Determination of SELR-EGFP molecular weight by MALDI-TOF
mass spectrometry
MALDI-TOF mass spectroscopy result was not totally satisfactory, as the peak corresponding to the whole (E50I60Silk)2-EGFP, with a molecular weight of 127 kDa,
did not appear. However, the peaks corresponding to the di and tri-ionized SELR molecules are present, suggesting the existence of the complete protein (Fig. 16).
Fig. 16. MALDI-TOF mass spectrometry spectrum of SELR-EGFP.
3.2.3 Secondary structure analysis of SELR-EGFP by Fourier
Transform Infrared (FTIR) spectroscopy
Fig. 17 corresponds to the Fourier Transformed Infrared spectrum of (EIS)2
-EGFP. Peaks near 1650 cm-1 refer to amide I band, as a result from the C=O stretching
vibrations of the peptide bond, while peaks near 1540 cm-1 and 1240 cm-1 are named
amide II and amide III bands, respectively. The peak near 3300 cm-1 is thought to be
Fig. 17. FTIR of the lyophilized SELR-EGFP.
3.2.4 Determination of the Inverse Temperature Transition (ITT) by
Differential Scanning Calorimetry (DSC) as a function of pH and solvent
Inverse Temperature Transition (ITT) can be determined by Differential Scanning Calorimetry (DSC) a technique described elsewhere [41]. Briefly, a sample is introduced in an aluminium standard crucible (Mettler Toledo) and placed in the DSC instrument, together with a reference that contains the solvent in which the sample was dissolved. Both are heated at the desired rate and kept at the same temperature. The sample will suffer an endothermic phase transition above its transition temperature which means that a fraction of the heat will be absorbed in this transition, so an additional heat will be necessary to maintain the sample at the same temperature than the reference. The temperature at this point is termed ITT being the lowest value of the observed peak (Fig. 18).
C:\BACKUP 20-12-12\C\bioforge\Espectros\Arturo\(EIS)2-eGFP NIP 1052.1 (EIS)2-eGFP NIP 1052 Instrument type and / or accessory 26/05/2014
Fig. 18. DSC thermogram of SELR-EGFP at different conditions of pH and solvent.
As expected, the ITT is lower in the case of solution of SELR-EGFP in ultrapure water (MilliQ, MQ) at pH 3.49 than when at pH 7.58. This is due to the fact that at pH below the pKa of carboxylic acid (COOH) of glutamic acid residues in the elastin polypeptide chain, i.e. pH 3.49, this group is uncharged (COOH), lowering the interaction with water molecules. This means that there are less water molecules surrounding the protein and therefore a lower temperature or energy is needed in order to break these interactions and promote transition when compared with the SELR-EGFP solution at pH 7.58, because in this case, carboxylic group is deprotonated (COO-) and hence the interaction with water molecules is higher than in the other case.
3.2.5 Amino acid analysis (HPLC)
HPLC was performed by an external service in order to assure the amino acid composition. Results are showed in Table 6. In conclusion, experimental results are close to the predicted, differences being explained because of the technique sensitivity.
AMINO ACID THEORETICAL EXPERIMENTAL
Alanine 50 50.55
Arginine 6 7.49
Asparagine 14
21.53
Aspartic Acid 18
Cysteine 2 -
Glutamine 7
49
Glutamic Acid 38
Glycine 524 562.18
Histidine 9 6.3
Isoleucine 133 136.07
Leucine 21 18.91
Lysine 18 13.68
Methionine 8 7.63
Phenylalanine 12 8.44
Proline 231 231.93
Serine 31 24.74
Threonine 18 11.66
Tryptophan 1 -
Tyrosine 11 8.68
Valine 321 329.23
3.3 Evaluation of the fluorescence and nanoparticle formation of (EIS)2
-EGFP as recombinamer intrinsic properties
3.3.1 Evaluation of the fluorescence of an SELR-EGFP solution in
different conditions by fluorescence spectroscopy and qualitatively by UV light
radiation
Fluorescence intensity was measured in a plate reader, fixing the excitation wavelength in 488 nm and the emission in 530 nm, at different pH values and SELR concentrations to determine the effect of this factors in the fluorescence emission of EGFP. Temperature was fixed at 37ºC.
The data obtained (Fig. 19 and Fig. 20) is in good agreement with the information found in the bibliography concerning EGFP that concludes the fluorescence intensity dependence on pH and on protein concentration. This complying between our data and previous data suggests that the fusion of the EGFP protein to an SELR backbone does not have a disadvantageous effect on the EGFP folding, allowing it to get its native, and subsequently fluorescent, conformation.
Blank is either PBS or MQ, depending on the solvent used to prepare solutions. Experiment was performed at physiological temperature, 37ºC, which is above ITT, so nanoparticles are present in the suspension as determined by DLS at every condition.
pH
4 7 10,5
F lu o re sc e n ce i n te n si ty 0 2000 4000 6000 8000 10000 12000 14000 2 mg/mL 5 mg/mL 10 mg/mL
Fig. 19. Fluorescence intensity of SELR-EGFP suspension in ultrapure water (MQ) at different
Concentration (mg/mL)
2 5 10
F
lu
o
re
sc
e
n
ce
i
n
te
n
si
ty
0 1000 2000 3000 4000 5000 6000
Fig. 20. Fluorescence intensity of SELR-EGFP suspension in PBS at different recombinamer
concentrations at 37ºC.
With the purpose of confirming fluorescence by actual visualization of this phenomenon, and establish a visual correlation between fluorescence intensity and pH and SELR-EGFP concentration, a photograph of the same plate used to obtain the results in the plate reader showed above was taken (Fig. 21). To observe fluorescence, an ultraviolet lamp to excite the dissimilar samples was needed.
Fig. 21. Picture SELR-EGFP suspension excited with an UV lamp in different solvents, pH and
This qualitative result is clearly in concordance with the quantitative ones acquired in the plate reader instrument.
Finally, both types of experiments, qualitative and quantitative give us evidence of fluorescence intensity dependence on SELR-EGFP concentration and pH, as reported elsewhere [27, 29], being a pH of 10.5 and higher recombinamer concentrations the best candidates for a greater fluorescence intensity. Furthermore, there are also slight but clear differences between solvents at the same neutral pH, being more evident when analysing the quantitative results.
3.3.2 Assessment of the SELR-EGFP nanoparticle formation by
Dynamic light scattering (DLS) and Transmission Electron Microscopy (TEM)
Dynamic light scattering studies were performed at low concentrations of (E50I60Silk)2-EGFP in order to assess the size of the self-assembled structures derived
from the amphiphilic behaviour of the designed SELR [42, 43]. Experiments were carried out at different concentrations of SELR-EGFP solution in different solvents (PBS and ultrapure water). In the case of the SELR dissolved in water, different pH values were used to study the effect of this parameter on the SELR solution at 10 mg/mL.
Size is showed as a distribution where the population of NPs for each size is given by the % of volume. This data is directly linked to the intensity of scattered light by using the formula of a sphere volume, taking into account that the nanoparticles’ shape is close to this geometry. %Volume gives more accurate values when several populations are present in the suspension, as intensity is proportional to the size of the particles (for a higher size, higher intensity) and populations of large particles could mask the importance of smaller ones .
All experiments were performed at 37ºC, as mentioned in 2.2.15.1. Polydispersity indexes were all close to 0.2 in every case.
distribution is quite similar for 5 and 10 mg/mL, but smaller particles show up for the case of 2 mg/mL.
Size (nm)
0 25 50 75 100 125 150 175 200 225 250 275 300 325 350 375 400
% V
o
lu
m
e
0 5 10 15 20 25
2 mg/mL 5 mg/mL 10 mg/mL
Fig. 22. Size of (EIS)2-EGFP particles in MQ at different concentrations at pH 7.0.
Size (nm)
0 25 50 75 100 125 150 175 200 225 250 275 300 325 350 375 400
%
V
o
lu
m
e
0 5 10 15 20 25 30
2 mg/mL 5 mg/mL 10 mg/mL
Fig. 23. Size of (EIS)2-EGFP particles in PBS at different concentrations at pH 7.2.
Size (nm)
0 50 100 150 200 250 300 350 400 450 500 550
% V
o
lu
m
e
0 5 10 15 20 25 30
pH 4 pH 7 pH 10.5
Fig. 24. Size of (EIS)2-EGFP particles at 10 mg/mL in MQ at different pH values.
In conclusion, the size (EIS)2-EGFP nanoparticles is affected by different
factors like solvent composition and pH, which is in good agreement with data found elsewhere. Furthermore, concentration of the SELR has an influence on the final size distribution of the nanoparticles. All these factors determine the self-assembling of the SELR-EGFP molecules by having a direct effect either on the material or in the solvent.
Fig. 25. TEM photograph of a (EIS)2-EGFP nanoparticle suspension at 10 mg/mL in PBS.
3.4 Development of Layer by Layer nanotechnological approach for the obtaining of fluorescent cell adhesive nanopartibles
The nanoparticle structures found by DLS studies of (E50I60Silk)2-EGFP led us
to the development of a new hypothesis in order to achieve coated nanoparticles (NPs) by the combination of positively and negatively charged molecules. Although previous work has been done regarding LbL particle formation with ELRs [44], due to the nanoparticle formation without the addition of any mould, the LbL technique is in this case simplified when compared to other traditional LbL approaches: by the simple heating at 37ºC of the (E50I60Silk)2-EGFP solution, more or less stable nanoparticles
are obtained. Then, an ELR with positively charged groups called HRGD6 is added to the suspension and NPs become coated by electrostatic interactions. This ELR confers the ability of promote cell adhesion through integrins present in the cell membrane by the RGD amino acid sequences present in this protein. Furthermore, if a positive and stable charge is achieved, NPs could be internalized by cells when added to a cell culture.
concentration of (EIS)2-EGFP taking into account the volume needed to add of
HRGD6 recombinamer solution. Procedure is described in materials and methods section.
3.4.1 Zeta potential and size measurements
To analyse the particle behaviour, zeta potential measurement studies were carried out at different concentrations of (E50I60Silk)2-EGFP and afterwards in
different ratios of NH3+: COO- (from the side chains of lysine from HRGD6 and
glutamic acid from (E50I60Silk)2-EGFP, respectively). Experiments were performed at
human physiological temperature (37ºC). First results can be seen in Table 7 and Table 8.
[(EIS)2-EGFP]
(mg/mL) Z-Potential (mV) Size (nm)
0.2 -34.87 110
0.5 -38.03 150
1 -33.27 185
Table 7. Inital size and zeta potential measurements of SELR-EGFP at different concentrations.
[(EIS)2-EGFP]
(mg/mL)
NH3+:COO
-molar ratio Z-Potential (mV) Size (nm)
0.2
1:1 -26.67 151
2:1 -25.1 160
5:1 -14.3 370
Table 8. Zeta potential and size of different NH3+:COO- ratios at a single concentration as a
proof-of-concept LbL experiment.
aggregation. Observing the particle suspension of 5:1 ratio, there is obvious evidence of macroparticles formation (data not shown). This is not a desired phenomenon, but this problem could not be resolved neither by strong stirring nor by changing the temperature of the layer by layer process, always above the Tt of SELR-EGFP.
As a 5:1 ratio of NH3+:COO- was insufficient to achieve positively charged
particles, higher ratios were used. However, this ratio was still used for further experiments at higher concentrations to see if any effect related to this parameter occurs. The lowest SELR-EGFP concentration of 0.2 mg/mL was also discarded as the suspension of this particles was barely detected as fluorescent in a plate reader (data not shown). A summary of the results in size and zeta potential measurements of 0.5 and 1 mg/mL can be seen in Table 9.
[(EIS)2-EGFP]
(mg/mL)
NH3+:COO
-molar ratio
Z-Potential
(mV) Size (nm)
0.5 5:1 12.27 530
10:1 13.47 602
1 5:1 11.63 550
10:1 12.33 756
Table 9. Zeta potential and size values for the different combinations of concentrations and ratios
Surprisingly, at 0.5 and 1 mg/mL a ratio of 5:1 was enough to achieve positively charged nanoparticles when it did not happen for the 0.2 mg/mL suspension, maybe due to the HRGD6 cross-linking between nanoparticles, leading to an aggregation and not stable nor homogeneous particles. Nevertheless, molar ratio of 10:1 was not rejected in order to see experimental differences between both ratios in cell culture experiments.
With the aim of getting more stable and less disperse nanoparticles by the continuous increase in the hydrophobic interactions between silk domains, (EIS)2
suspension could be detected. In this study, initial SELR-EGFP concentration is studied, that is, the recombinamer concentration before the addition of HRGD6 solution (0.625 and 1.67 mg/mL for 0.5 and 1 mg/mL, respectively).
[(EIS)2-EGFP]
(mg/mL)
Time
(days) Z-Potential (mV) Size (nm)
0.625
1 -31.56 160
3 -30.43 155
7 -31.89 156
1.67
1 -29.07 192
3 -29.85 194
7 -30.91 197
Table 10. Zeta potential and size measurements at different incubation times and concentrations
of SELR-EGFP
The fact that size stabilization is not being achieved by an increasing in the incubation time, nor polydispersity is lowering could be explained by the fibre arrangement of the recombinamer, leading to a more complex structure that cannot be completely described by DLS. Hence, further characterization should be done by different methods, such as atomic force microscopy (AFM) and/or transmission electron microscopy (TEM).
3.4.2 Cell culture of LbL nanoparticles
HFF-1 cell line (fibroblasts) was used to perform the cell adhesion and/or internalization experiment, as is a very common line in the study of the adhesion properties of materials. Procedure is described in Materials and Methods section.
that particles are adhered to cell surface and not just deposited, so further investigations were done at 24 hours.
Fig. 26. HFF-1 cell culture in DMEM medium supplemented with 1 mg/mL suspension of
SELR-EGFP nanoparticles covered with HRGD6 by LbL after 2 hours of incubation. Phase contrast
(up) and fluorescence (down) microscopy photographs of the same area.
After 24 hours of cell culture, pictures were taken in order to assess the development of the nanoparticles and if cell adhesion or even internalization could be demonstrated. Although more precise experiments should be performed, this observation could also lead to the verification of cytotoxicity of the SELR nanoparticles.
supplemented with 0.5 mg/mL nanoparticles, it can be seen the lesser number of NPs than in the other case, and a more aggregated state, but still a preferable arrangement on cell surface, being even more clear the non-presence of the NPs on the areas of well without cells.
Fig. 27. HFF-1 cell culture in DMEM medium supplemented with 1 and 0.5 mg/mL suspension of
SELR-EGFP nanoparticles covered with HRGD6 by LbL after 24 hours of incubation. Phase
contrast (up) and fluorescence (down) microscopy photographs of the same area.
Fig. 28. HFF-1 cell culture in DMEM medium supplemented with 1 mg/mL SELR nanoparticles
suspension after 24h of incubation. Focus set at cell surface.
3.5 Qualitative examination of the fluorescent hydrogel
As described in 1.2.2 and 3.1, (EIS)2-EGFP recombinamer has the ability of
collapsing when dissolved at high concentrations in an aqueous solvent, which leads to the formation of an hydrogel structure.
To qualitatively assess the gelification process and the fluorescence of the recombinamer hydrogel, two solutions of SELR-EGFP at 150 mg/mL were prepared, the first one using ultrapure water (MQ) as solvent and the other one using PBS as a physiological buffer standard. When dissolved, solutions were place at 37ºC for 1 hour and 1 day and pictures were taken to study the gel formation and the intrinsic fluorescence of the material.
Fig. 29. Qualitative examination of fluorescence and stability of SELR-EGFP hydrogels either in
ultrapure water (MQ) or in PBS after different times of incubation at 37ºC. UV transilluminator
used as excitation source.
4.
CONCLUSIONS
The increasing knowledge of phenomena in the nanometre scale is leading to the development of different tools in diverse fields by a set of approaches closely related to chemistry and physics. In this way, biological systems are also susceptible of being considered nanotechnological tools since, in many cases, processes such as self-assembling are spontaneous in nature implying different kinds of biomolecules, including proteins like human elastin.
By the recombinant DNA technology it is able to design and produce in E.coli
host different proteins like elastin derivatives, named elastin-like recombinamers (ELRs), in order to achieve a biomaterial with very controlled self-assembling properties depending on ELRs composition.. It is also possible to fuse other bioactive peptides or proteins to these recombinamers to improve its functionalities and the combination with other molecules with self-assembly properties, like silk domains derive from silk of Bombyx mori.
The Enhanced Green Fluorescent Protein has been widely used during the last decades in molecular biology applications and has very promising uses in the development of biomedical devices for imaging purposes. By these means, an SELR-EGFP fusion protein was designed, produced and characterize in order to determine the properties of this material.
It was also achieved dual bioactive particles with self-assembling capacity as much as fluorescence emission and cell adhesion by the RGD sequence of the second recombinamer. These particles were capable of adhering to the cell surface and even of internalization, although this phenomenon it is not really clear with the information presented above and should be thoroughly studied with other techniques such as visualization with a confocal microscope, which allows a very good observation through every level of the cells.
hydrogels in biomedicine to track implants through the body. There is also plenty of space for the improvement of the methods developed during the experiments performed considering that most of them were carried out just once and/or with some time limitations. For example, controls using the SELR used as a backbone of the final fluorescent recombinamer should be included in following works, mainly studies of particle size and z-potential characterization as the influence of EGFP on the self-assembling process has not been addressed. There is also need to perform further visualization experiments to evaluate if exists or not internalization of the layer by layer resulting nanoparticles and, if not, it should be pursued by the changing of charge ratios as it could have some potential applications for in vitro and in vivo studies.