P e r f o r m a n c e analysis of a 7-kW crystalline silicon
generator after 17 years of o p e r a t i o n in M a d r i d
Eduardo Lorenzo , Roberto Zilles , Rodrigo Moretón , Trinidad Gómez and Ainhoa Martínez de Olcoz
ABSTRACT
The degradation observed on a 7-kWp Si-x photovoltaic array after 17 years of exposure on the roof of the Solar Energy Institute of the Polytechnic University of Madrid is presented. The mean peak power degradation has been 9% over this time, or an equivalent to 0.53% per year, whereas peak power standard deviation has remained constant. The main visual defects are backsheet delamination at the polyester/polyvinyl fluoride outer interface and cracks in the terminal boxes and at the joint between the frame and the laminate. Insulation resistance complies well with the requirements of the International Electrotechnical Commission 61215 tests.
KEYWORDS
field exposure; long-term degradation; PV module performance; terminal box failures; delamination
1. INTRODUCTION
Publications on Si-x photovoltaic (PV) modules perfor-mance after long-term outdoor exposures are becoming increasingly available in the literature. They mainly come from dedicated test beds [1^1] and as well as from PV systems in the hands of research groups [5]. Together with specialised studies [6-10], they provide useful informa-tion, helping to understand outdoor degradation mecha-nisms and, therefore, to improve the long-term reliability of PV modules. In summary, they show that qualification in accordance with the International Electrotechnical Commis-sion (IEC) 61215 [11], despite not being specifically designed for measuring degradation rates but just to assure a certain robustness [12], generally encompasses peak power degradation equivalent to 0.6-1% per year for spans of around 10 to 20years. The main observed defects are as fol-lows: ethylene-vinyl-acetate browning, metal grid oxidation, delamination, soiling, and others. In more detail, a recent summary [13] of reported degradation rates shows an
average of 0.7% per year and a median of 0.5% per year. Maximum power degradation appears to depend mainly on ultraviolet light [14], which helps to explain the differences in reported degradation rates in terms of time (per year).
This paper presents the degradation observed in a 7-kWp Si-x PV array after 17 years of exposure on the roof of the Solar Energy Institute of the Polytechnic University of Madrid (40.45N, 3.72W, 667 m). Typical yearly meteorological data [15] of the site are as follows: horizontal global solar irradiation, Gy(0)= 1640kWh/m ; in-plane global solar irradiation, Gy(20)= 1830kWh/m ; average ambient temperature, 7,Y=15°C; and relative humidity,
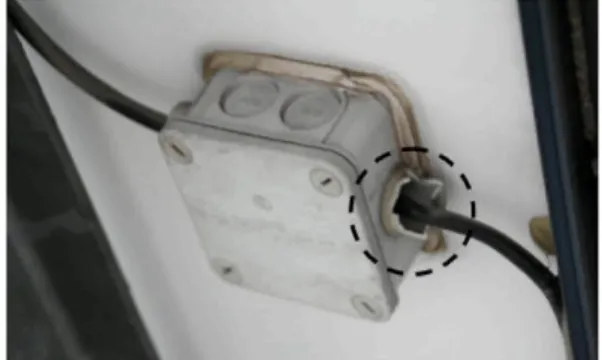
an anodized aluminium frame, with a silicone joint. The PV system was connected to the grid on the 13th of December 1993 by means of an inverter with galvanic insulation be-tween the direct current and alternating current circuits, and has been kept in routine operation for around 75% of the time, whereas for the other 25%, it has been used for different research purposes, mainly PV pumping testing. It can be un-derstood here that the P V array has mostly been held at max-imum power operating conditions. No particular maintenance or cleaning procedures have been made during this time. Figure 1 shows a general view of the installation and a close view of a PV module. It is worth noting the 2-cm gap between the metallic frame and the solar cells, because it has effectively avoided the impact of soiling on the energy performance and has also probably been effective in preserving electric safety.
In fact, despite significant backsheet delamination and silicon joint degradation, the PV modules have successfully passed the two electrical insulation tests (dielectric with-standing test and wet leakage test) established by the IEC 61215 [11]. As far as we know, the wet leakage insulation test results for aged PV modules have not been published before. Hence, the good insulation performance of our modules can be understood as the good news of this paper. This is particularly interesting because thermal cycles and damp heat following the IEC 61215 do not normally give rise to delamination [16], so that the associated electrical
Figure 1 . (a) General view of the installation, (b) Close-up view of a
photovoltaic module. The 2-cm gap between the frame and the solar cells in the bottom part has effectively prevented soiling affecting the energy performance, as well as preserving the electrical insulation.
ules but only on naturally aged ones after many years of ex-posure to the elements.
In addition, electric performance degradation has been equivalent to 0.53% per year, which is along the lines of that found by other authors. Despite not being a new result, we consider that it is still valuable, because obtaining rea-sonably accurate degradation rates requires an interval of several years between initial and final measurements [12], and the associated difficulty makes such measurements relatively scarce.
2. VISUAL DEFECTS
During the first 13 years of exposure to the elements, the only visual symptom of degradation appeared in the termi-nal boxes. In fact, although these boxes are IP65, they are not specifically designed for PV modules but for general electric installation purposes and they include several lateral holes with their corresponding cable grips. The degradation appeared in the form of cracks at these cable grips (Figure 2). However, it should be mentioned, on the one hand, that these pieces can be easily substituted by new ones and, on the other hand, that this kind of terminal box is not used any more in the PV industry, so that further in-depth comments are not required here.
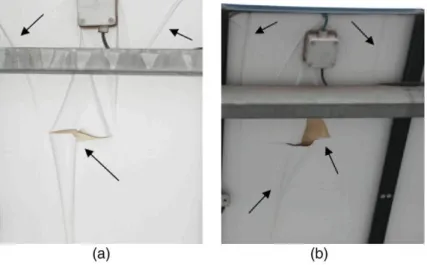
During the last 3 years, serious backsheet delamination has developed at the outer PET/PVF interface (Figure 3), affecting large areas of 62 modules, that is, 69% of the total. According to Reference [5], this indicates a stability problem in the corresponding adhesive used by the backsheet supplier. It is worth remembering that the adhe-sion between the polymer film (PVF) and the inorganic coating (PET) has been highlighted as a critical aspect of this technology [2,10]. Moreover, degradation symptoms also appeared in the joint between the laminate and the frame (Figure 4). Finally, many solar cells exhibit some colour darkening. Visual appearance suggests that this degradation is due to antireflective coating oxidation, as mentioned by other authors [5]. Table I summarises all the visual defects found and their incidence in the sample.
Figure 2. Cracks in the terminal boxes appeared during the first
^
¿ N i
i M
;• /
\
I
(b)
Figure 3. Visual defects appeared after the first 17years of operation: backsheet delamination at the outer polyester/polyviny
fluoride interface.
Table I. Main visual defects found and their incidence in the
sample.
(b)
Figure 4. Visual defects appeared after the first 17 years of
op-eration: (a) cracks and (b) moss in the joint between the laminate and the metallic frame. Solar cells darkening is also clearly
visi-ble in this picture.
Despite sometimes being mentioned by other authors, we have not observed other visual defects, such as front delamination (milky pattern) or grid oxidation. The latter suggests that, despite backsheet delamination, the remaining
Defect Modules affected Percentage (%)
Cracks in the terminal boxes Low-grade backsheet delamination High-grade backsheet delamination
Cracks in the frame joint Moss in the frame joint Solar cells darkening
6 42
20
33 22 75
7 47
22
37 24 83
PVF/PET sheet is still being able to prevent significant mois-ture penetration. The relatively dry climate of Madrid can also help to explain this result.
3. ELECTRICAL PERFORMANCE
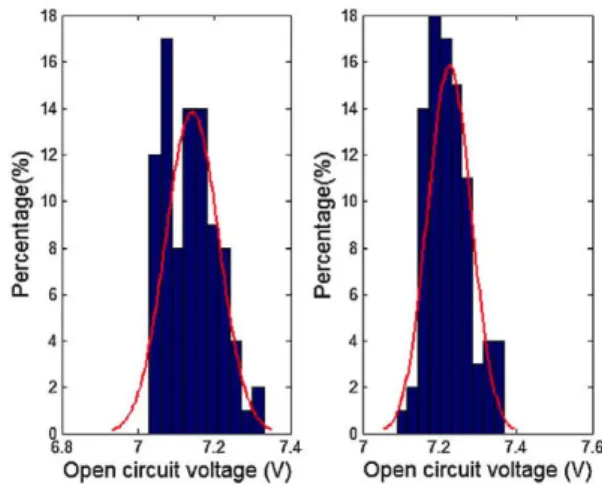
between calibration values have been —11.2% in power, —6.8% in short-circuit current, —0.4% in open-circuit voltage and —4.4% in fill factor. All the I-V curves obtained were translated into standard test condi-tions following the IEC-60891 [17]. Because of the 3 days of initial exposure, we consider that possible light degradation, typical in boron-doped p-type crystline Si solar cells with oxygen contamination, had al-ready occurred when we measured. Hence, we consider our initial values correspond to the so-called stabilised power. Table II shows the corresponding re-sults in terms of mean and standard deviation values of the main characteristics at standard test conditions. It is worth noting that outdoor exposure has reduced the mean peak power but not enlarged standard devia-tion values. This suggests homogeneous manufacturing procedures and can be understood as good news, because it implies that mismatch losses in large PV arrays do not significantly increase over time. Refer-ences [3] and [5] mention a similar result. The mean peak power degradation has been 9.0% over 17 years, which is often considered as equivalent to 0.53% per year. The main source of degradation is the short-circuit current, with a decrease of 8.0% (or an equiva-lent to 0.47% per year), whereas the open-circuit voltage has diminished only a 1.2% (0.07% per year), and the fill factor has remained basically constant. A word of caution is necessary here: because we fully lack in intermediate measurements, we cannot say that degrada-tion has been homogeneous throughout the time, as is suggested by a constant per year ratio. However, other authors have suggested that the degradation of output power in PV modules tends to be linear over time, espe-cially for periods of several years and more [18].
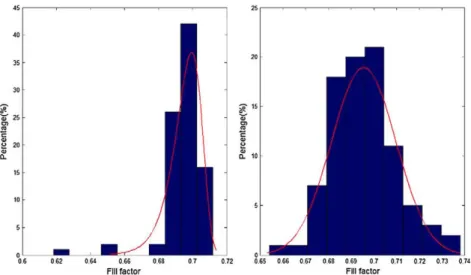
Figures 5-9 show the distribution of the main electrical parameters at the beginning and at the end of the period. All of them followed a normal distribution before the exposition. The short-circuit current and the open-circuit voltage keep their shape after the 17 years of outdoor exposition, whereas the fill factor and the maximum power follow now a Weibull distribution because of the presence of some outliers. It is worth not-ing that the skewness of the latter curves can translate to increasing mismatching losses [19].
14 U.5 15 15.5 16 16.5 17 17.5
Short circuit current (A)
Figure 5. Short-circuit current distribution before (ranging frorr
15.3 to 17.1 A) and after (ranging from 14.5 to 15.2A) the 17 years of outdoor exposition.
7 7.2 7.4
Open circuit voltage (V)
7.2 7.4 7.6
Open circuit voltage (V)
Figure 6. Open-circuit voltage distribution before (right) and
after (left) the 17years of outdoor exposition.
4. ELECTRICAL INSULATION
To know the extent at which the aforementioned defects can affect the electrical safety of our installation, we submitted six modules showing low-grade and
Table II. Characteristics at STC of the PV modules, before and after 17years of exposure.
Characteristics at STC
Maximum power (W) Short-circuit current (A) Open-circuit voltage (V) Fill factor Mean 81.1 16.14 7.23 0.696 1992 Standard deviation 1.06 0.30 0.06 0.01 Mean 73.8 14.85 7.14 0.696 2009
Stand ard deviation
1.50 0.14 0.07 0.01 M Degradation ean (%)
06 062 064 07 0.72 065 066 067 068 069 07 0.71 0.72 0.73 074
Fill factor
Fill factor
Figure 7. Fill factor distribution before (right) and after (left) the 17years of outdoor exposition
Maximum power (W)
Figure 8. Maximum power distribution before (ranging from
78.4 to 84.0) and after (ranging from 65.5to76.8) the 17years of outdoor exposition.
-14 -12 -10 -8 -6
Power loss (%)
Figure 9. Degradation rate distribution, referred to the power loss.
high-grade backsheet delamination to the dielectric withstanding test and to the wet leakage test described in the IEC 61215. Applied voltages have been 1216 and 500 V, respectively. For both tests, the acceptance criterion [11] is that the product of the resulting insu-lation resistance, Riso, a nd the PV module surface, S.
must be equal to or larger than 40M£2-m or M£2m . Because S = 0.7965 m , it means Riso must be larger than 50.2 MÍ2. Figure 10 shows the details of the leak-age wet test. Table III shows the tests results. All the modules widely succeeded in passing the tests.
5. CONCLUSIONS
The long-term performance of a 7-kWp PV array, made up of 90 PV Si-x modules, after 17 years of exposure in Ma-drid has been presented. The main visual defects are backsheet delamination at the PET/PVF outer interface, antireflective coating degradation and cracks in the termi-nal boxes and in the joint between the frame and the lami-nate. However, their impact on performance is rather low: the average peak power degradation is 9%, still within the power warranty offered by the manufacturer; peak power standard deviation remains basically constant; and insula-tion resistance is several times larger than that required to pass the corresponding IEC 61215 tests successfully. Hence, the PV array is still delivering energy under safe conditions.
ACKNOWLEDGEMENT
Figure 10. Wet leakage test, (a) Positive and negative poles are
short-circuited. The photovoltaic module is then submersed up to the terminal boxes in a water solution with 656fi-cm or ficm resistivity, and voltage is applied between the poles and the frame, (b) Detail of the partial submersion: the line indicates the ¡quid level. The non-submersed part of the module is sprayed
with the same water solution.
Table III. Results of the dielectric withstanding and the wet
eakage tests for six randomly selected modules.
EC 61215 test result, fi|So(Mffl
Seria number 030 066 058 077 088 039 Delamination grade High High Low Low Low High Dielectric withstanding 2590 3120 2530 2830 2480 2210 Wet eakage 327 379 303 439 427 316 IEC, International Electrotechnical Commission
REFERENCES
1. King DL, Quintana MA, Kratochvil JA, Elibee DE, Hansen BR. Photovoltaic module performance and durability following long-term field exposure.
tions 2000; 8(2): 241-256.
2. Dunlop ED, Halton D. The performance of crystalline silicon photovoltaic solar modules after 22 years of continuous outdoor exposure. Progress in Photovol-taics: Research and Applications 2005; 14(1): 53-64. DOI: 10.1002/pip.627
3. Skoczek A, Sample T, Dunlop ED. The results of performance measurements of field-aged crystalline silicon photovoltaic modules. . Progress in Photovol-taics: Research and Applications 2009; 17: 227-240. DOI: 10.1002/pip.874
4. Sastry OS, Saurabh S, Shil SK, Kumar R, Kumar A, Bandopadhyay B. Performance analysis of field exposed single crystalline silicon modules. Solar Energy Materials &Solar Cells, 2010 94:
1463-1468. DOI: 10.1016/j.solmat.2010.03.035
5. Sánchez-Friera P, Piliougine M, Peláez J, Carretero J, Sidrach de Cardona M. Analysis of degradation mechanisms of crystallines silicon PV modules after 12 years of operation in Southern Europe. Progress in Photovoltaics: Research and Applications 2011 Published online in Wiley Online Library. DOI:10.1002/pip.l083
6. Dhere DH, Pandit MB. Study of delamination in acceleration tested PV modules. Proceedings of the 17th European Photovoltaic Solar Energy Conference, 572-575 2001.
7. Osterwald CR, Pruett J, Moriaty T. Crystalline silicon short-circuit current degradation study: initial results. Proceedings of the 31st IEEE Photovoltaic Specialist Conference, 1335-1338 2005
8. Jorgensen GJ, McMahon TJ. Accelerated and outdoor aging effects on photovoltaic module interfa-cial adhesion properties. Progress in Photovoltaics: Research and Applications 2008; 16(6): 519-527. DOI: 10.1002/pip.826
9. Vázquez M, Rey-Stolle I. Photovoltaic module reliability model based on filed degradation studies. Progress in Photovoltaics: Research and Applications, 2008; 16(5): 419^133. DOI: 10.1002/pip.825 10. Jorgensen GJ, Terwilleger KM, DelCueto JA, Glick
SH, Kempe MD, Pankow JW, Pern FJ, McMahon TJ. Moisture transport, adhesion, and corrosion protec-tion of PV module packaging materials. Solar Energy Materials and Solar Cells 2006; 90: 2739-2775. DOI: 10.1016/j.solmat.2006.04.003
11. International Electrotechnical Commission. Standard IEC 61215: crystalline silicon terrestrial photovoltaic module design qualification and type approval. Sections 10.3 and 10.15 2006
modules. A literature review. Progress in Photovol-taics: Research and Applications 2009; 17(1): 11-33. DOI: 10.1002/pip.861
13. Jordan DC, Kurtz SR. Photovoltaic degradation rates—an analytical review. Progress in Photovol-taics: Research and Applications 2011; 21: 12-29. DOI: 10.1002/pip.ll82
14. Osterwald CR, Anderberg A, Rummel S, Ottoson L. Degradation analysis of weathered crystalline-silicon PV modules. Proceedings of the 29st IEEE Photovol-taic Specialist Conference, 1392-1395 2005 15. www.aemet.es/es/elclima/datosclimatologicos
16. Chianese D, Realini A, Cereghetti N, Rezzonico S, Bura E, Friesen G, Bernasconi A. Analysis of
weathered c-Si PV modules. 3rd World Conference on Photovoltaic Energy Conversion. 2922-2926 2003 17. International Electrotechnical Commission. Standard
IEC 60891: photovoltaic devices—procedures for temperature and irradiance corrections to measured I-V characteristics 2010.
18. Osterwald CR, Adelstein J, Del Cueto JA, Kroposki B, Trudell D, Moriaty T. Comparison of degradation rates of individual modules held at maximum power. Proceedings of the 4th World Conference on PV Energy. 2006. 19. Jordan DC, Wohlgemuth JH, Kurtz SR. Technology