Influence of acrylic adhesive viscosity and surface roughness on the properties of adhesive joint
Eva Paz1, Professor Julian Jose Narbon2, Dr J. Abenojar3, Dr Mar Cledera1, Dr. Juan
Carlos del Real-Romero1
institute for Research in Technology (IIT)/Mechanical Engineering Dept, Univertadad Pontificia Comillas. Madrid, Spain,
2Escuela Tecnica Superior de Ingenieria y Disefio Industrial, Universidad Politi^Iica de
Madrid, Spain,
3Materials Performance Group, Materials Science and Engineering Dept., Universidad
Carlos III de Madrid, Spain
Corresponding author: Eva Paz, Institute for Research in Technology (IIT), Universidad lias, c/ Alberto Aguilera 23, 28(
Email: [email protected]
Pontificia Comillas, d Alberto Aguilera 23, 28015 Madrid, Spain.
Received: 01 December 2014; revised: 11 May 2015; accepted: 11 May 2015
Abstract
adhesive. Additionally, it also produces a high shrinkage during curing, which leads to
the apparition of residual stresses that weakens the interfacial strength. However, once the optimum value, an increase in the viscosity produces a negative effect on the joint strength as a result of an important decrease in the wettability.
KEYWORDS: Surface roughness, Wetting, Rheology, Lap-shear, Structural acr
5*
crylicscT
1. INTRODUCTION
Adhesives exhibit very different rheological properties before and after curing. The rheology of adhesives is a very important issue concerning adhesives during dispensing,
mainly when automatic dispensing systems are used [1]. In addition, the rheological properties of adhesives define characteristics such as: processability, application, wettability, etc. [2]
JfcT
Prior to curing, adhesives should act as fluids, capable of being transported to the adherend surface and should copy the surface morphology via sufficient wetting of the
surface. During the curing process, the adhesive increases its viscosity until it is fully cured. At this moment, the adhesive reaches the adequate mechanical properties for the joint requirements.
Since the phenomenon of adhesion is a surface phenomenon, the surface micro-geometry
has a great influence on the strength of the adhesive bond [3,4]. It has been demonstrated
6]. However the exact relationship between strength, durability and surface roughness is
difficult to predict because it depends on many factors (e.g. wetting, surface treatment, etc.) and can vary as a result of the adhesive type. Penetration of the adhesive into the structure created by the surface treatment is an important parameter to achieve durable
bonds [7]. Other authors argue that a rougher surface produces an increase of the actual
• /
surface area and, therefore, increases the potential for multiple bonds betweentfn!the J
adhesive and the substrate [8]. In any case, both effects have positive influence on thec
adhesion. However, if the roughness is too high, the level of strength can decrease. Some
authors have shown that there is a critical value of roughness for which the joint exhibits the maximum strength [4,9]. This critical value depends on the surface treatment and the properties of the adherend and the adhesive, which include wettability and viscosity.
v S V
From this critical value of roughness, there appVtr^o be problems associated with trapped air bubbles and reduced wettability of the adhesive, which may cause a reduction
in joint strength [10].
In order to achieve good adhesion, it is essential to conduct a satisfactory wetting of the adherend by the adhesive [11]. This wetting is strongly influenced by surface roughness
[12,13]. Roughness may affect the penetration of the adhesive into the pores and topographical features of the adherend surface [14]. Lopog
Wettability can be studied by contact angle measurements, among other techniques. The
)i me 4
Sv
The contact angle on a smooth and a rough surface can be calculated by the roughness
factor, according to Wenzel's equation [15]:
cos0rough^r-cos0smooth (1)
Where 6rough the rugged contact angle on the rough surface, 6smooth the smooth contact
angle balanced on the smooth surface and roughness factor characteristic of the
roughened surface (actual surface / nominal surface).
o
Some studies [16] have shown that the surface treatment may chq^^k^!rrface, notonly on a morphological level, but also on a chemical level, which could modify the surface energy of the adherend and cause chemically heterogeneous surfaces and alter the
wetting at the same time. In addition, the speed at which the droplet deposited on the surface of the adherend reaches equilibrium depends on various factors, such as the capillary forces, whose origin is th^kfface tension, y, and viscosity r|.
Therefore, the viscosity of the adhesive can also influence the penetration into the voids
and surface roughness in terms of the speed with which the wetting occurs. This effect could modify the equilibrium predicted by the surface tension of the adhesive. This
behavior may affect the wetting process and consequently the adhesion strength [11].
^
The aim of this study was to investigate the effect of adherend surface roughness and adhesive viscosity on wettability. For that purpose, an acrylic adhesive with different
2. EXPERIMENTAL 2.1 Materials
In this study an acrylic adhesive was synthesized in the laboratory, based on some formulations used by other authors [17]. The adhesive composition is shown in Table 1. A commercial activator (a condensation product of an amine and an aldehyde), Loctite 7388 (Henkel Iberica, Barcelona, Spain) was used as cure activator.
J
8
The different viscosity values for the adhesives used in this study were obtained by
modifying the concentration of neoprene in a range between 8% and 16%, in respect of the total mass of monomers.
* #
During the manufacturing process of the adhesive, neoprene was dissolved in methyl methacrylate by magnetic stirrer agitation at room temperature over a period of 24 hours.
The cure initiator was added just before the adhesive application. The activator was applied directly onto the substrate.
The adherend used was an aluminum alloy EN AW 6082-T6 treated by mechanical abrasion through sandpaper to achieve two different levels of roughness, Ra=0.2um and Ra=2um. The sandpaper grit used was P600 in the first case and P60 in the second case. The roughness was measured with a contact profilometer Type SJ-201 P (Mitutoyo, Neuss, Germany).
The viscosity of the adhesive in relation to the content of neoprene was studied with a
rotational vi sco si meter Fungilab Smart Serie (Fungilab, Barcelona, Spain) according to UNE 12092:2002. The measurements were made with a R2 spindle of stainless steel at a rotation speed of 1.5 rpm. Five adhesive formulations with different contents of neoprene
(8, 10, 12, 14, and 16 wt %) were tested.
2.3 Contact Angle Measurements And Surface Tension Determination aPhy: The contact angle was measured by using an OCA 15 plus goniometer (DataPhysics,
Filderstadt, Germany) following UNE EN 828:2009. The contact angle was studied in order to evaluate the wettability of the adhesive with different neoprene contents on the two adherends with different levels of roughness (Ra=0.2um and Ra=2um). Six adhesive
formulations (8, 10, 11, 11.5, 12 and 12.5 wt % neoprene) were tested. The determination of surface tension was carried out with the same equipment using the Pendant Drop
Method. The adhesive pendant drop dispensed was 3uL and the image was captured after 10 seconds. SCA20 software (DataPhysics, Filderstadt, Germany) was used to determine surface tension. Five adhesive formulations with different contents of neoprene (8, 10,
12, 14, and 16 wt %) were tested.
2.4 Lap-Shear Strength
The effect of the adhesive viscosity on the joint strength was evaluated by tensile shear tests using single-lap joints according to UNE EN 1464:2010. The tests were performed in an universal testing machine Ibertest ELIB 20W (Ibertest, Madrid, Spain). The
wide, 100 mm long and 1.6 mm thick. The sections were bonded together with an overlap
length of 12.5 mm. The average bondline thickness was 0.8±0.1 mm and was cured for 72 hours under controlled temperature (23±2 °C) and humidity (30±5 %). A jig was used to achieve the bondline thickness and to ensure proper alignment [18]. Six adhesive
formulations with different contents of neoprene (8, 9, 10, 12, 14 and 16 wt %) were tested. The values shown in the graphs correspond to an average of five test specimens
and the bars indicate the standard deviations.
^
J
1
2.5 Scanning Electron Microscopy
In order to analyze the effect of the viscosity and the roughness on the joint interface,
single-lap specimens were prepared and a section was cut according to Figure 1, using a low-speed water-cooled diamond saw (Minitom, Struers A/S, Copenhagen, Denmark). The joint section was observed by scanning electron microscopy (SEM) using a Philips
XL-30 microscope (Philips, Eindhoven, Holland). The samples were prepared using gold coating in a high-resolution Polaron SC7610 sputter coater (VG Microtech, Uckfield,
United Kingdom) in order to obtain a conductor media for electrons and sufficient contrast in the SEM micrographs. The energy of the electron beam was 20 kV.
cP
fe^^^J 3. RESULTS AND DISCUSSION
of their macromolecules and the diffusion into the solvent, forming a single phase. The
cohesive forces, which initially hold the macromolecules linked, are weakened and the distance between the macromolecules chains is reduced.
^5\*
The interaction between chains depends on the degree to which the solvent molecules reduce the intermolecular contact, and therefore weaken the cohesive forces between the polymer chains. When the solution has high concentration of neoprene, the
V
disaggregation of the polymer macromolecules is low; in consequence the cohesive
forces between their macromolecules are strong [19]. TheseJiign^rfcWrmolecular forces lead to an increment of viscosity and surface tension
* #
Figure 3 shows the contact angle of the adhesive as a function of the adhesive viscosity, measured on two adherends with different levels of roughness (Ra=0.2 um, Ra=2 um).
As can be observed, an increase in viscosity produces an increase in contact angle for both levels of surface roughness. As discussed before, the increase in the viscosity means an increase in the surface tension of the adhesive and therefore a reduction in wettability
[20].
J&
The adhesive samples prepared with up to 10% neoprene may be considered as low viscosity adhesives, and the adhesives samples with higher concentrations may be
viscosity) the contact angle is smaller for the roughest surface. This is in accordance with
the Wenzel equation.
However, when the viscosity rises, a point is reached in which this trend is reversed and
the contact angle is smaller in the less rough surface. This is Part 2 of Figure 3 (hig viscosity) and in this part, the Wenzel's equation is not satisfied.
* »
t^
Before discussing these results it is important to emphasize that the Wenzel equation
assumes two ideal situations: the surface energy of both adherends (smooth and rough) is similar and the penetration of the adhesive into the superficial cavities and roughness is
complete [21,22].
^ >
However, it is possible that one or both of these ideal assumptions are not satisfied and
for a certain value of viscosity, the WenRl equation might fail. It would be possible to consider two hypotheses about why, beyond a certain degree of viscosity, and depending
on the roughness of the adherend, the Wenzel equation becomes invalid.
e»
The first hypothesis considers that the surface treatment not only modifies the topography of the adherend, but also modifies the physicochemical properties (e.g. surface chemistry
The second hypothesis considers that for relatively high values of viscosity, the
penetration into the voids and the copy of the superficial morphology to achieve good wettability may be hampered. This may be especially important in the case of very rough surfaces, or surfaces whose morphology shows very sharp peaks and valleys.
In this study, it has been observed that in the case of low viscosities, the a d h e ^ S
capable of copying the surface morphology perfectly. Thus a good penetration of the ve is
ormation or ^
adhesive into the surface microcavities is achieved, avoiding the formation of voids that
would lead to joint failure. Furthermore, the intimate contact adhesive-adherend is improved.
e o l a lowviscc
Figure 4 shows the joint interface in the case of a low viscosity adhesive (8% neoprene), the micrographs demonstrate a good wettability: the adhesive (on top) is an exact copy of
the morphology of the adherend (on the bottom). The penetration into the microcavities of the surface is complete, not only in the case of substrate with low roughness (Figure 4-a), but also in the case of rough substrates (Figure 4-b and Figure 4-c).
e»
However, Figure 5 shows how in the case of adhesive samples with high viscosity, the copy of the morphology of the adherend by the adhesive is not as exact as in the case of
low viscosity adhesives, this is a consequence of a poorer wettability and a worse
the SEM images as a true copy of the surface by the adhesive. It is independent of the gap
distance between the adhesive and adherend produced by the shrinkage.
Figure 5-a shows the interface of an adhesive with 10% neoprene and Figure 5b of an
adhesive with 12% neoprene (Figure 5-b), using the substrate with a high roughness of ;e how the 2um in both cases. In the areas marked in these images is possible to appreciate how the
adhesive with 10% of neoprene (low viscosity) is able to copy the morphology of the adherend better than in the case of the adhesive with 12% of neoprene (high viscosity); as a consequence, the wettability and the intimate contact are more favorable.
This trend is observed even in the case of the low roughness substrate, Figure 5-c and Figure 5-d compare the interface quality for a roughness of 0.2 um in the case of a low viscosity adhesive with 10% of neoprene (Figure 5-c) and a high viscosity adhesive of
16%) of neoprene (Figure 5-d). The decrease of the wettability and of the contact between adhesive and substrate is considerable with the viscosity rise; this effect is in agreement
with the contact angle results reported above.
e»
x
In relation to the micrographs commented above, it is important to highlight some other effects observed as a consequence of the increase in the viscosity, which could modify
the adhesive joint strength.
When Figure 4-a (8% Neoprene), Figure 5-a (10% Neoprene) and Figure 5-b (12%
between adhesive and substrate is greater in the case of the adhesive with a lower
neoprene content, which also means lower viscosity. This is about 4.4um in the case of the adhesive with 8% of neoprene, and of 1.8um and 1.5um in the case of 10% and 12% of neoprene, respectively. The gap observed in the micrographs is a consequence of the
adhesive shrinkage that happens during the curing process, which is considerably reduced when the neoprene content of the adhesive is increased. Initially, when the adhe esiveis
applied, it spreads by the surface, wetting the adherend and making a perfect (|opy*bf the surface morphology. However, during the curing, the polymerization of the acrylic adhesive can result in a large adhesive shrinkage [24].
Figure 6 shows an example of the quality of the interface, where it is possible to observe that the shrinkage of the adhesive mainly has two consequences on the quality of the joint. On the one hand, the number of observed contact points along the interface is
reduced. Also the breakage of the bonds, which were formed before the contraction of the adhesive, is observed. Although initially when the adhesive is applied, a good adhesion
could be formed, the shrinkage during the curing process promotes the interfacial failure. In addition, the contact points due to chemical interactions are short range forces, thus they directly depend on the distance between adhesive - adherend, as for example, the
der Walls forces. On the other hand, this shrinkage may also generate residual Van der M
stresses that can cause detrimental effects and can damage the joint strength [25, 26].
Figure 6-a corresponds to the adhesive with 16% of neoprene (high viscosity). In this
adhesive (short distance adhesive-adherend), consequently, a substantial number of
contact points may be observed and the distribution of these along the interface is homogeneous. However, Figure 6-b, which corresponds to the adhesive with 8% of neoprene (low viscosity), shows that the bonds were broken due to the contraction (see
circles in the figure), and the distribution along the interface is less homogeneous that in the other case.
in the ne
The effects discussed above, which are a consequence of the increase in the neoprene content (viscosity), affect in some way the final adhesive joint strength. Figure 7
represents the variation of the average shear strength with the viscosity of single lap joint specimens. The results for both adherends used in this study are represented. In order to make the discussion of the results easier, the average shear strength graph is divided into
two parts.
. 6
N
Part 1, marked in Figure^ferS^rmsented in detail in Figure 8, corresponds to the low values of viscosity. At them values, the observed trend is particularly different to the rest
of the graph. The strength is generally low, but is lower in the case of adherend with Ra=2
urn than in the case of Ra=0.2 urn. In addition, the strength continuously increases in the
case of the rough surface with the viscosity, however in the case of the surface with
Ra=0.2 urn it is possible to note a punctual decrease of the strength.
This is mainly explained, on the one hand, by the low toughness of the adhesive when the
remarkable in rough adherends. The rough surfaces present more stress concentration
points that facilitate the cracks propagation if the adhesive is not tough enough [27]. On the other hand, the breakage of the bonds due to shrinkage is especially important for these low neoprene content adhesives.
^
In contrast to the previous case, in part 2 of Figure 7, the joint strength is g r e a j e j ^ j h j
case of adherends with high roughness; in spite of this, it is important to note that the trend is similar for both adherends used: the average shear strength increases with the
viscosity increase until it reaches an optimal point. From this point, for values of higher viscosity, the strength decreases. For very elevated viscosities, the strength decreases considerably.
^ >
To explain the observed trend in the strength with the viscosity variation, it is necessary to consider that the viscosity increase produces different effects in the behavior of the
adhesive joint. Some of these effects are positive, however, some others may adversely affect the joint. Consequently, as the variation of the viscosity of the adhesive does not
affect a single property, it is necessary to consider the overall balance of the change in each of the affected properties, in order to understand the global result on the final stren;
X
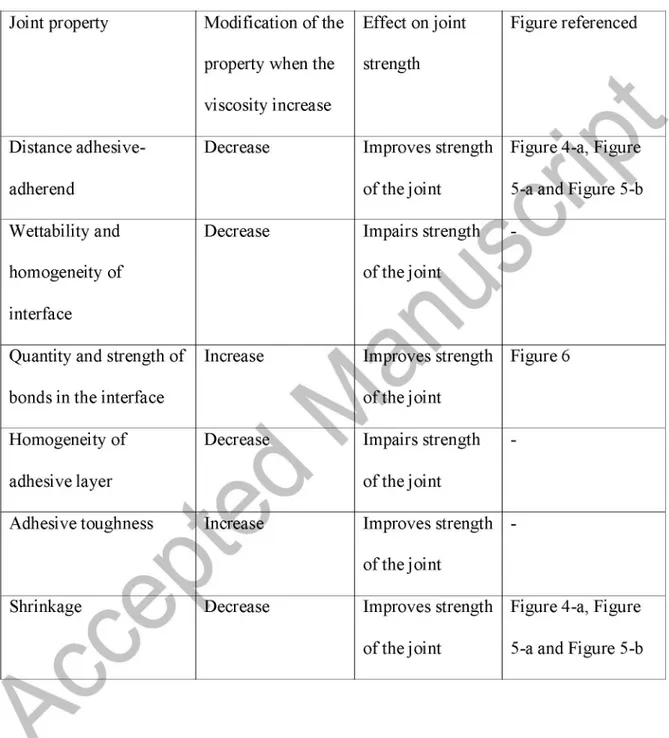
Table 2 summarizes how the increase of adhesive viscosity affects the different properties
modification in the adhesive properties may improve the final strength, or if otherwise
may negatively affect the joint.
Considering the way in which these properties are affected by the viscosity increase, the
results obtained can be discussed by dividing Part 2 (Figure 7) into two segments. On the first segment, the increase in the viscosity enhances the bond strength. This is due to the
decrease in the adhesive-adherend distance, improvement in the toughness of the adhesive, reduction of the shrinkage during curing, and the improvement in the quality, strength and uniformity of the chemical bonds. Adhesive penetration into the structure
created by the surface treatment is a very important issue to improve the durability of the adhesive joint [28]. Arrowsmith et al. [29] reached a similar conclusion working with
aluminum and toughened acrylic adhesives, indicating that to ensure good behavior of the joint, the adhesive must be selected so it can penetrate into the pores of the oxide layer. ea so it a
On the second segment, viscosity achieves an optimum point in which strength is maximized, and in which a further increase in the viscosity leads to a decrease in the
resistance. This«^ffe to the negative effect of the decrease in the wettability and in the homogeneity of the interface of the adhesive. This overrides the positive effects discussed above, and the increase in the viscosity starts to become negative for the strength of the
joint. In summary, the viscosity increase leads to less adhesive wettability, especially in the case of adherends with high roughness, and this phenomenon negatively affects the
In contrast, the increase in the viscosity as a consequence of the large neoprene content
has some positive effects for the adhesive joint. Some of these positive effects are the reduction in the adhesive shrinkage for high neoprene content adhesives, which in turn cause a lower distance between the adhesive and the adherend. The consequences are
stronger bonds due to chemical interactions and less breaking of the contact points formed, resulting in a better quality and quantity of interactions between adhesive
adherend in the interface.
,1C
ive andj
dhesive toughness
Moreover, the content in neoprene also improves the adhesive toughness, and this may
enhance the strength of the joint, especially in the case of rough adherends in which the surface morphology may induce stress concentration points in the adhesive [30].
The balance between positive effects and negative effects causes that, when the viscosity
is low, an increase in the viscosity leads to an improvement in thejoint strength (because the positive effects are stronger than the negative effects). On the contrary, when the
viscosity is high, an increase in the viscosity leads to a decrease in thejoint strength, mainly due to the poor wettability.
.0
poor -\
4. CONCLUSION
The mechanical test showed that below the optimal viscosity, the low neoprene content produces poor bond strength, mainly due to the high shrinkage during curing observed by SEM analysis of the interface adhesive-adherend. The shrinkage has a double effect on the final strength; on the one hand it leads to apparition of residual stresses, which weakens the interfacial strength. On the other hand, it causes separation between the ad hes iv e a „dad her e„d, wh l c h le ad s t oaPo or i„ter fa e , alc „ „taC t. ™S l s du et o t he
bonds formed before the contraction, and the weakness of the chemical interactions caused by a higher distance adhesive-adherend.
X 7
reduction of the number of contact points along the interface, the breakage of the bonds "actions i
<v
The reduced toughness of the adhesive with low neoprene content may also contribute to the low strength found in the adhesives with low viscosity. This is especially notable in the case of the rough adherends, due to an increment of stress concentration points that
facilitates the crack propagation. In the case of the adhesives with a viscosity above the optimal value, the measurements of contact angle corroborate that the reduction of the
joint strength is the result of an important decrease in the wettability. This poor
wettability is due to an insufficient spreading of the adhesive on the surface, this leads in a bad penetration of the adhesive into the surface microcavities which promotes the
formation of voids in the interface where the contact adhesive-adherend is poor and negatively affects to the interfacial strength. This effect is more pronounced in the case of
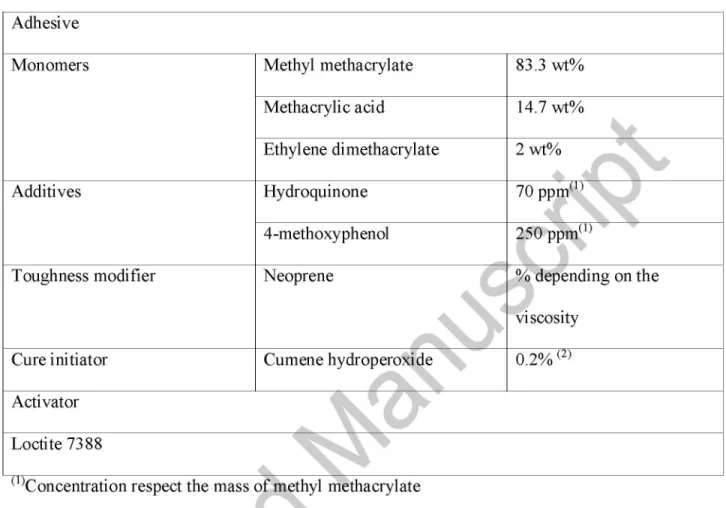
Table 1. Formulation used in the synthesis of the adhesive
Adhesive
Monomers Methyl methacrylate
Methacrylic acid
Ethylene dimethacrylate
83.3 wt%
14.7 wt%
2wt%
5fc
(i)
§
Additives Hydroquinone 70 ppm1
4-methoxyphenol ^ * p p m( 1 )
V t
Toughness modifier
Cure initiator
Neoprene
Cumene hydroperoxi ide 0.: g^Hepending on the
iscosity
.2% (2)
Activator
Loctite7388 ^
(1)Concentration respect the mass of methyl methacrylate
^Concentration respect the total mass of adhesive
Table 2. Summary of the effect of the viscosity increase over the different properties of
the adhesive and how this change may affect the strength of the joint
Joint property Distance adhesive-adherend Wettability and homogeneity of interface
Quantity and strength of bonds in the interface
Homogeneity of
adhesive layer
Adhesive toughness
Shrinkage
rV
Modification of the property when the
viscosity increase Decrease Decrease Increase Decrease
7
o
Increase DecreaseEffect on joint strength
Improves strength of the joint
Impairs strength
of the joint
Improves strength of the joint
Impairs strength
of the joint
Improves strength of the joint
Improves strength
of the joint
Figure referenced
Figure 4-a, Figure 5-a and Figure 5-b
v ir
sr
Figure 6
Figure 4-a, Figure
Figure 1
*<f
&
< *
S
Figure 2
- Viscosity — # - Surface Tension
30000
•- 20000
2sa
200 'g'
150 e
i
100 H 10 11 13 14 IS IE
N»prene(%)
e<f
&
< *
<f
Figure 3
Figure 6
*<f
&
< *
S
Figure 8
10.0
&• 9.0
9 8.5
750 95'J 1150 1350 1550
Viscosity (mP as)
e<f
&
< *