Comparative study of breakwater
crown wall – calculation methods
&1 Vicente Negro ValdecantosDCivEng
Associate Professor, Technical University of Madrid, Madrid, Spain
&2 Jose´ Santos Lo´pez Gutie´rrezDCivEng
Assistant Professor, Technical University of Madrid, Madrid, Spain
&3 Jose Ignacio Polvorinos Flors
Doctoral student, Technical University of Madrid, Madrid, Spain
1 2 3
An investigation was undertaken consisting of a state-of-the-art and comparative analysis of currently available methods for calculating the structural stability of wave walls in sloping breakwaters. A total of six design schemes are addressed. The conditions under which the formulations and ranges of validity are explicitly indicated by their authors, are given. The lack of definition in parameters to be used and aspects not taken into account in their investigations are discussed and the results of this analysis are given in a final table. An investigation proposal based on an energy approach, in which the transmission of waves incident on the porous medium and its effect on the wall face is studied, brings the discussion to its close.
Notation
Bu coefficient for calculating run-up
F width of the crown wall foundation
h half the wave height, wave height52h
hf height of wave wall
pH uniform horizontal pressure
Pra uplift pressure at the front of the crown
wall foundation
Pre uplift pressure at the extrados of the crown
wall foundation
PSo dynamic pressure
So width of the sheet of water ascending on the
slope at levelAc
Vh maximum horizontal velocity of the crest
wave
WL water level of the experimental set-up
Z vertical coordinate, positive in an ascending
direction (origin is at the design sea level)
1. Introduction
The wave wall has been a usual element in offshore works for decades, due to its great usefulness, especially in sloping breakwaters. It enables the elements in the armour layer to be reduced, reduces the possibility of the breakwater being
overtopped and, therefore, it improves the operability of the quays it protects, provides an access that may be used for maintenance work and the possibility of bringing in service systems. Installing a gallery from which to monitor the status and behaviour of the breakwater inside the wave wall started in recent decades.
Wave study has noticeably evolved with the passing of time. Statistical geometry and the evolution of recorders and measuring and prediction systems have brought advances in spectral analysis and consideration of wave energy, including the application of energy balances and effects of transmission and dissipation. Formulations available to determine the forces that waves produce on sloping breakwater wave walls do not explicitly embody these new energy criteria.
The aim of this study was to analyse and compare existing wave wall calculation methods, determining their ranges of application and detecting their uncertainties. This has led to a reflection on and proposal for new lines of investigation enabling the energy transmitted by waves onto the protection berm to be embodied.
Wave wall failure modes are
& overturning from wave action
& overturning from foot undermining
& foundation plasticisation
& point failure through hammer shock.
This paper addresses the first two modes of failure. Photo-graphs of recent failures are shown in Figures 1 to 3.
2. State of the art
Six methods for wave wall calculation are currently available. The notation used by the authors themselves in their respective papers has been retained and is defined in the text following the equations associated with each method.
Three give pressures as a result (Iribarren and Nogales,
Gu¨nbak and Go¨cke, Martı´n et al.) and the other three give
forces (Bradbury and Allsop, Pedersen and Burcharth, Berenguer and Baonza). Each one is briefly addressed herein; they are grouped by the type of result they obtain (forces or pressures).
2.1 Pressure diagrams
2.1.1 Iribarren and Nogales (1954)
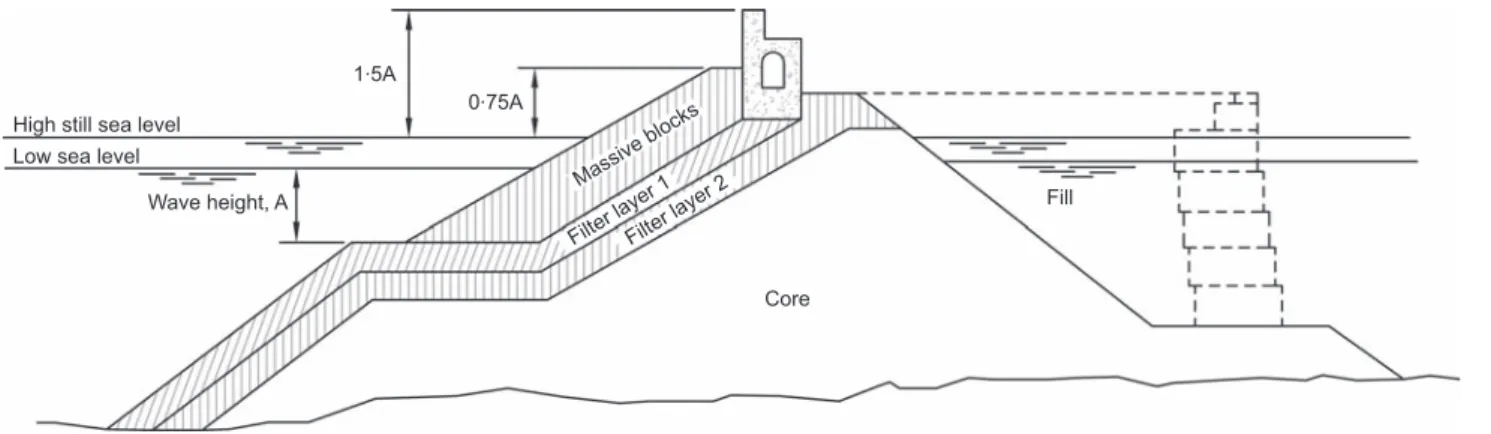
Iribarren and Nogales (1954) were the first to define the forces waves exert on the wave wall. Their work provides a pressure diagram as shown in Figure 4.
The representative height of the pressure at the crest is
1. EB~2V
2 h
2g~h
The representative height of the pressure at the trough is
2. JC~2V
2
2g~5h
The presence of rock fill reduces the pressure to half and the pressure law on the wave wall is defined by ABD (see Figure 4). The definitive law of pressures exerted by the wave would be the line ABH in Figure 4. It considers that the friction between
the base of the wave wall and the foundation is 0?50.
2.1.2 Gu¨nbak and Go¨cke (1984)
The model proposed by Gu¨nbak and Go¨cke (1984) assumes a uniform pressure distribution at the wave wall’s freeboard
Figure 1.Port of the island of Albora´n (southern Spain). Hammer shock failure in 2001
Figure 2.Port of Motril, Granada (southern Spain). Slide failure in 2004
which is called shock pressure (Pm). This figure is linearly reduced until reaching 50% at the base of the wave wall because of the presence of the protective layer. To this pressure
is added the hydrostatic pressure (Ph) corresponding to run-up.
The uplift pressure at the wave wall’s base is triangular, as shown in Figure 5.
3. Pm~
cw ffiffiffiffiffigy
p
2
2g ~
cw
2 y (shock pressure)
4. Ph~cwðyzsÞ (hydrostatic pressure)
5. y~ðRu{AcÞ
sina
sinb cosða{bÞ
The run-up is calculated with Gu¨nbak’s formulation (Gu¨nbak and Go¨cke, 1984), according to which
6. Ru~0:4jH if jv2:5 withj~
ffiffiffiffiffiffiffiffiffiffi
g 2pH
r
T tana
7. Ru~H ifjw2:5 withj~
ffiffiffiffiffiffiffiffiffiffi
g 2pH
r
Ttana
where Ac is the height of the protection berm (m); g is the
acceleration due to gravity (m/s2);His the wave height (m);Ruis
the run-up of the liquid vein (m);Tis the wave period (s);yis the
distance between the berm’s crown and the end of the run-up
(m);sis the stretch of wave wall protected by the armour layer
(m);ais the angle of the armour layer’s slope to the horizontal
(sexagesimal degrees); b is the angle the liquid vein forms
(Gu¨nbak gives it a value of 15 sexagesimal degrees); andcis the
specific weight of the water (kN/m3).
2.1.3 Martı´net al.(1995)
The method described by Martı´n et al. (1995) gives two
diagrams for pressures on the wave wall: thedynamic pressure
corresponds to the deceleration of the wave’s front and the
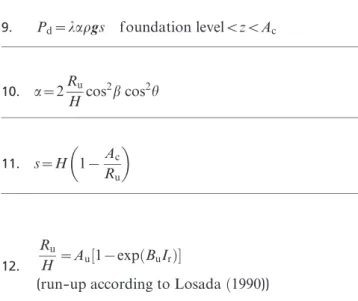
pseudohydrostatic pressure occurs during the descent of the mass of water accumulated on the structure. The pressures are as shown in Figure 6.
8. Pd~args AcvzvAczs C
B E
A
I D
H
G
1.5h J
M LSL HSSL
Hydrostatic pressures
pressures
Dynamic
2.5h
0.5h 0.5h
0.75A 1.25A
1.5A Crest
Trough
4h
5h F
Figure 4.Pressure distribution according to Iribarren and Nogales; HSSL, high still sea level; LSL, low sea level; wave height52h. Source: Negroet al.(2008)
0.5 Pm
Pm
Ph
Ph + 0.5 Pm
C
Z
y
9. Pd~largs foundation levelvzvAc
10. a~2Ru
H cos
2bcos2h
11. s~H 1{Ac
Ru
12. Ru
H ~Au½1{expðBuIrÞ
(run-up according to Losadað1990))
Thelparameter reduces the pressure due to the presence of the
armour layer. It is calculated with Figure 7, which was
obtained by means of reduced model tests. The Au and Bu
coefficients are those referred to in Table 1.
13.
Phð Þz~mrgðszAc{zÞ foundation levelvzvAczs
The value ofmis obtained from Figure 8.
The uplift pressures are calculated by following the condition of continuity at the foot located on the attack side. It indicates the following for the sheltered point.
& There is nil uplift pressure for the dynamic pressures if the foundation level is above high tide. If not, it will be calculated taking into account the buoyancy of the submerged part and the wave transmitted through the
porous medium (lPd).
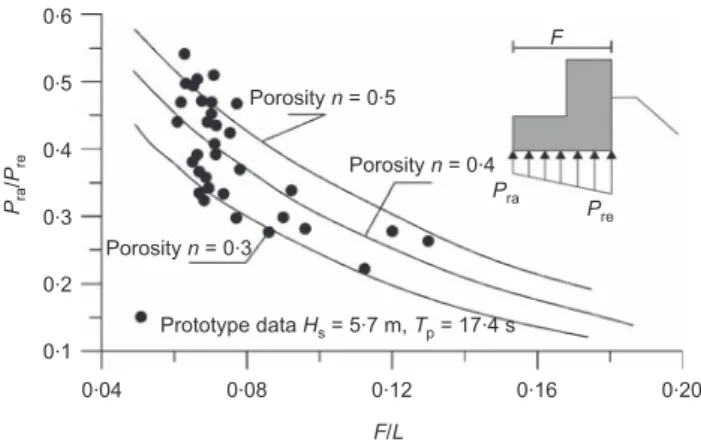
& In the case of pseudohydrostatic pressure, the uplift
pressure at the sheltered point is calculated according to a trapezoidal law on the side of safety as to a parabolic
pressure distribution, (Pra), according to the method
developed by Martı´net al.(1995) (Figure 9).
The notation is defined as:ais the non-dimensional parameter
containing information on the celerity of the mass of waters
wide at levelAc;bis the angle formed by the main armour layer
slope with the horizontal (sexagesimal degrees);lis the
non-dimensional parameter introducing the berm’s effect into the
pressures on the wave wall’s protected area; m is a
non-SWL
Pr
Pd = λPSo
Pd = PSo
λPSo or Pr
Zero or Pra
Z
F
B
Run-up water tongue
So
Ac
Figure 6.Pressure distribution according to Martı´net al.; SWL, low sea level. Source: adapted from Martı´net al.(1995)
0.6
λ
λ = 0.8e 0.5
0.4
0.3 0.7
0.2
0.09 0.07 0.05
B/L
(10.9 B/L)
0.03
0.03 < H/L < 0.075
0.01 0.11
Figure 7.Adjusted values ofl(Martı´net al.’s method.). Source: Negroet al.(2008)
Rip-rap Rock
fills Blocks Cubes Tetrapods Dolos
Au 1?757 1?37 1?152 1?05 0?93 0?70
Bu 20?435 20?60 20?667 20?67 20?75 20?82
Table 1.ParametersAuandBufor calculating run-up (Martı´net al.’s method). Source: Negroet al.(2008)
0.7
μ
0.6
nb = B/le
nb =1
nb =2
nb =3 0.5
0.4 0.8
0.3
0.2
0.07 0.06 0.05 0.04
H/L 0.03
0.02 0.08
dimensional parameter less than 1;ris the sea water density
(kN.s2/m4) such that rg~cw(kN=m3); A
c is the level of the
rock fill or block berm’s crown (m);Bis the width of the rock
fill or block berm (m);dis the depth (m);gis the acceleration
due to gravity (m/s2) such thatrg~cw(kN=m3);His the design
wave height (m);Hbis the height of breaking wave (m);Hsis
the height of significant wave (m);Iris the Iribarren number in
deep water conditions;Lis the length of design wave (m);Ieis
the equivalent side of the main armour layer’s units (m);Pbis
the pseudohydrostatic pressure (kN/m2); P
d is the dynamic
pressure (kN/m2); Ra is the run-up, namely the maximum
ascent of the sheet of water on the slope, an undefined case (m);
sis the width of the sheet of water ascending on the slope at
levelAc (m);Tis the design wave period (s); Tp is the peak
period (s); andz is the vertical coordinate with its origin at
design sea level and positive in an ascending direction (m).
The dynamic and pseudohydrostatic pressures are not added up for calculating the wave wall’s stability but each is separately dealt with and the sliding and overturning safety coefficients are obtained for each using the Goda criterion (Goda, 1985).
2.2 Force diagram
2.2.1 Bradbury and Allsop (1988)
This method starts from Jensen’s work (Jensen, 1984) and
determines the maximum horizontal forceFHon the wave wall.
Jensen does not give a specific equation but, based on test results, points out that there is a practically linear relationship between two factors
. FH
cwhbLP
and HS Dh
whereFH is the maximum horizontal force (kN/m);cwis the
specific weight of sea water (kN/m3);his the height of the wall
(m);bis the width of the wall (m);Lpis the peak period wave
length (m); HS is the significant wave height (m); Dh is the
vertical distance from still-water to the crest of the armour layer (m).
Bradbury and Allsop (1988) propose the following equation from the foregoing
14. FH
rghfLp
~aHS
Ac {b
whereFHis the maximum horizontal force (kN);r is the sea
water density (kN.s2/m4);
gis the acceleration due to gravity
(m/s2), such thatrg~c
w(kN=m3);hfis the height of wave wall
(m);Lpis the peak period wave length (m);HSis the significant
wave height (m);ACis the protection layer crown height (m);
anda,bare empirical coefficients as shown in Figure 10.
It assumes a rectangular horizontal pressure distribution to obtain an estimate on the side of safety
15. pH~FH=hf ðuniform horizontal pressureÞ
The maximum vertical pressure coincides with the maximum horizontal. It takes up a triangular distribution having the maxi-mum value at the front and reduces linearly to zero in the extra-dos with which the maximum vertical force is
16. FV~rgBcLp=SðaHS=Ac{bÞ
whereSis a safety factor andBcis the width of the crown wall.
The method proposes a coefficient of frictionmwith a value of
0?50 for calculating the wave wall’s stability. This is the method
proposed by CIRIA-CUR (1991).
2.2.2 Pedersen and Burcharth (1992)
The horizontal force is obtained from the pressure records by spatial integration. The study confirms the investigations provided by Jensen, explained in the foregoing section. The equation proposed by Pedersen and Burcharth is as follows
17. Fh,0:1% rghfLp
~a HS
Ac zb
where:Fh,0?1%is the horizontal force associated with a surplus of
0?1% (kN);ris the water density (kN.s2/m4);
gis the acceleration
due to gravity (m/s2), such thatrg~cw(kN=m3);h
fis the height
of wave wall (m);Lpis the peak period wave length (m);HSis the
significant wave height (m);Ac is the protection layer’s crown
height (m); and a, b are non-dimensional coefficients to be
determined with specific tests. 0.1
0.5 0.6
0.4
0.3
Porosity n = 0.3
Prototype data Hs = 5.7 m, Tp = 17.4 s
Porosity n = 0.5
Porosity n = 0.4
Pra /Pre
Pra
F
Pre
0.2
0.20 0.16
0.12
F/L 0.08
0.04
2.2.3 Berenguer and Baonza (2006)
Determining forces on a wave wall calls for calculating the run-up according to the formulation indicated in the method proposed by Berenguer and Baonza (2006)
18. Ru2%~0:86j0 :54 p HSch
whereRu 2%is the ascent of the sheet of water exceeded by 2%
of the waves (m);Hsis the significant wave height (m);jpis the
Iribarren number referring to the length of wave associated
with the peak period; andchis the obliqueness factor according
to De Waal’s criterion (De Waalet al., 1996).
2.2.3.1HORIZONTAL FORCE
19. FX~cwh0 :5 h L1
:5
p a
Ru2%
A2c=3B1=3 zb
!
if ðRu2%wRcÞ
20.
FX~cwðRu2%{WcÞ0 :5
|L1:5
p a
Ru2%
A2c=3B1=3 zb
!
if ðRu2%ƒRcÞ
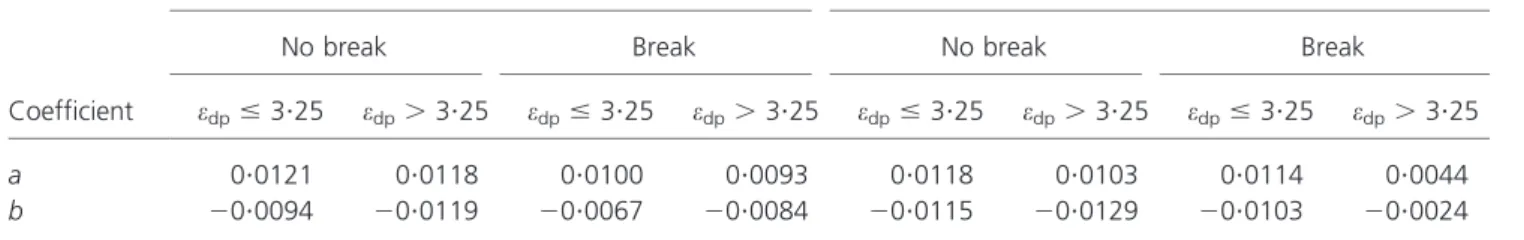
The a and b coefficients of the foregoing equations are
obtained from Table 2.
2.2.3.2VERTICAL FORCE (UPLIFT PRESSURE)
21. FY~cwh0 :5 h L1
:5
p a
Ru2%{Wc
A2c=3B1=3 zb
!
ifðRu2%wRcÞ
22.
FY~cwðRu2%{WcÞ0 :5
|L1:5
p a
Ru2%{Wc
A2c=3B1=3 zb
!
ifðRu2%ƒRcÞ
The a and b coefficients of the foregoing equations are
obtained from Table 3.
If a wave wall with a base F is considered, the total uplift
pressure will be
23. FYT
~FYzFY
~FYz0:017Lp{0:109FF{0:043Lp
2.2.3.3MOMENT DUE TO THE HORIZONTAL FORCE
24. MX~cwhfL2p a
FX
cwh0:5 f L1
:5 p
zb !
if ðRu2%wRcÞ
Coefficient
Massive concrete blocks Natural rock
No break Break No break Break
edp#3?25 edp.3?25 edp#3?25 edp.3?25 edp#3?25 edp.3?25 edp#3?25 edp.3?25
a 0?0121 0?0118 0?0100 0?0093 0?0118 0?0103 0?0114 0?0044
b 20?0094 20?0119 20?0067 20?0084 20?0115 20?0129 20?0103 20?0024
Table 2.Coefficients for calculating horizontal force (Berenguer and Baonza’s method). Source: Negroet al.(2008)
Coefficient
Massive concrete blocks Natural rock
No break Break No break Break
edp#3?25 edp.3?25 edp#3?25 edp.3?25 edp#3?25 edp.3?25 edp#3?25 edp.3?25
a 0?0015 0?0004 0?0001 0?0014 0?0024 0?0014 0?0016 0?0001
b 0?0020 0?0028 0?0037 0?0017 0?0013 0?0012 0?0025 0?0034
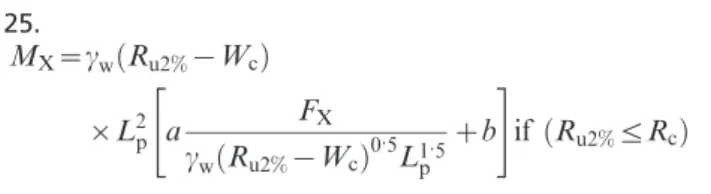
25.
MX~cwðRu2%{WcÞ |L2
p a
FX
cwðRu2%{WcÞ0 :5
L1:5 p
zb
" #
if ðRu2%ƒRcÞ
The a and b coefficients of the foregoing equations are
obtained from Table 4.
2.2.3.4MOMENT DUE TO THE VERTICAL FORCE (UPLIFT PRESSURE)
26.
MYT~FY F{0:018Lp
z
FYT{FY
ð Þ
| 0:046Lp{0:217F
0:102Lp{0:651F
F{0:043Lp
whereFXis the horizontal force exerted by waves on the wave
wall (kN);FYTis the vertical force (uplift pressure) exerted by
waves on the wave wall (kN); MX is the moment due to
horizontal force (kN.m); MY is the moment due to vertical
force (uplift pressure) (kN.m);cwis the specific weight of water
(kN/m3);Wcis the wave wall’s foundation level as to sea level
(m);Rcis the wave wall’s crown level as to sea level (m);Lpis
the wave length at foot of breakwater as to peak period (m);Ac
is the berm crown level as to sea level (m);Bis the width of
crown berm (m);hfis the height of the wave wall (m); tgais the
tangent of the armour layer slope angle with the horizontal;
andhis the waves’ angle of incidence (sexagesimal degrees).
3. Critical analysis of the methods
The foregoing methods have their ranges of use and application. They have been generally obtained under laboratory conditions, which should be borne in mind to be able to properly interpret the results. The peculiarities of each method as taken from the pertinent investigations are discussed hereafter. The analysis is carried out in a chronological order to observe the variation of the parameters used in the calculations in time.
3.1 Iribarren and Nogales (1954)
& The method proposed by Iribarren and Nogales (1954) stands out for being the first wave wall calculation method.
It dates from 1954 and no other alternative calculation method appeared until 1984 (Gu¨nbak and Go¨cke, 1984).
& The breakwater on which the pressures indicated are applied corresponds to a specific geometry recommended by
Coefficient
Massive concrete blocks Natural rock
No break Break No break Break
edp#3?25 edp.3?25 edp.3?25 edp.3?25 edp#3?25 edp.3?25 edp#3?25 edp.3?25
a 0?113370 0?109490 0?119270 0?062150 0?123997 0?096651 0?121971 0?071884
b 0?000190 20?000080 0?000040 0?000060 20?000002 20?000067 20?000072 0?000008
Table 4.Coefficients for calculating the moment of the horizontal force (Berenguer and Baonza’s method). Source: Negroet al.(2008)
6.0
35
Regular concrete blocks
Rounded stones 1–7 t Quarry stones 6–9 t
Quarry run
Quarry run 0–0.5 t
Rock armour
Rock armour
Rock armour 10.9
21.0
h1 = 16.7
h1 = 3.0
0.00
0.054
a b
0.032
0.025 0.015
0.043 0.038
0.036 0.031
0.013 0.011 –4.95
–9.0
–3.0
Section A
Coefficients in equation
Section B
Section C
Section D
Section E 2
1
2 1
Figure 10.Values of empirical parameters according to geometries tested for the Bradbury and Allsop method. Source: Negroet al.
Iribarren and Nogales. Applying the method for another type of geometry would not be recommendable. The geometry Iribarren and Nogales indicate is that as repre-sented by Figure 11. The method requires the waves to arrive at the wave wall broken, whether because they are broken when incident on the breakwater or because they break on the armour layer’s slope.
& It only indicates horizontal pressures and does not specify the uplift pressures appearing on the wave wall with a wave
height ofA51?25H, whereH52h.
& It poses passing pressures that represent the horizontal speed of the wave crest and dynamic pressures corre-sponding to the fall of molecules into the trough. The resulting horizontal pressure is the sum of them both.
& The block layer located in front of the wave wall reduces the total pressures 50%.
& The parameters intervening do not include the length of the
protection berm located facing the wave wall. It does not assess the influence of the number of units in the armour layer facing the wall on reducing pressure.
& It does not indicate the wave height to be considered in the
calculation (H1/250,H2%,HS,H1/10).
3.2 Gu¨nbak and Go¨cke (1984)
& Gu¨nbak and Go¨cke (1984) devised this procedure in order to calculate ‘wave screen’ type structures. Nevertheless, it does not specify the range of validity or application.
& In the tests on which it is based, waves break before becoming incident on the wave wall.
& The authors point out that the method has been thought up
to be applied in Mediterranean ports. This aspect is relevant since each sea behaves differently and is not entirely picked up by the Gu¨nbak and Go¨cke method parameters, such as
Massive blocks Filter layer 1Filter layer 2
1.5A
Wave height, A High still sea level
Low sea level
0.75A
Core
Fill
Figure 11.Typical breakwater cross-section according to Iribarren and Nogales. Source: Negroet al.(2008)
0.33 0.3 0.27 0.24 0.21 0.18
5 4
3 0
6 0.36
Fh, 0
. 1%
: N/m
m No. d0.50
fixed WL = 0.55 m
fixed Tp = 1.6 s
HS = 0.10 m
HS = 0.14 m
HS = 0.18 m
400
300
200
100 500
Figure 12.Influence of the berm’s width on the total horizontal force on the wave wall according to Pedersen and Burcharth. Source: adapted from Pedersen and Burcharth (1992)
0.0 3.0
2.0
1.0 4.0
Application area
B
/H
0.5
–0.5 –0.0 1.0
Ac/H
–1.0
the wave length and number of waves (a particularly relevant factor in breakwaters as made patent in Van der Meer’s equation (Van der Meer, 1993). Applying it to ports located in other masses of water, the North Atlantic for example, should be previously studied.
& There are two pressures: shock and hydrostatic. The
resulting pressure is the sum of them both.
& It considers that the existence of a berm facing the wave
wall reduces the shock pressure at the foot of the wall 50%. This reduction is gradual, with no leap.
& It does not define the wave height which has to be used nor
to what location the Iribarren number refers, which is that used to calculate run-up and pressures.
& It carries out a number of tests on eight different
cross-sections, though with the same slope (1V/2H). Nevertheless,
the actual ports where it contrasts the results (Tripoli and
Antalya) have slopes of 1V/1?5Hand 1V/2?5H.
& Based on the tests, it concludes that there should be at least three units of the armour layer facing the wave wall in order to be able to consider the 50% reduction in the impact pressures. The length of the armour layer located facing the wave wall does not intervene in the formulation and it is
4.50 5.00
+15.50
+11.00
+6.00 +4.00
+6.00 +10.50
Concrete
Rock armour Rock armour > 45 t
3.00 7.00
HSSL +5.00
LSL +0.00
1.5 1
1.5 1
1.25 2.00
–15.00 1
Core
Filter 350 kg
Figure 14.Mutriku new breakwater section S-3 (dimensions and elevations in m); HSSL, high still sea level; LSL, low sea level
181.82 –18.00
–14.30 1
1.75
1
1.75 HSSL +1.00
10.00
3 2 –14.00
–16.10
–20.00 LSL +0.00
5. 70 +7.0
2.00 Rock armour 1 t
Rock armour > 2 t
Rock armour > 4 t
Rock armour 1 t
Concrete slab Concrete blocks 40 t
15.22 12.00
+11.00
+3.00
–5.00
–22.00 Core
7.17
Filter
Filter
23
therefore assumed that it must always be equal to the length equivalent to three units of the armour layer.
3.3 Bradbury and Allsop (1988)
& The method proposed by Bradbury and Allsop (1988) is based on Jensen’s investigations.
& The formulation offers the horizontal force as the result.
From there it passes to horizontal pressure, adopting a uniform pressure distribution over the whole height of the wave wall, and to uplift pressures, assuming a triangular distribution although it indicates that rectangular should be taken to be on the side of safety. It is supposed, with these pressures, that the arms of the forces would be obtained in order to calculate the moment, but no specification is given.
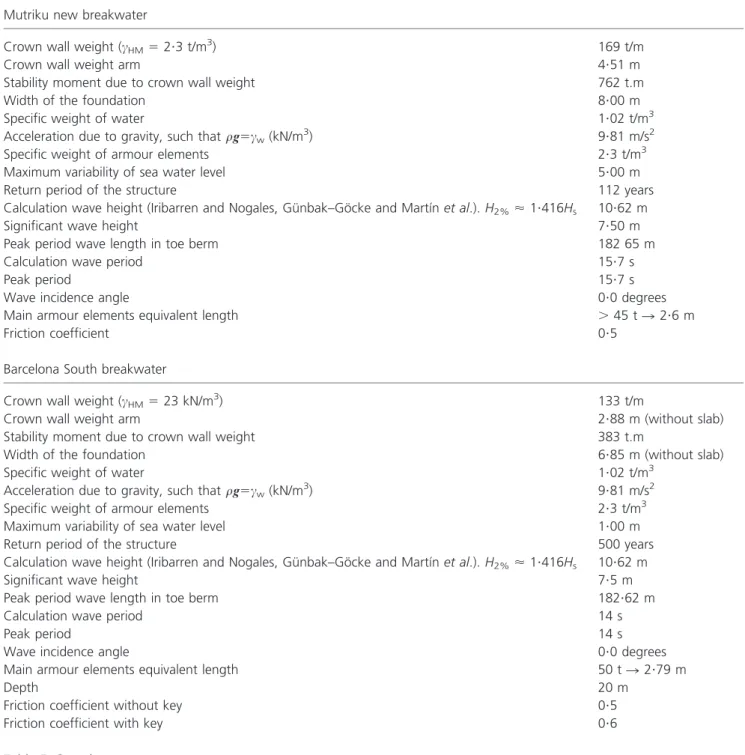
Mutriku new breakwater
Crown wall weight (cHM52?3 t/m3) 169 t/m
Crown wall weight arm 4?51 m
Stability moment due to crown wall weight 762 t.m
Width of the foundation 8?00 m
Specific weight of water 1?02 t/m3
Acceleration due to gravity, such thatrg5cw(kN/m3) 9?81 m/s2
Specific weight of armour elements 2?3 t/m3
Maximum variability of sea water level 5?00 m
Return period of the structure 112 years
Calculation wave height (Iribarren and Nogales, Gu¨nbak–Go¨cke and Martı´net al.).H2%<1?416Hs 10?62 m
Significant wave height 7?50 m
Peak period wave length in toe berm 182 65 m
Calculation wave period 15?7 s
Peak period 15?7 s
Wave incidence angle 0?0 degrees
Main armour elements equivalent length .45 tR2?6 m
Friction coefficient 0?5
Barcelona South breakwater
Crown wall weight (cHM523 kN/m3) 133 t/m
Crown wall weight arm 2?88 m (without slab)
Stability moment due to crown wall weight 383 t.m
Width of the foundation 6?85 m (without slab)
Specific weight of water 1?02 t/m3
Acceleration due to gravity, such thatrg5cw(kN/m3) 9?81 m/s2
Specific weight of armour elements 2?3 t/m3
Maximum variability of sea water level 1?00 m
Return period of the structure 500 years
Calculation wave height (Iribarren and Nogales, Gu¨nbak–Go¨cke and Martı´net al.).H2%<1?416Hs 10?62 m
Significant wave height 7?5 m
Peak period wave length in toe berm 182?62 m
Calculation wave period 14 s
Peak period 14 s
Wave incidence angle 0?0 degrees
Main armour elements equivalent length 50 tR2?79 m
Depth 20 m
Friction coefficient without key 0?5
Friction coefficient with key 0?6
& It defines the wave height and wave length to be used in the calculations.
& The formulation has empirically obtained parameters that depend on the geometry of the berm and the filter and it is therefore assumed that all the peculiarities of those elements are taken into account. The reference coefficients for cases which do not match the cross-sections indicated would have to be obtained.
& The breakwater cross-sections have a 1V/2H slope. It points out that this slope usually takes a more unfavour-able run-up.
& The formula does not show the armour layer’s width. Nevertheless, the cross-sections in Figure 10 show the following: section A shows a filter of 6 to 9 t, which indicates that the armour layer must be formed by blocks between 60 and 140 t. This section encloses a berm distance of 6 m, which allows two blocks, not three, to be placed. Sections C, D and E show a berm with a width
corresponding to three units.
& It does not include any reduction in horizontal pressures because of the existence of an armour layer facing the wave wall.
3.4 Pedersen and Burcharth (1992)
& The Pedersen and Burcharth (1992) method calculates the
horizontal force with a surplus of 0?1% obtained by
integrating the pressures recorded in laboratory tests. This
formula has to be adjusted with theaandbparameters.
& The tests carried out hardly have any overtopping and the calculation method is therefore more reliable in breakwaters displaying a low overtopping rate.
& It is a formulation that is very similar to Bradbury and Allsop’s. It does not pretend to be a new equation but confirms that given by Jensen (1984).
& It observes that the influence of the berm’s width on the intensity of the pressures is low, as shown in Figure 12.
& It assumes that most of the load is due to hydrostatic pressure.
& It does not say how to calculate the vertical force to be considered.
& The empirical a and b parameters it introduces into the equation show the characteristics of the berm and the filter, the same as the Bradbury and Allsop (1988) method. However, these parameters have to be determined in laboratory tests. It does not provide predetermined values as in Bradbury and Allsop’s method.
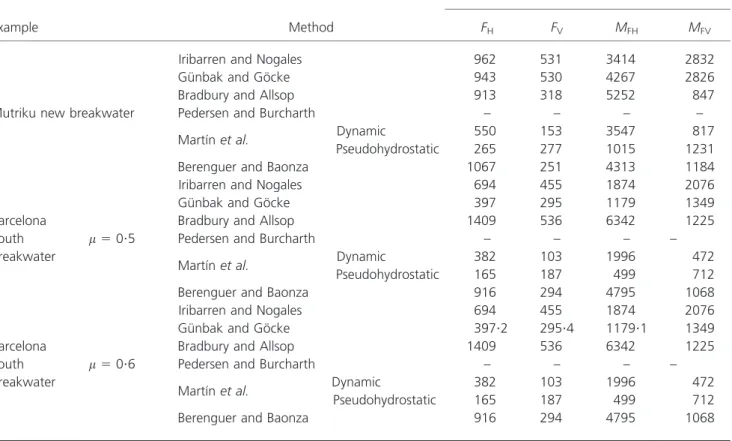
Example Method
Loads
FH FV MFH MFV
Mutriku new breakwater
Iribarren and Nogales 962 531 3414 2832
Gu¨nbak and Go¨cke 943 530 4267 2826
Bradbury and Allsop 913 318 5252 847
Pedersen and Burcharth – – – –
Martı´net al. Dynamic 550 153 3547 817
Pseudohydrostatic 265 277 1015 1231
Berenguer and Baonza 1067 251 4313 1184
Barcelona South breakwater
m50?5
Iribarren and Nogales 694 455 1874 2076
Gu¨nbak and Go¨cke 397 295 1179 1349
Bradbury and Allsop 1409 536 6342 1225
Pedersen and Burcharth – – – –
Martı´net al. Dynamic 382 103 1996 472
Pseudohydrostatic 165 187 499 712
Berenguer and Baonza 916 294 4795 1068
Barcelona South breakwater
m50?6
Iribarren and Nogales 694 455 1874 2076
Gu¨nbak and Go¨cke 397?2 295?4 1179?1 1349
Bradbury and Allsop 1409 536 6342 1225
Pedersen and Burcharth – – – –
Martı´net al. Dynamic 382 103 1996 472
Pseudohydrostatic 165 187 499 712
Berenguer and Baonza 916 294 4795 1068
FH, horizontal force (kN/m);FV, vertical force (kN/m);MFH, instability moment associated withFH(mkN/m);MFV, instability moment associated withFV(mKN/m).
3.5 Martı´net al.(1995)
& The Martı´n et al. (1995) method gives two pressures: a dynamic one (due to the deceleration of the wave’s front) and a pseudohydrostatic one (due to the descent of the mass of water accumulated on the structure). It does not consider them to be concomitant, and, therefore, they are not added together and it studies the wave wall’s stability in each case separately. It is the only calculation method operating in this way. The vertical pressure is parallelepiped or triangular depending on whether it is due to dynamic or pseudohy-drostatic pressures.
& The methodology is applicable while the following condi-tions are fulfilled
(a) waves reach the wave wall either broken or in run-up
(b) the angle of incidence may be up to¡20 sexagesimal
degrees
(c) must be inside the application region marked in Figure 13.
& It is an exhaustive method that considers a large number of factors not taken into account in the other procedures or included together with others in empirical parameters.
& It does not clearly define the wave height, wave length or period to be used in the calculation, and it is not known
whetherH2%,HS,H1/10,Hmaxare involved.
& It considers a reduction in horizontal pressures, both dynamic and pseudohydrostatic, in the part protected by an armour
layer. A coefficient of reduction (l) is applied in the dynamic
ones that depends on the armour layer’s width. The pseudohydrostatic pressures have a coefficient of reduction
(m) that depends on the number of units in the armour layer. It
therefore assesses the length of the rock layer. The graphs
where these coefficients are obtained give values close to 0?50.
It considers the reduction in horizontal pressures with one or two units in the armour layer, unlike the indications of Gu¨nbak–Go¨cke and Pedersen–Burcharth, who only consider the reduction in pressures as from three units.
& TheAuandBuparameters necessary to calculate the run-up display incoherence in the values adopted for cubes and blocks. A lesser run-up is obtained with the values for the cube-type elements than with the block-type elements. It should be the opposite since cubes break the sheet of water less and they also shore up, presenting a smoother surface and, therefore, increasing the run-up figure.
Example Method
Stability analysis
CSD CSV
Mutriku new breakwater
Iribarren and Nogales 0?60 1?40
Gu¨nbak and Go¨cke 0?61 1?12
Bradbury and Allsop 0?75 1?29
Pedersen and Burcharth – –
Martı´net al. Dynamic 1?40 1?92
Pseudohydrostatic 2?66 6?30
Berenguer and Baonza 0?67 1?49
Barcelona South breakwater
m50?5
Iribarren and Nogales 0?63 0?94
Gu¨nbak and Go¨cke 1?30 2?11
Bradbury and Allsop 0?28 0?41
Pedersen and Burcharth – –
Martı´net al. Dynamic 1?60 1?68
Pseudohydrostatic 3?46 6?26 Berenguer and
Baonza 0?56 0?58
Barcelona South breakwater
m50?6
Iribarren and Nogales 0?76 0?94
Gu¨nbak and Go¨cke 1?56 2?11
Bradbury and Allsop 0?34 0?41
Pedersen and Burcharth – –
Martı´net al. Dynamic 1?93 1?68
Pseudohydrostatic 4?15 6?26
Berenguer and Baonza 0?68 0?58
CSD, sliding safety coefficient; CSV, overturning safety coefficient.
& Thelandmparameters are obtained for 120 t blocks since they are calculated as from the data-taking campaign on the Prı´ncipe de Asturias breakwater in Gijo´n.
& As indicated in the foregoing point, the method has been proven for the Prı´ncipe de Asturias breakwater, which is not completely representative due to the peculiar cross-section thereof since the wave wall is built and has foundations directly on the core, formed by 90 t blocks with a high gap index between them. It is not the classic wave wall foundation.
3.6 Berenguer and Baonza (2006)
& The Berenguer and Baonza (2006) method obtains horizontal and vertical pressure laws with tests with irregular waves. Using these pressures, it calculates the horizontal and vertical force as well as the moments associated with each one.
& It has been contrasted with numerous actual cases located
along the whole Spanish coast.
& The waves do not break in all the tests carried out until reaching the breakwater.
& The method for calculating the forces on the wall is designed for the case of the breakwater armour layer’s elements being natural rock or cubes. The run-up intervenes in this calculation with its own formulation obtained from tests with cross-sections where perforated cubes and perforated antifers are used.
& Some blocks in the armour layer were deliberately placed in the tests relating to forces on the wave wall with a certain displacement to reflect the actual state of a breakwater that has withstood storms throughout its useful life.
4. Example structures
The six methods related have been applied to three example structures
& Mutriku new breakwater (Guipu´zcoa) (Figure 14)
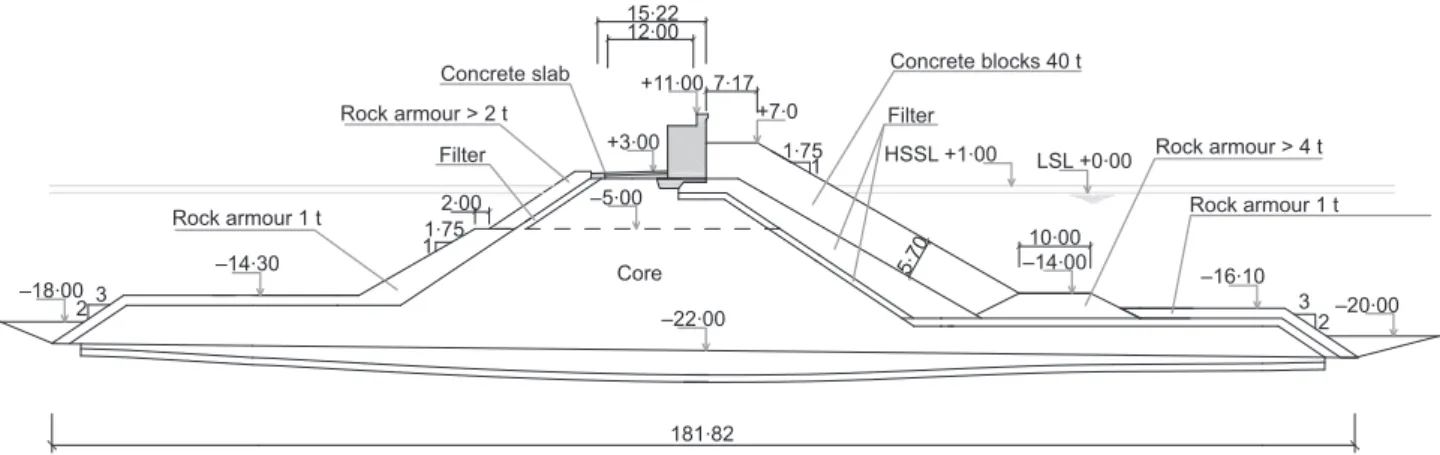
& Barcelona South breakwater (Figure 15) with key
& Barcelona South breakwater (Figure 15) without key
The case data are presented in Table 5 and results obtained are given in Tables 6 and 7. These results are also shown graphically in Figures 16 to 22.
Results obtained show that the sections given do not fit in the sections defined by Bradbury and Allsop. Quite different results were obtained depending on the section chosen. Section A was chosen for the calculations shown in Tables 6 and 7.
Wave actions were first calculated for each of the methods shown. Coefficients of sliding and overturn stability were calculated with the results.
In general, a high dispersion in results can be observed.
In the Mutriku example the following characteristics were observed.
& Horizontal forces have similar values in all methods except in
Martı´net al.’s, which gives less forces. The moment
associated presents more variation depending on the method.
& Vertical forces present more dispersion than horizontal
ones. Moments associated have even more dispersion.
& Iribarren and Nogales’ is the most conservative method.
New methods give more accurate actions because, on 0
200 400 600 800 1000 1200
kN/ml
1
1 _ Horizontal force 2 _ Vertical force
2
Günbak and Göcke
Bradbury and Allsop
Berenguer and Baonza
Martín et al. Dynamic
Martín et al. Pseudohydrostatic Key (left to right) Iribarren and Nogales
Figure 16.Mutriku new breakwater – forces
0 1000 2000 3000 4000 5000 6000
m.kN/ml
Key (left to right)
1 2
Iribarren and Nogales
Günbak and Göcke
Bradbury and Allsop
Berenguer and Baonza
Martín et al. Dynamic
Martín et al. Pseudohydrostatic
1 _ Instability moment associated with FH
2 _ Instability moment associated with FV
Figure 17.Mutriku new breakwater – instability moments
1 2 3 4 5 6
0 7
Security coefficient
1 2
Günbak and Göcke
Bradbury and Allsop
Martín et al. Dynamic
Martín et al. Pseudohydrostatic Berenguer and Baonza
1 _ Sliding security coefficient
2 _ Overturning security coefficient
Key (left to right) Iribarren and Nogales
including more calculation parameters, the results are more particularised to the specific study case.
In the Barcelona South breakwater, the following character-istics can be observed.
& There is a high dispersion in horizontal and vertical forces.
& As far as the stability calculation is concerned, methods have a different sensitivity to a variation in the friction coefficient.
& Recent methods (Martı´net al.and Berenguer and Baonza) do not give similar results.
5. Proposal for a new formulation
Methods currently used to determine wave actions on a wave wall are based on geometric and wave criteria. The existing formulations do not embody the waves’ energy treatment.
This is the reason why a study is envisaged on a new formulation in which the incident waves on the wall intervene in the form of energy transmitted through the porous medium which is the armour layer, determining the diagram of pressures above the block berm in the case of run-up and the dissipated one through the units making up the slope. The first schemes used employ the
DELOS (Burcharthet al., 2007) formulae for transmission and
run-up and pressure adjustments with rectangular laws above the berm of protection units.
6. Conclusions
The following conclusions may be drawn in the light of these state-of-the-art review analyses.
& All methods are based on more or less extensive laboratory tests except for Iribarren and Nogales’ which, on the other hand, is very old.
& The tests on which the methods analysed are based cover a broad series of states of the sea (significant wave height, periods and so on) although the same does not apply for the geometry of the armour layer’s crown, such that the slopes
considered are of only two types: 1V/1?5Hor 1V/2Hand the
range of the number of armour layer units is limited except
in Martı´net al.(Table 8). This leads to the application of a
method to slopes that largely diverge from those used in the tests on which those methods are based, possibly giving rise to erroneous results. The same occurs in those cases where the actual geometry cannot be fitted into that of the profile tested and the coefficients obtained therefrom (the case of Bradbury and Allsop). In such a case, reduced scale tests have to be carried out (the case of Pedersen and Burcharth), and this involves a high cost due to the formulations for
0 1 2 3 4 5 6 7 1 2
Security coefficient
Günbak and Göcke Bradbury and Allsop
Martín et al. Dynamic
Martín et al. Pseudohydrostatic
1 _ Sliding security coefficient
2 _ Overturning security coefficient
Berenguer and Baonza Key (left to right) Iribarren and Nogales
Figure 22.Barcelona South breakwater – safety coefficients (m50?6)
1 2 0 200 kN/ml 400 600 800 1000 1200 1400 1600
1 _ Horizontal force
2 _ Vertical force
Günbak and Göcke
Bradbury and Allsop
Martín et al. Dynamic
Martín et al. Pseudohydrostatic Berenguer and Baonza Key (left to right) Iribarren and Nogales
Figure 19.Barcelona South breakwater – forces
0 1000 2000 3000 4000 5000 6000 7000 1 2 m·kN/ml
1 _ Instability moment associated with FH
2 _ Instability moment associated with FV
Günbak and Göcke
Bradbury and Allsop
Martín et al. Dynamic
Pseudohydrostatic Berenguer and Baonz Martín et al. Key (left to right) Iribarren and Nogales
Figure 20.Barcelona South breakwater – instability moments
0 1 2 3 4 5 6 7 1 2 Se c u ri ty coefficient
Günbak and Göcke Bradbury and Allsop
Martín et al. Dynamic
Martín et al. Pseudohydrostatic Berenguer and Baonza
1 _ Sliding security coefficient
2 _ Overturning security coefficient
Key (left to right) Iribarren and Nogales
Iribarren and Nogales
Gu¨nbak– Go¨cke
Bradbury– Allsop
Pedersen– Burcharth
Martı´n
et al.
Berenguer– Baonza
Year published 1954 1984 1988 1992 1995 2006
Test based on:
Waves No Regular – – In situ
measured campaigns (Gijo´n)
Irregular JONSWAP
Slope No Run-up with
5V/2H
Pressures with 1V/2H
1V/2H 1V/1?5H 1V/1?5H Run-up with 1V/1?5Hand 1V/2H
Forces with 1V/1?5H
Armour layer units
No Rock fill Rock fill and blocks as per figures
Unspecified Rock fill, cubes, tetrapods, quadrapods, tribar and dolos
Run-up with cubes and perforated antifers. Forces with blocks and rock fill Formulation
in:
Horizontal pressures
Horizontal and vertical pressures
Horizontal and vertical forces
Horizontal forces
Horizontal and vertical pressures
Horizontal and vertical forces with their respective moments
Criteria Geometric and
undulatory
Geometric and undulatory
Geometric and undulatory
Geometric and undulatory
Geometric and undulatory
Geometric and undulatory Variables
intervening
Wave wall height X X X X X X
Width of wave wall foundations
X X X - X X
Height of emerged berm
X X X X X X
Width of emerged berm
– – – – X (in the
form of no. of units)
X
Slope angle – X – – X X
Wave height X X Significant
wave height
Significant wave height
X Significant wave height
Period – X – – X Average and
peak periods
Wave length – – X (referring to
the peak period)
X (referring to the peak period)
X X (at foot of breakwater referring toTp andTm)
pre-sizing the wave wall while tests allow the design to be optimised. Numerous systematic tests would need to be performed in order to increase the number of cases and obtain the adjustment parameters.
& Some methods do not offer equations for all the actions
necessary to calculate the wave wall’s stability (Table 8); Iribarren and Nogales do not indicate the uplift pressure distribution; Bradbury and Allsop adopt a triangular uplift pressure as an approximation from which they obtain the vertical force, but they say that a rectangular distribution on the side of safety may also be taken; and Pedersen and Burcharth only determine the horizontal force.
& In some cases, there is a lack of definition in the undulatory parameters to be used in the calculations.
& The methods do not include all characteristics in the formulations that determine the breakwater. The most
complete in this aspect are those of Martı´net al.and
Berenguer and Baonza.
7. Recommendations
& The engineer must bear in mind that there is a heavy dispersion of results between methods and it is therefore advisable to use more than one method to determine results coming closer to reality.
& Studies by Camus Bran˜a and Flores Guille´n (2004) also show the dispersion of results obtained with different methods but point out that Pedersen’s formulation is more
reliable. In the case of being outside the range of application, good results are also obtained with this method.
& The foregoing studies (Camus Bran˜a and Flores Guille´n, 2004) also claim that a better approximation to the physical
process is obtained with the method of Martı´net al.because it
separately analyses the dynamic and pseudohydrostatic forces.
& Some calculation methods (Iribarren and Nogales, Martı´n et al.) indicate their range of validity. The others do not and it is therefore understood that they are applicable in any case. Nevertheless, it is recommended to know the conditions under which the said formulations were obtained before applying them to a case far from the original parameters.
& Existing calculation methods are recommendable for prior sizing. In any event, tests on a physical model are
recommended to confirm the final design. These tests may even lead to the cross-section’s optimisation.
REFERENCES
Berenguer JMa and Baonza A(2006) Rubble mound breakwater
crown wall design.Proceedings of the National Conference
of the Port and Coastal Technical Association, Algeciras, Spain(in Spanish).
Bradbury AW and Allsop NW(1988) Hydraulic effects of
breakwater crown walls. InDesign of Breakwaters –
Proceedings of the Conference Breakwaters ’88. Thomas Telford, London, UK, pp. 385–396.
Iribarren and Nogales
Gu¨nbak– Go¨cke
Bradbury– Allsop
Pedersen– Burcharth
Martı´n
et al.
Berenguer– Baonza
Year published 1954 1984 1988 1992 1995 2006
Wave’s angle of incidence with the perpendicular to the breakwater
– – – – X X
Type of armour layer units
– – – – X –
Armour layer’s porosity
– – – – X –
Others – – Predetermined
empirical coefficients
Empirical coefficients to be
determined in each case
– –
Burcharth H, Hawkins SJ, Zanuttigh B and Lamberti A(2007)
Environmental Design Guidelines for Low Crested Coastal Structures(DELOS Project). Elsevier, Amsterdam, the Netherlands.
Camus Bran˜a P and Flores Guille´n J(2004) Wave forces on crown walls. Evaluation of existing empirical formulations. In
Coastal Engineering 2004(McKee Smith J (ed.)). World Scientific, Singapore, vol. 4, pp. 4087–4099.
CIRIA-CUR(1991)Manual on the Use of Rock in Coastal and Shoreline Engineering. CIRIA, London, UK, CIRIA Special Publication 83/CUR Report 154.
De Waal JP, Tonjes P and van der Meer J(1996) Overtopping of
sea defences. InCoastal Engineering 1996(Edge BL (ed.)).
ASCE, New York, NY, USA, pp. 2216–2229.
Goda Y(1985)Random Seas and Design of Maritime Structures. University of Tokyo Press, Tokyo, Japan.
Gu¨nbak AR and Go¨cke T(1984) Wave screen stability of rubble
mound breakwaters.Proceedings of the International
Symposium on Maritime Structures in the Mediterranean Sea, Athens, Greece, pp. 2099–2112.
Iribarren R and Nogales C(1954)Obras Marı´timas: Oleaje y Diques. Editorial Dossat Madrid, Spain (in Spanish). Jensen OJ(1984)A Monograph on Rubble Mound Breakwaters.
Danish Hydraulic Institute, Horsrolm, Denmark.
Losada MA(1990) Recent developments in the design of mound
breakwaters. InHandbook of Coastal and Ocean
Engineering(Herbich JB (ed.)). Gulf Publishing Co., Houston, TX, USA, pp. 939–1050.
Martı´n FL, Vidal C, Losada MA and Medina R(1995) Un me´todo para el ca´lculo de las acciones del oleaje sobre los
espaldones de los diques rompeolas.Ingenierı´a del Agua
2(3): 37–52 (in Spanish).
Negro V, Varela O, Santos J, Garcia JH and Mora JI(2008)Disen˜o de Diques Rompeolas. Colegio de Ingenieros de Caminos, Canales y Puertos, Madrid, Spain (in Spanish).
Pedersen J and Burcharth HF(1992) Wave forces on crown
walls. InCoastal Engineering 1992(Edge BL (ed.)). ASCE,
New York, NY, USA, pp. 1489–1502.
Van der Meer J(1993)Conceptual Design of Rubble Mound Break-waters. Delft Hydraulics Publications, Delft, the Netherlands.
WHAT DO YOU THINK?
To discuss this paper, please email up to 500 words to the editor at [email protected]. Your contribution will be forwarded to the author(s) for a reply and, if considered appropriate by the editorial panel, will be published as discussion in a future issue of the journal.