Binary metal oxides for composite ultra
fi
ltration
membranes
A. Sotto,aJ. Kim,bJ. M. Arsuaga,aG. del Rosario,cA. Mart´ınez,dD. Nam,bP. Luise
and B. Van der Bruggen*f
A new ultrafiltration membrane was developed by the incorporation of binary metal oxides of the type Ti(x)Zr(1x)O2 inside polyethersulfone. Physico-chemical characterization of the binary metal oxides
demonstrated that the presence of Ti in the TiO2–ZrO2system results in an increase of the size of the
oxides, and also their dispersity. The crystalline phases of the synthesized binary metal oxides were identified as srilankite and zirconium titanium oxide. The effect of the addition of ZrO2can be expressed
in terms of the inhibition of crystal growth of nanocrystalline TiO2 during the synthesis process. For
photocatalytic applications the band gap of the synthesized semiconductors was determined, confirming a gradual increase (blue shift) in the band gap as the amount of Zr loading increases. Distinct distributions of binary metal oxides were found along the permeation axis for the synthesized membranes. Particles with Ti are more uniformly dispersed throughout the membrane cross-section. The physico-chemical characterization of membranes showed a strong correlation between some key membrane properties and the spatial particle distribution in the membrane structure. The proximity of metal oxide fillers to the membrane surface determines the hydrophilicity and porosity of modified membranes. Membranes incorporating binary metal oxides were found to be promising candidates for wastewater treatment by ultrafiltration, considering the observed improvement influx and anti-fouling properties of doped membranes. Multi-run fouling tests of doped membranes confirmed the stability of permeation through membranes embedded with binary TiO2–ZrO2particles.
1.
Introduction
Ultraltration is today an established technology for water treatment, either for the purication of water from natural resources, pretreatment for seawater desalination or sewage treatment.1 Polyethersulfone, polysulfone and polyvinylidene-uoride are the most common polymers used for the fabrica-tion of ultraltration membranes.2,3
Membrane fouling is considered one of the main drawbacks in the performance of ultraltration membranes, oen related to hydrophobicity. The hydrophobic surface of ultraltration membranes depends on the hydrophobic nature of the
polymeric membrane surface. The fouling mechanism can be described in terms of adsorption, deposition or accumulation of foulants of organic chemical nature on the membrane surface.4,5Adsorbed molecules increase the hydrophobicity of
the membrane or may decrease the pore diameter, leading to a decline of water permeability.6One of the methods proposed in
the recent literature to avoid membrane fouling is the use of hydrophilic particles as additives to the membrane composi-tions. Due to the hydrophilic nature of additives immersed in the membrane structure, the undesired hydrophobic interac-tions that take place between organic foulants and the membrane surface can be reduced considerably. Enhanced membranes with better anti-fouling properties lead to an improved performance in terms of permeability, solute rejec-tion, or membrane lifetime. Many types of inorganicllers have been proposed as polymeric membrane nanollers. In therst place, TiO27–11is undoubtedly the preferred material for this
goal, but also silica (SiO2),12,13carbon nanotubes,14zeolites,15,16
alumina (Al2O3),17 silver (Ag),18 zirconia (ZrO2),19 zinc oxide
(ZnO)20and zerovalent iron (FeO)21are of potential interest in
thiseld.
The main focus is on the use of transition metal oxides to manufacture ultraltration membranes with a more hydro-philic character. As the membrane hydrohydro-philicity increases, the aDepartment of Chemical and Energy Technology, Rey Juan Carlos University,
28933-M´ostoles, Madrid, Spain
b
Department of Environmental Engineering, Inha University, 100, Inha-ro, Incheon, Republic of Korea
cTechnological Support Center, Rey Juan Carlos University, 28933-M´ostoles, Madrid,
Spain
dDepartment of Basic Sciences Applied to Engineering, Technical University of Madrid,
Madrid, Spain
eMaterials and Process Engineering (iMMC-IMAP), Universit´e Catholique de Louvain,
Place Sainte Barbe 2, 1348 Louvain-la-Neuve, Belgium
fDepartment of Chemical Engineering, KU Leuven, W. de Croylaan 46, B-3001 Leuven,
Belgium. E-mail: [email protected]
Cite this:J. Mater. Chem. A, 2014,2, 7054
Received 21st December 2013 Accepted 21st February 2014
DOI: 10.1039/c3ta15347a
www.rsc.org/MaterialsA
Materials Chemistry A
PAPER
Open Access Article. Published on 21 February 2014. Downloaded on 11/03/2016 14:09:21.
This article is licensed under a
Creative Commons Attribution-NonCommercial 3.0 Unported Licence.
View Article Online
adverse hydrophobic interactions that lead to the formation of a fouling layer are mitigated.22 Transition metal oxides have a
wide variety of surface structures, which determine their elevated surface energy and hence their outspoken hydrophilic nature.23,24Other signicant approaches to improve the
hydro-philicity of ultraltration membranes have been proposed, including the self-segregation of hydrophilic polymers and binding of nanoparticles to the membrane surface.25,26 In
general, the incorporation of hydrophilic materials inside the membrane structure promotes the formation of membranes with a more open structure, with a higher average pore size and porosity, and with enhanced hydrophilicity. Both effects facili-tate water transport through the membrane structure, thus increasing the membrane's water permeability.27However, the
use of metal oxides as nanollers in membranes has some drawbacks. For example, high concentrations of metal oxide particles may lead to negative effects instead of an improve-ment, especially with respect to water permeability.28
Furthermore, a disproportionate increase of the membrane pore size provokes a non-equitable tradeoff between perme-ability and selectivity affecting negatively the general perfor-mance of the membrane.29Another important concern is the
environmental risk associated with the use of nanomaterials and the integrity of membrane functions.7
The inuence of some properties, such as the particle size and especially its spatial particle distribution on the membrane performance, has not been studied yet. In this context, it is important to cite the studies reported by Maximouset al.These authors showed the inuence of the distribution pattern of Al2O3 and ZrO2 particles on the performance of
poly-ethersulfone modied membranes.30,31 Recently, Sotto et al.
suggested that it is possible to reach a noteworthy enhancement in the permeability and membrane anti-fouling properties for an unusually low range of TiO2concentrations (below 0.4 wt
%).32Following this approach, Arsuagaet al.used low
concen-trations (0.4 wt%) of TiO2, ZrO2 and Al2O3 as hydrophilic
particles, and observed that the particle density of single metal oxides in the vicinity of the membrane surface affects positively the pore formation and prevents the decrease of permeateux as a result of the deposition/adsorption of BSA molecules on the membrane's upper layer.33 The objective of this work is to
prepare and characterize a new class of composite membranes applied to wastewater treatment, for which binary oxide metals have been synthesized in different stoichiometric combinations of TiO2and ZrO2in order to produce membranes with different
permeation characteristics. In this work the inuence of phys-ico-chemical properties of the particles and their spatial distribution inside the membrane structure on the morphology and performance of new binary metal oxide doped membranes has been explored.
2.
Experimental
2.1. Materials
Polyethersulfone (PES, 58 kDa) provided by BASF Co. (Germany) was used for preparation of polymeric membranes. This poly-mer was dried at 110C in an oven overnight prior to use for the
casting solution preparation. PES was dissolved in 1-methyl-2-pyrrolidone (NMP, 99.5%) solvent purchased from Sigma Chemical Co. Ltd (St Louis, USA). The non-woven support layer Viledon FO2471 was obtained from Freudenberg (Weinheim, Germany). As the model organic foulant Bovine Serum Albumin (BSA) purchased from Sigma-Aldrich (St Louis, MO) was selected. Milli-Q water was used as the solvent for preparation of BSA solutions (1 g L1, pH 7.0) using 0.2 M phosphate as a buffer solution.
2.2. Synthesis and characterization of metal oxide particles
Composite TiO2–ZrO2nanoparticles were prepared by the sol–
gel process described by Nghiem et al.22 and Mane et al.23
Titanium(IV) isopropoxide (TIPP), Ti[OCH(CH3)2]4, and
zirco-nium(IV) propoxide (ZPP), Zr(OCH2CH2CH3)4, were purchased
as pure grade reagents (Junsei Inc., Japan) and used to synthe-size composite TiO2–ZrO2 nanoparticles. The content of each
precursor to prepare colloidal solutions was varied as follows: 0.01 mol L1(M) TIPP + 0 M ZPP, 0.02 M TIPP + 0.01 M ZPP, 0.01
M TIPP + 0.01 M ZPP, 0.01 M TIPP + 0.02 M ZPP and 0 M TIPP + 0.01 M ZPP. This molar ratio corresponds to 0, 33, 50, 67 and 100 mol% zirconia in TiO2–ZrO2 particles, respectively.
Prepared solutions containing the desired molar ratio of TIPP and ZPP as precursors were placed into de-ionized (DI) water. Subsequently, this mixture was sonicated for 30 minutes and then stirred by using a magnetic stirrer for 24 hours at room temperature. Aer that, the solution was kept for 24 hours at room temperature and then dried for another 6 hours at 100C in a dry oven. The dried solution was calcined at 550C for 2 hours and the resulting powder was ground to yield composite TiO2–ZrO2 metal oxide particles. Particle grinding was
per-formed using a McCrone Micronising mill device (Glen Creston, UK) that reduces samples to sub-micron sizes.
The crystal structure of the samples was studied by XRD measurements by using a Philips X-PERT MPD diffractometer (Cu Karadiation) with a step size and counting time of 0.02 and 10 s, respectively. Appropriate sample preparation to obtain well-dispersed, isolated particles was accomplished. Metal oxide particles dispersed in ethanol were sonicated by ultra-sound irradiation for 30 min. Structural characterization was carried out by transmission electron microscopy (TEM) on a PHILIPS TECNAI-20 electron microscope operating at 200 kV.
The TiO2and ZrO2molar concentrations of the samples were
determined by inductively coupled plasma spectroscopy (ICP) with a VARIAN VISTA AX apparatus. The percentage of UV-vis reectance of powder samples was measured by diffuse re ec-tance spectroscopy using a Varian Cary 500 Scan UV-vis-NIR spectrophotometer (integrating sphere) instrument.
2.3. Membrane preparation
Neat (membrane 0) and modied (membranes A–E) PES membranes were synthesized by immersion precipitation. Prior to the preparation of modied membranes, the metal oxide
llers (0.5 g) were dispersed in a corresponding volume of NMP for 5 hours by mechanical stirring and ultrasound sonication. Once the uniform dispersion of added particles in NMP was
Open Access Article. Published on 21 February 2014. Downloaded on 11/03/2016 14:09:21.
This article is licensed under a
achieved, 20 g of polymer was added to form 100 g of metal oxide/polymeric solution. The polymerlm of PES cast at 20 wt% in NMP was immersed in a non-solvent bath of distilled water, in which phase separation occurs to form the membrane. The membrane was aerwards repeatedly washed with distilled water to remove the remaining solvent, and stored wet. In order to estimate the average value of measured variables in this investigation, four identical membrane sheets were prepared and tested.
2.4. Membrane characterization
Contact angle measurements were performed with a KSV CAM 200 instrument (KSV Instruments, USA) using the sessile drop technique. Scanning Electron Microscopy (SEM, XL-30, Philips, Eindhoven, the Netherlands) equipment was used to study the morphology of the cross-section of the membranes. In order to obtain the distribution pattern of metal oxides in the membrane cross-section, an energy dispersive spectrometer was coupled to SEM technology. For this analysis the samples were explored without application of a conductive metal coating procedure. Due to the requirements of image magnication to determine the membrane pore size distribution, a Field Emis-sion Gun Scanning Electron Microscope (FEG-SEM, FEI, the Netherlands) was used. Four samples of each type of doped membranes were analyzed to estimate the statistical distribu-tion, calculated in ponder percentage, as a ratio of the number of particles conned to a specic area to the total number of particles distributed along the membrane structure in the cross-section area analyzed.
Water uptake tests were conducted to evaluate the adsorp-tion of water by the composite membranes in order to deter-mine the overall membrane porosity (Pr%), using the following
equation:
Prð%Þ ¼
WwWd
Sdr
100 (1)
whereWwandWdare the weights of the membrane at
equilib-rium, wetted and dried; S is the membrane area; d is the thickness and r is the density of water. Average values of membrane porosity were calculated from measurements taken for 4 samples of each membrane.
2.5. Ultraltration procedure
The performance of neat and modied membranes was explored in terms of pure waterux, fouling performance and solute rejection studies using a cross-owltration setup.5The
ultraltration device and the experimental procedure followed in this study are similar to the previous work.31The experiments
were carried out in recycle mode at 2 bar trans-membrane pressure and 25C. For pure water permeation experiments, the feed was leto circulate for a period typically of 2 h, whereas for the BSA model solution the experimental time was around 12 h from the solution introduction before starting the sampling of permeate and feed.
A Varian Cary 500 Scan UV-vis-NIR spectrophotometer was used to determine the solute concentration for permeate and
feed samples containing BSA in Milli-Q water. The rejection was calculated by:
Rð%Þ ¼
1Cp
Cf
100 (2)
whereCpandCfare the permeate and feed concentrations of
PEG, respectively.
To describeux decline, the waterux is dened as a func-tion of transmembrane pressure (DP), viscosity (h) and total membrane resistance (Rt):
J¼hDP Rt
(3)
3.
Results and discussion
3.1. Characterization of binary oxide Ti(x)Zr(1x)O2particles
The composition of synthesized metal oxides investigated by ICP was similar to the theoretically expected values of molar percentages of TiO2and ZrO2in the binary oxides (Table 1). ICP
measurements strictly yield the metal weight percentages (Ti and Zr). Values shown in Table 1 were calculated by assuming stoichiometric oxide compositions (TiO2and ZrO2).
The X-ray powder diffraction patterns of synthesized binary metal oxides investigated in this study are shown in Fig. 1.
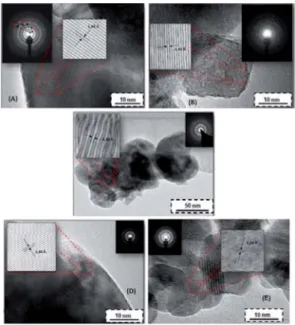
The crystalline phases of the synthesized metal oxides A–E were identied as shown in Table 2. The crystal phase recog-nition procedure was accomplished by combining the XRD experiments (Fig. 1) with high-resolution transmission electron microscopy (HRTEM) imaging. In Fig. 2, the digital diffraction pattern (DDP) obtained from the polycrystals is shown as the inset.
The observed diffraction patterns suggest the existence of a periodic arrangement of atoms conforming to different sets of atomic planes. Based on the information provided by the geometry of the diffraction directions, the crystal system can be recognized. In addition, the intensities of the diffracted rays are related to the nature of the atoms and the positions occupied in the crystal lattice, so that their measurement is a method for obtaining three-dimensional information about the internal crystal structure.
Considering the XRD measurements shown in Fig. 1 the most intense peaks corresponding to every powder sample can be recognized. Synthesized TiO2 (powder A) occurs as
aggre-gates of nano-crystals in a predominant anatase phase (Fig. 2 and 5). Its distinctive peaks appear at 2q: 25.31, 48.08, and
Table 1 Theoretical and ICP-mass measured values in mol% of pure TiO2and ZrO2present in Ti(x)Zr(1x)O2binary metal oxides
Metal oxide
Expected Measured (ICP)
TiO2(%) ZrO2(%) TiO2(%) ZrO2(%)
A 100 0 98 0
B 67 33 66 34
C 50 50 53 57
D 33 67 35 65
E 0.0 100 0 96
Open Access Article. Published on 21 February 2014. Downloaded on 11/03/2016 14:09:21.
This article is licensed under a
62.69, which correspond to the diffraction planes of (1 0 1), (2 0 0) and (2 1 3) Miller indices, respectively. For the zirconia sample (powder E), the predominant monoclinic phase of the ZrO2micro-crystals was observed, which is in agreement with
the literature.34The monoclinic phase is obtained as a result of
hydrolysis of the precursor of ZrO2. These results are in good
agreement with the literature.35,36 In the binary metal oxides
(powder B–D) highly crystalline particles still occur. Only several weak peaks of TiO2 are present in the XRD pattern of
Ti(x)Zr(1x)O2samples. In agreement with the results shown in
Fig. 2 the binary metal oxides mostly exist in the form of ZrO2
micro-crystals. The ZrO2contribution inhibits the formation of
TiO2crystalline particles.
Unfortunately, detailed phase diagrams for the calcinated samples of TiO2–ZrO2 at relatively low temperatures are not
Fig. 1 XRD patterns of pure TiO2and ZrO2and TiO2–ZrO2binary
oxide powders. (A) TiO2, (B) TiO2(67%)–ZrO2(33%), (C) TiO2(50%)–
ZrO2(50%), (D) TiO2(33%)–ZrO2(67%) and (E) ZrO2.
Table 2 Crystal phase identification values for the synthesized metal oxides
Powder sample dhkl(˚A) Relative intensity Miller indices DRX phase Reference pattern*
A 34 418 30 200 Anatase (tetragonal) 00-004-0477
23 073 35 220
18 437 35 222
16 388 15 422
14 440 15 204
B 36 858 20 200 Srilankite (orthorhombic) 0-035-0584
28 923 100 211
23 665 15 220
21 358 20 222
C 3498 40 200 Zirconium titanium oxide
(orthorhombic)
00-034-0415
2886 100 211
2399 60 220
2106 30 222
1448 20 422
D 36 880 10 200 Zirconium titanium oxide
(orthorhombic)
01-080-1783
29 360 100 211
15 350 40 422
E 38 281 10 200 Zirconium oxide (monoclinic) 01-078-0048
29 360 90 211
13 091 10 220
11 498 5 422
Fig. 2 HRTEM images of samples. The insets in the images are the digital diffraction patterns and the image processing fordhkl deter-mination from the corresponding particles. (A) TiO2, (B) TiO2(67%)–
ZrO2(33%), (C) TiO2(50%)–ZrO2(50%), (D) TiO2(33%)–ZrO2(67%) and (E)
ZrO2.
Open Access Article. Published on 21 February 2014. Downloaded on 11/03/2016 14:09:21.
This article is licensed under a
available in the literature. Troitzschet al.37reported that as a
result of slow kinetics of synthesis experiments performed at temperatures below 1200C the composition of these samples results in metastable phases in the TiO2–ZrO2system. The sol–
gel method, used in this study (calcination temperature 550C), is prone to such effects, so that the equilibrium state of those samples is uncertain.38,39
Considering the possible presence of a combination of phases described as Ti(x)Zr(1x)O2, the analysis and identi
ca-tion of the major phases from the diffraction patterns (Fig. 2) of these powders were accomplished. For this purpose, the spacing between the individual planesdhklwas measured using an image digital processor (Digital-Micrograph 3.6) from every digital diffraction pattern (DDP). Subsequently, Miller indices were calculated.38 Once the Miller indices are known, the
identied phases by XRD are corroborated with the reference patterns summarized in the database.43,44Srilankite, a mineral
with the chemical formula Zr2.20Ti1.80O8.00, was found to be the
most probable crystalline phase for the powder B, synthesized at lower contents of TiO2, whereas zirconium titanium oxide
chemically described as ZrTiO4appears to be the predominant
phase as a result of the increasing Zr content. Both chemical species yield adequate information about the crystal structure of TiO2–ZrO2samples synthesized in this work.
Surface physico-chemical properties are relevant character-istics of the metal oxide particles. For this reason, hydrophilicity and zeta potential of metal oxides were evaluated. In all studied cases the observed contact angles were lower than 10, sug-gesting a great hydrophilic character for the synthesized mate-rials that could enhance the water permeation properties of doped membranes.
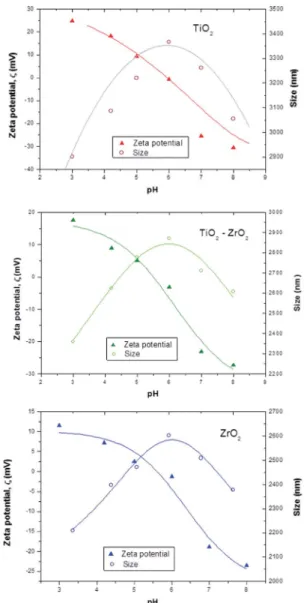
The zeta potential of the synthesized particles was measured for an aqueous solution containing 0.5 wt% of metal oxide at different pHs. Fig. 3 shows a typical amphoteric behavior of the electrophoretic mobility of metal oxide particles as a function of solution pH, indicating that particles have a lower tendency to agglomerate when they are electrically charged. Solution pH affects the hydrodynamic diameter of particles by changing the particle surface charge and zeta potential. TiO2particles show a
higher dimension with average sizes around 3mm. Agglomera-tion of metal oxide particles can dominate when the soluAgglomera-tion pH (ca.6) is close to the isoelectric point because the repulsive force between particles caused by electrostatic interaction can be mitigated.32
Assuming that these metal oxides are used as semi-conductors in different applications (e.g., as catalysts for water treatment, due to the high oxidation power42), the band gap
energy of these materials was determined as a measure of their electric conductivity. As shown in Fig. 4, a gradual increase (blue shi) in the band gap is seen with an increase in the amount of Zr loadings. The band gap of the binary oxide samples was quite similar, indicating that their photo-absorbance properties are poorly related to their different compositions. The presence of Ti, even at low contents, deter-mined the conductivity of synthesized binary metal oxides.40
In order to evaluate the morphology (size and shape) of individual particles, TEM images of synthesized powders were
taken. Fig. 5 shows the synthesized binary oxides as micropar-ticles formed by aggregation of semi-spherical nanosized crys-tals with polyhedral shape and with different particle size Fig. 3 Zeta potential (triangles) and average size (circles) of metal oxide particles as a function of aqueous solution pH.
Fig. 4 Band gap energy of the synthesized metal oxides derived from the diffuse reflectance measurements.
Open Access Article. Published on 21 February 2014. Downloaded on 11/03/2016 14:09:21.
This article is licensed under a
distributions as a result of their composition. Table 3 summa-rizes some relevant size characteristics of individual nano-particles. It can be seen that the incorporation of TiO2into the
general composition of synthesized metal oxides increases the individual particle size and at the same time the dispersion rate also increases, considering the standard deviation values.
In general, all analyzed metal oxides show a tendency to form agglomerates held by weaker van der Waals forces.34 The
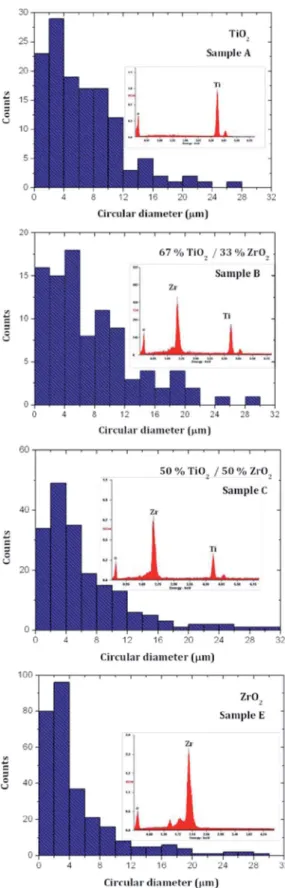
microparticle size distributions of selected binary metal oxides were determined from SEM and are shown in Fig. 6. The EDS analysis of the element composition for each metal oxide is exhibited together with the corresponding particle size distribution.
The metal oxides TiO2and ZrO2form aggregates in micron
sizes with an average particle size of around 3mm. In particular, the prepared ZrO2 oxides are monodisperse aggregates,
Table 3 Composition and size characteristics of metal oxides
Metal oxide type
Minimum (nm)
Maximum (nm)
Average sizeS.D. (nm)
TiO2 20.4 75.1 41.516.5
TiO2(50%)–ZrO2(50%) 24.3 187.8 85.345.7 TiO2(33%)–ZrO2(67%) 23.7 175.0 109.057.1
ZrO2 4.4 11.6 7.92.3
Fig. 5 TEM images of synthesized metal oxides.
Fig. 6 Particle size distribution of synthesized metal oxides: powder A – TiO2, powder C – TiO2(50%)–ZrO2(50%), powder D –
TiO2(33%)–ZrO2(67%) and powder E–ZrO2.
Open Access Article. Published on 21 February 2014. Downloaded on 11/03/2016 14:09:21.
This article is licensed under a
exhibiting a narrow particle size distribution, with a peak at 3
mm; the average particle size is smaller than the one observed for TiO2 particles. The formation of binary metal oxides
increases the particle size, as well as enhancing the dispersivity of formed particle agglomerates. The observed polydispersity for binary metal oxides with a chemical structure type of Ti(x)Zr(1x)O2can be explained in terms of the increase of the
surface area due to the dissimilar nuclei and co-ordination geometry.35 Considering the individual distributions of TiO
2
and ZrO2 particles, the presence of titanium in their
corre-sponding structures signicantly alters the particle morphology. In other words, the addition of ZrO2can effectively
inhibit the excessive crystal growth of TiO2 micro-crystals
during thermal processing.41
In order to explore the possible changes in the morphology of metal oxides as a result of dispersion in the solvent during the polymeric solution preparation, solid size measurements in the NMP dispersion were accomplished. The obtained particle size distributions (Fig. 7) were comparable to the metal oxide aggregates analyzed previously (Fig. 6). The particle size of metal oxides dispersed in the organic solvent ranged in the micrometric scale.
3.2. Membrane morphology characterization
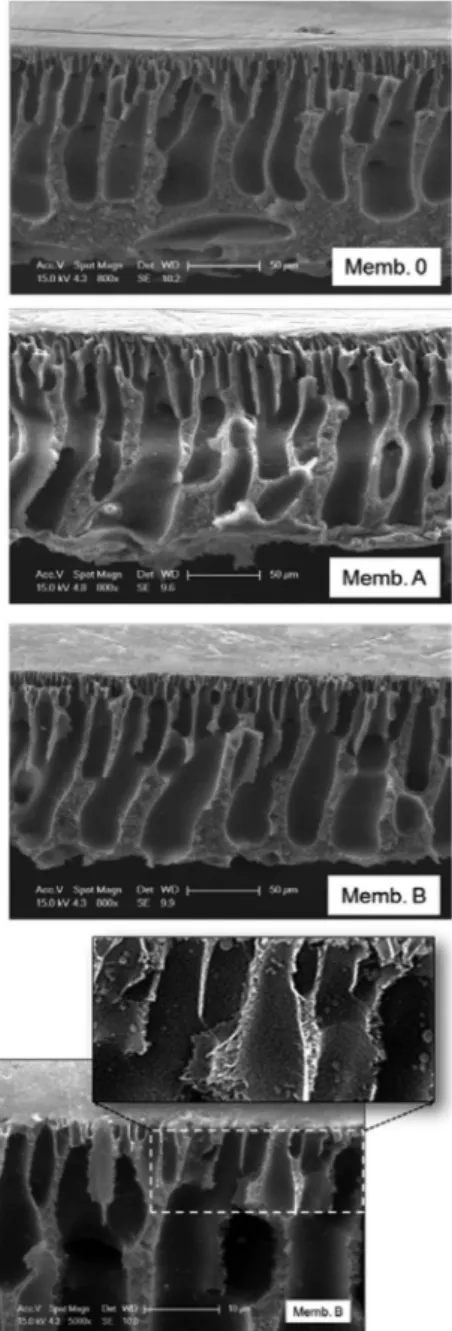
SEM cross-section images of prepared membranes were taken in order to explore possible changes in the inner morphology of membranes as a result of the addition of binary oxides (Fig. 8). Due to the high solubility of the solvent (NMP) in water and the low polymer content used for membrane synthesis by phase inversion, the resulting PES membranes exhibit a nger-like structure in their cross-section. The control PES membrane exhibits a typical asymmetric cross-sectional structure, con-sisting of a skin layer as a selective barrier, a thicknger-like sub-layer and a sponge-like bottom layer. It is well-known that the addition of low amounts (0.5 wt%) of inorganicllers to the polymeric solution alters the morphology of the membrane by the formation of macrovoids and reduction of the thickness of the skin layer.33Both effects are observed as a result of TiO
2
addition. Moreover, the use of binary oxides Ti(x)Zr(1x)O2 as
inorganic ller particles provokes further changes in the membrane morphology. Symmetrical narrow macrovoids are
formed, wellxed with the thinner membrane skin layer. The top and bottom sides of the membrane are connected through parallel channels, which can favour water permeation across the membrane. In general, the connectivity of surface pores with the sub-layers is improved aer the addition of metal oxide particles.
A magnied image of membrane B is also included in Fig. 8 to allow visualization of metal oxide microparticles inside the membrane structure both in macrovoid walls and in the vicinity of the membrane surface. It is well-known that the hydrophilic character of the nanoller increases the water transport through the membrane enhancing the membrane water permeation.
The pore size distribution of the membranes is shown in Fig. 9. The average diameters for control and doped membranes Fig. 7 Metal oxide particle size distribution in NMP.
Fig. 8 SEM cross-section images of synthesized membranes at two different magnifications: 800 and 5000. An additional magnified image of membrane B is shown.
Open Access Article. Published on 21 February 2014. Downloaded on 11/03/2016 14:09:21.
This article is licensed under a
were 2.5 and 7.5 nm, respectively. As a result of the addition of inorganic particles, the average pore size of the membranes increased to around 5 nm.
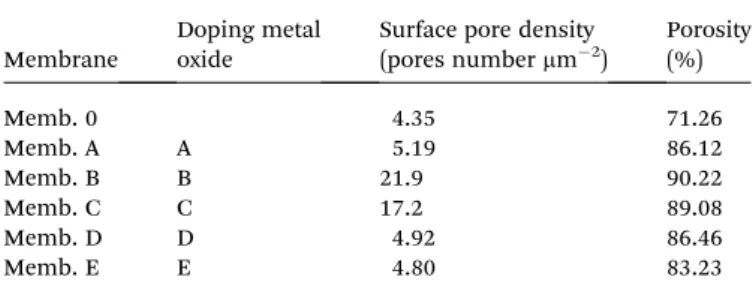
The membrane porosity was investigated by two different procedures: from FEG-SEM images (surface pore density) and from uptake water experiments (overall porosity). Calculated values are summarized in Table 4. Surface porosity in terms of the ratio of pores area to the total membrane surface area yielded small values (lower than 0.5%) and are not included in Table 4. The presence of inorganic particles with specic hydrophilic nature enhances the diffusion of the non-solvent (water) into the nascent membrane during the phase inversion process. The favoured water diffusion promotes the formation of lean polymer phase points, which act as pore formation agents.30Both effects, the increase of surface pore density and
the growth of well connected and narrow macrovoids, explain the increasing free-volume in the membrane structure, which favours water sorption inside the membrane. This cooperative effect is evident for Memb. B and Memb. C, both being Ti(x)Zr(1x)O2modied PES membranes.
The spatial distribution of particles in the membrane cross-section was explored through EDS by collecting the detected signal of chemical elements dispersed inside the membrane structure by X-ray maps (EDAX, USA). The option used for this analysis was EDX fast mapping that provides the capability to acquire X-ray maps at high speed in frame averaging mode. The acquisition parameters to select were: magnication 1000, numbers of point select for the scan inxandyaxis directions for mapping (matrix 256200), resolutions in both directions 0.513 0.513mm per pixel and the microscope operating at 20 keV.
The metal oxide pattern distributions inside the membrane structure obtained from EDS are exhibited in Fig. 10. As shown, pure TiO2 is evenly distributed through the membrane
cross-section, in contrast to the pure ZrO2pattern distribution that
reveals that particle density is poor near the skin membrane layer. In addition, Fig. 10 demonstrates that microparticles are present in the membrane top layer whenever the metal oxide contains Ti.
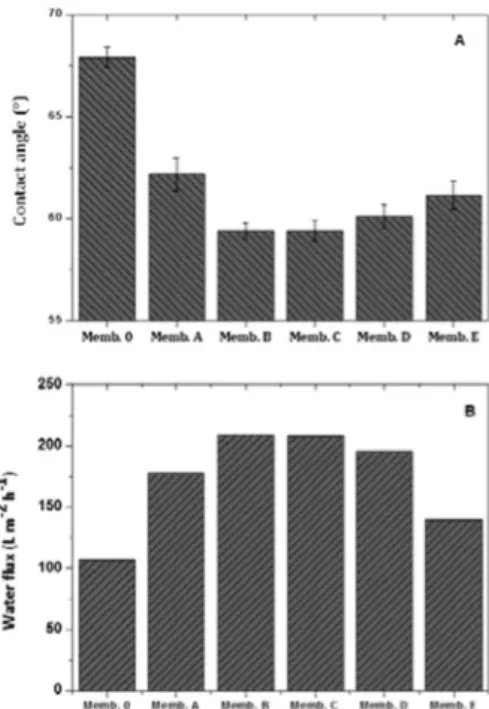
3.3. Hydrophilicity and water permeation of prepared membranes
To evaluate the surface hydrophilicity of the membranes doped with different types of metal oxides, surface contact angles were measured (Fig. 11A). It was observed that the contact angle of PES membranes decreases with the incorporation of inorganic
llers, especially for membranes doped with binary metal oxides. In general, the large amount of hydroxyl groups on the surface of metal oxidellers increases the hydrophilic character of the polymeric material, hydrogen bonds between water and the membrane surface. In the case of metal oxide doped membranes, the observed decrease of contact angles may be related to an increase of the surface pore size. As the dimen-sions of membrane surface pores increase, more water is adsorbed by the membrane during the contact angle experiments.
Water permeation of synthesized membranes was tested for pure water (Milli-Q), as shown in Fig. 11B. All the doped Fig. 9 Pore size distributions of PES control, PES–TiO2 and PES–
TixZr(1x)O2membranes.
Table 4 Values of surface porosity and overall porosity determined by SEM and the water uptake test, respectively, for the control and doped membranes
Membrane
Doping metal oxide
Surface pore density (pores numbermm2)
Porosity (%)
Memb. 0 4.35 71.26
Memb. A A 5.19 86.12
Memb. B B 21.9 90.22
Memb. C C 17.2 89.08
Memb. D D 4.92 86.46
Memb. E E 4.80 83.23
Open Access Article. Published on 21 February 2014. Downloaded on 11/03/2016 14:09:21.
This article is licensed under a
membranes had a higher pure waterux than the control PES membrane, whereas the maximum uxes were obtained for membranes doped with metal binary oxides. This is coherent
with the observed increase of the hydrophilic character of the doped membranes. The higher ux obtained for these membranes can be further related to the increased surface pore density (Table 4) and improved connectivity of inner layers in the morphology (Fig. 8) of metal binary oxides. As the inter-connectivity between the sub-layers of the membrane increases with an increased number of surface pores of the skin layer, the membrane hydraulic resistance decreases, resulting in a higher waterux. So, there are three reasons that explain why theux increases: increased hydrophilicity, surface pore density and pore connectivity.
3.4. Membrane fouling study
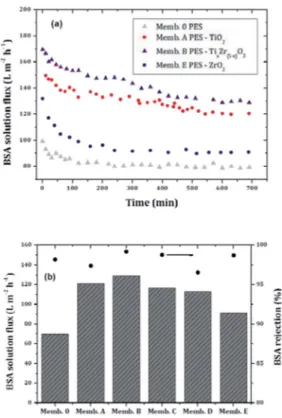
In order to explore the fouling behavior of the membranes synthesized in this investigation, a model solution of BSA was used to study theux and protein rejection of control PES and doped membranes (Fig. 12).
The incorporation of metal oxide particles into the polymer matrix caused a signicant increase of the membraneux. The PES-binary oxide doped membrane, Memb. B, had a 48% higher
ux compared to the control PES membrane. Fig. 12 also compares the steady stateuxes.
In order to explore the effect of fouling on the BSA rejection, the observed rejections for each membrane are also shown in Fig. 12B. It can be seen that the rejection of the doped membranes is hardly affected by the incorporation of metal oxidellers.
The impact of membrane modication on the membrane fouling performance was quantitatively studied using the resistance-in-series model32as shown in Fig. 13.
The effect of metal oxides addition can be studied from the observed differences between intrinsic membrane resistances obtained for control and doped membranes. In addition, Fig. 10 Metal oxide particle depth distribution from top to bottom in
doped membranes.
Fig. 11 Hydrophilicity and permeation of manufactured membranes.
Open Access Article. Published on 21 February 2014. Downloaded on 11/03/2016 14:09:21.
This article is licensed under a
fouling resistance caused by solute adsorption of foulants on the membrane pore wall or surface decreases for the modied membranes, especially for Memb. 2 and Memb. 3. In general, the fouling performance is dominated by the hydrophilic nature of the membrane. The control PES membrane has the highest
total and irreversible resistance due to its lower hydrophilicity (Fig. 11A). However, the addition of metal oxides does not have a larger impact on the reversible fouling of membranes. This similar performance in reversible fouling can be caused by the low number of particles distributed at the membrane and pore surfaces, which is a disadvantage for the improvement of the membrane performance. The main difference in fouling resis-tance of the membranes was observed to be irreversible fouling. However, the irreversible resistance tracks closely with intrinsic resistance, suggesting that the main observed improvement is rather associated with theux increment.
4.
Conclusions
The presence of Ti in the binary oxides Ti(x)Zr(1x)O2promotes
an increase of the size and particle dispersity of synthesized particles. As expected, a gradual increase (blue shi) in the band gap was observed with an increase in the Zr loading, which indicates potential for photocatalytic applications. Distinct distributions in the membrane structure were found for Ti and Zr in the metal oxide doped membranes. Particles with Ti contents are more uniformly dispersed through the membrane cross-section, whereas Zr oxides are rather present in the middle and near the bottom side of the membrane. The morphology of the binary oxide doped membranes is signi -cantly changed. The pore size, surface and overall porosities of the membranes increase. The surface porosity signicantly depends on the particles present in the vicinity of the surface. A specic effect due to the presence of Ti was observed as a consequence of its preferred distribution near the upper membrane layer. The performance of the membranes conrms the potential for application of binary oxides as nanollers for mixed matrix membranes, taking the observed improvement in
ux and anti-fouling properties of doped membranes into account.
Acknowledgements
The authors are grateful fornancial support from the research project “REMTAVARES S2009/AMB/1588” (2010–2013). This research was also supported by Basic Science Research Program through the National Research Foundation of Korea (NRF) funded by the Ministry of Science, ICT and Future Planning (2012R1A1A1011929). The authors gratefully acknowledge Mar´ıa Salud L´opez for supporting the ICP measurements.
References
1 S. Dogruel, E. U. Cokgor and O. Ince,Environ. Sci. Pollut. Res., 2013,20, 340.
2 M. S. Araki, C. M. Coutinho, L. A. G. Gon and L. A. Viotto,Sep. Purif. Technol., 2010,71, 13.
3 J. Lindau and A.-S. J¨onsson,J. Membr. Sci., 1999,160, 65. 4 Y. Zhao, L. Song and L. S. Ong,J. Membr. Sci., 2010,349, 75. 5 J. M. Arsuaga, A. Sotto, M. J. Lopez-Mu˜noz and L. Braeken,
J. Membr. Sci., 2011,372, 380. Fig. 12 Temporal evolution of protein solutionflux and comparison of
BSA solutionflux with protein rejection of tested membranes.
Fig. 13 Filtration resistances of control and doped membranes (a) intrinsic and total resistances (b) reversible and irreversible resistances.
Open Access Article. Published on 21 February 2014. Downloaded on 11/03/2016 14:09:21.
This article is licensed under a
6 L. Braeken, K. Boussu, B. Van der Bruggen and C. Vandecasteele,ChemPhysChem, 2005,6, 1606.
7 J. Kim and B. Van der Bruggen,Environ. Pollut., 2010,158, 2335.
8 A. Razmjou, J. Mansouri and V. Chen,J. Membr. Sci., 2011, 378, 73.
9 S.-Y. Kawak, S. Kim and S. S. Kim, Environ. Sci. Technol., 2001,35, 2388.
10 Ng. Yong, N. Wahab, M. A. Leo and C. Peng,Desalination, 2013,308, 15.
11 A. Sotto, A. Boromand, S. Balta, J. Kim and B. Van der Bruggen,J. Mater. Chem., 2011,21, 10311.
12 S. Yu, X. Zuo, R. Bao, X. Xu, J. Wang and J. Xu,Polymer, 2009, 50, 553.
13 J. Shen, H. Ruan, L. Ç Wu and C. Gao,Chem. Eng. J., 2011, 168, 1272.
14 D. Parisa, S. S. Madaeni and N. Ghaemi,Sep. Purif. Technol., 2013,104, 32.
15 M. L. Lind, A. K. Ghosh, A. Jawor, X. Huang, W. Hou, Y. Yang and E. M. V. Hoek,Langmuir, 2009,25, 10139.
16 M. Muhlmann, A. Magerl and W. A. Goedel,Langmuir, 2012, 28, 8197.
17 X.-M. Wang, X.-Y. Li and K. Shih,J. Membr. Sci., 2011,368, 134. 18 Y. Q. Deng, G. D. Dang, H. W. Zhou, X. H. Rao and
C. H. Chen,Mater. Lett., 2008,62, 1143.
19 G. Arthanareeswaran and P. Thanikaivelan, Sep. Purif. Technol., 2010,74, 230–235.
20 S. Balta, A. Sotto, P. Luis, L. Benea, B. Van der Bruggen and J. Kim,J. Membr. Sci., 2012,389, 155.
21 S. Xiao, M. Shen, R. Guo, S. Wang and X. Shi,J. Phys. Chem. C, 2009,113, 18062.
22 L. D. Nghiem, A. Sch¨afer and M. Elimelech, Environ. Sci. Technol., 2004,38, 1888.
23 R. S. Mane, W. J. Lee, H. M. Pathan and S.-H. Han,J. Phys. Chem. B, 2005,109, 24254.
24 M. A. Ahmad, B. Prelot and F. Dufour,J. Phys. Chem. C, 2013, 117, 4459.
25 S. Kang, A. Asatekin, A. M. Mayes and M. Elimelech, J. Membr. Sci., 2007,296, 42.
26 S. Liang, Y. Kang, A. Tiraferri, E. Giannelis, X. Huang and M. Elimelech, ACS Appl. Mater. Interfaces, 2013, 5, 6694.
27 R. Saranya, G. Arthanareeswaran, S. Sakthivelu and P. Manohar,Ind. Eng. Chem. Res., 2012,51, 4942.
28 Y. Yang, H. Zhang, P. Wang, Q. Zheng and J. Li,J. Membr. Sci., 2007,288, 231.
29 N. A. Hamid, A. F. Ismail, T. Matsuura, A. W. Zularisam, W. J. Lau, E. Yuliwati and M. S. Abdullah, Desalination, 2011,273, 85.
30 N. Maximous, G. Nakhla, W. Wan and K. Wong,J. Membr. Sci., 2009,341, 67.
31 N. Maximous, G. Nakhla, W. Wan and K. Wong,J. Membr. Sci., 2010,352, 220.
32 A. Sotto, A. Boromand, R. Zhang, P. Luis, J. M. Arsuaga, J. Kim and B. Van der Bruggen, J. Colloid Interface Sci., 2011,363, 540.
33 J. M. Arsuaga, A. Sotto, G. del Rosario, A. Mart´ınez, S. Molina, S. B. Teli and J. de Abajo,J. Membr. Sci., 2013,428, 131. 34 J. J. Jiang, G. Oberdorster and P. Biswas,J. Nanopart. Res.,
2009,11, 77.
35 C. Wu, X. Zhao, Y. Ren, Y. Yue, W. Hua, Y. Cao, Y. Tang and Z. Gao,J. Mol. Catal. A: Chem., 2005,229, 233.
36 T. Sato,J. Therm. Anal., 2002,69, 255.
37 U. Troitzsch and J. Ellis,J. Mater. Sci., 2005,40, 4571. 38 A. Bianco, G. Gusmano, R. Freer and P. Smith,J. Eur. Ceram.
Soc., 1999,19, 959.
39 U. Troitzsch, A. G. Christy and J. Ellis,J. Am. Ceram. Soc., 2004,87, 2058.
40 X. Fu, L. A. Clark, Q. Yang and M. A. Anderson,Environ. Sci. Technol., 1996,30, 647.
41 X. Wang, J. C. Yu, Y. Chen, L. Wu and X. Fu,Environ. Sci. Technol., 2006,40, 2369.
42 B. Neppolian, Q. Wang, H. Yamashita and H. Choi, Appl. Catal., A, 2007,333, 264.
43 J. B. Cohen, Diffraction Methods in Materials Science, The Macmillan Comp., New York, 1966.
44 Crystallography Open Database (COD): http://www. crystallography.net/.
Open Access Article. Published on 21 February 2014. Downloaded on 11/03/2016 14:09:21.
This article is licensed under a