Collective decision-making based on social odometry
Alvaro Gutiérrez • Alexandre Campo • Félix Monasterio-Huelin • Luis Magdalena • Marco Dorigo
Abstract In this paper, we propose a swarm intelligence localization strategy in which robots have to locate dif-ferent resource areas in a bounded arena and forage between them. The robots have no knowledge of the arena dimensions and of the number of resource areas. The strategy is based on peer-to-peer local communication without the need for any central unit. Social Odometry leads to a self-organized path selection. We show how collective decisions lead the robots to choose the closest resource site from a central place. Results are presented with simulated and real robots.
Keywords Swarm robotics • Self-organization • Collective decision • Local communication
Á. Gutiérrez (E3) • F. Monasterio-Huelin ETSIT, Universidad Politécnica de Madrid, Avd. Complutense 30, 28040 Madrid, Spain e-mail: aguti@etsit.upm.es
F. Monasterio-Huelin
e-mail: felix.monasteriohuelin@upm.es
A. Campo • M. Dorigo
IRIDIA, CoDE, Université Libre de Bruxelles,
50 Av. Franklin Roosevelt, CP 194/6, 1050 Brussels, Belgium e-mail: acampo@ulb.ac.be
M. Dorigo
e-mail: mdorigo@ulb.ac.be
L. Magdalena
European Centre for Soft Computing,
C. Gonzalo Gutiérrez Quirós S/N, 33600 Asturias, Spain e-mail: luis.magdalena@ softcomputing.es
1 Introduction
A safe nest and abundant food are the key aspects to ensure animal survival. The ability to find, select and exploit food resources is crucial and goes under the name of foraging (Deneubourg et al. 1990; Camazine et al. 2003).
Animals forage in many different ways, adapting to changing conditions. A particularly interesting foraging strategy is the one of ant colonies. Ants are able to col-lectively find and select the shortest path to a resource by using simple indirect local interactions (Bonabeau et al. 1999; Camazine et al. 2003). Their foraging effectiveness is the result of a robust strategy based on local interactions between a large number of autonomous agents. The chemical trails formed by ants are robust with respect to changes in the environment and to the failure of individuals (Deneubourg et al. 1990). The path selected by an individual which leaves pheromone on it influences the path chosen by the next ant that passes, which also adds pheromone on the path. In this way, one specific path is rapidly and collectively selected. After multiple interactions, the foragers establish a pheromone trail between the nest and a resource site. Experiments have shown that because of the trail-laying behavior, ants are able to choose the richest or nearest food source from a number of different available resources (Beckers et al.
1992).
shown that it plays an important role in the regulation of collective foraging decisions (Camazine 1993).
In our research, we are interested in localization and navigation strategies for swarm robotics inspired by the observation of ants (pheromones and trophallaxis). Our robots do not mark their environment with any chemical or other substance. Rather, the robots use peer-to-peer com-munication to achieve their task collectively and in a self-organized manner. This mechanism, previously defined as
Social Odometry in Gutiérrez et al. (2008b, 2009c), is based on the assumption that robots act as sensors for other robots. This solution has already proven to be able to cope with individual's dead-reckoning errors by exploiting self-organized cooperation in a group of real robots (Gutiérrez et al. 2009b). In a nutshell, the knowledge of each robot consists of an estimate of the goals location (state vector) and an associated confidence level that decreases with the distance traveled (inspired by the state vector covariance matrix, Simon 2006). Because the robots use the estimates of the others, we engineer an efficient and decentralized knowl-edge-sharing mechanism which allows the robots to achieve their goals, both from an individual and group perspective. Estimated locations, confidence levels and actual locations of the robots co-evolve in parallel in order to guide each robot to the correct objective. This online social dynamics allows the population of robots both to reduce the individual's errors and to reach a common objective efficiently.
While in previous works we focused on the reduction in the individual's errors, in this paper we extend Social
Odometry to effective collective decision-making: we
consider an experimental foraging task in which different resource areas are offered to a swarm of robots that col-lectively select the closest resource area exploiting local communication.
The remainder of this paper is organized as follows. In Sect. 2, we discuss related work. In Sect. 3, we give a description of the problem under study and an overview of the simulator and of the e-puck robot used in our experi-ments. Section 4 describes the control algorithms used. In Sect. 5, we present the experimental results. Finally, in Sect. 6 we draw some conclusions.
2 Related work
2.1 Basic robot localization
Optimal filters and map-like representations have been applied with remarkable success to robot localization (Simmons and Koenig 1995; Cassandra et al. 1996; Burgard et al. 1996, 1998; Gutmann et al. 1999, 2001; Chong and Kleeman 1997; Wang 1988). Most of these approaches are based on Markov localization methods that make use of
dead-reckoning and absolute or relative measurements. The key idea is that each robot maintains an estimate of its position which will be updated according to its odometry calculations and measurements in the environment. The most used probabilistic method has been the Kalman Filter (KF) (Kalman 1960; Larsen et al. 1998; Martinelli and Siegwart 2003). Although the KF is an efficient recursive filter, it requires external information that models the environment. Moreover, it is computationally costly. On the other hand, map-like approaches (Dudek and Mackenzie 1993) do not scale well for large groups of robots, and are also costly in computational terms.
2.2 Multi-robot localization
2.3 Foraging in robotics
One of the most studied tasks in multi-robot localization is foraging. Foraging involves a group of robots localizing a resource site. Once the resource site has been located, the robots collect objects from the resource site and deposit them in a target location. We find in the literature many strategies based on minimal communication that allow the robots to find and carry out their task successfully. For instance, in Balch and Arkin (1994), the authors make use of a schema-based controller and limited communication to show that the robots carry out successfully all of their different foraging tasks proposed in an office-like envi-ronment. Parker (1998) implemented a reactive architec-ture for a waste cleanup task. Her work is based on a fully distributed behavior-based architecture that incorporates the use of impatience and acquiescence concepts, which allow each robot to achieve adaptive action selection. The software architecture possesses a variety of high-level functions that can be carried out during the task. Each robot individually selects appropriate actions based on the activities that other robots are carrying out, the current environmental conditions, and the robots internal states. In Mataric (1997), the author discusses the challenges of learning in a dynamic, noisy, situated and embodied mobile multi-robot scenario. The work focuses on synthesizing complex group behaviors from simple social interactions between individuals. An effective foraging task is achieved thanks to a reinforcement learning algorithm. However, the speed of learning is reduced as the size of the group increases, as a result of interference between the agents. Nonetheless, Mataric shows that robots are able to modify their behavior and learn social rules, which serve to min-imize interference and maxmin-imize the group effectiveness. In Valdastri et al. (2006) and Corradi et al. (2009), the authors avoid the use of static robots and implement a vector-based communication algorithm in a dust collection task. The paper proposes a communication strategy in which the robots communicate the location of dust and dump areas based on a simple range and bearing micro-sensor. The sensor approximates the distance to the emitter robot by a fixed value which equals half of its maximum range and the bearing is discretized in four quadrants. Because of the limited sensor resolution and because the robots do not keep track of their movements, a high density of individuals is needed to achieve the cleaning task proposed.
Some other works make use of "virtual" pheromones (Payton et al. 2001). In Payton et al. (2003), the authors send symbolic messages, called virtual pheromones, using a range and bearing communication device. In this way, by using a simple communication system, a swarm becomes a distributed computing network within the environment,
which enables the design of complex group behaviors. The messages are propagated locally between robots, producing a gradient as they are propagated. The authors describe how complex compound behaviors can be obtained from combinations of simpler behaviors based on this commu-nication strategy. McLurkin and Smith (2004) use a geo-metric-based algorithm to spread autonomous robots in an arena and localize different places. Only local inter-robot communication and processing are used. A communication network made up of gradient-based multi-hop messages is used to guide the robot's motion. One robot starts the communication which is then relayed throughout the net-work by the rest of the swarm. If multiple messages are received, a robot relays the one with the lowest hop count. Therefore, robots move from a central start location to their final position along the shortest path.
Other works try to emulate sensors to focus on the pheromone-like paradigm. In Russell (1995, 1999), an odor sensor is developed which uses controlled airflow to overcome the problem of localizing odor markings. In Stella et al. (1995), a robot is equipped with a cheap odor sensor able to sense and follow an odor marker deposited on the ground. On the other hand, Svennebring and Koenig (2003) study a trail-laying process where robots must leave trails to cover a terrain. In Wagner et al. (1999) the authors use a decentralized multiagent adaptive system with a shared memory in which the robots perform a cleaning task of an un-mapped building based on graphs. The three methods described are adaptive to changes in the envi-ronment. In Campo et al. (2006), a distributed mechanism of negotiation of direction for cooperative transport is presented. The robots use a vision software that allows to perceive the direction pointed by other robots. The robots share their knowledge in order to collectively improve their estimate of the goal direction.
been tested in simulation; therefore, a real robot imple-mentation will be necessary to fully understand the benefits of this approach.
In the present work, we show how a group of robots is able to collectively choose the closest resource area in a foraging task using Social Odometry. Social Odometry is not based on any map-like algorithm and despite being inspired by the Kalman Filter (see Sect. 4.2), it does not require any explicit model of the movement errors. On the contrary, a relationship between the distance traveled and a confidence level allows the robots to select the closest resource site.
Moreover, Social Odometry uses a range and bearing communication sensor which replaces real pheromones. The robots communicate their position estimates to their neighbors with this sensor (see Sect. 3.3). The communi-cation does not rely on any central unit. Therefore, no synchronization is needed by the robots to exchange their information, removing the need for a common time axis.
3 The task and the robots
3.1 The task
The foraging task presented in this paper is carried out in a rectangular bounded arena, where a virtual nest area and two virtual prey areas are located. Two different experi-mental setups (ESs) have been chosen to compare and study the convergence of the algorithms (see Sect. 5). Figure la shows an Asymmetric ES (AES), where the two prey are at different distances from the nest. Figure lb shows a Symmetric ES (SES), where the two prey are at the same distance from the nest. Robots have to find prey and virtually carry them to the nest. Robots have no knowledge about the dimensions of the arena or the area location. They are initially located in a fixed central area with ran-dom position and orientation, where they cannot perceive the nest or prey areas. Once the experiment starts, they search for the nest and the prey. When both areas have been located they try to forage from one area to the other endlessly. Note that the random initialization outside the nest area has been chosen because of two main reasons: (i) the physical robots could not be initialized at the very same time1 in the nest area, given the small nest radius and (ii)
we wanted the robots to start their foraging without any knowledge about the areas in the arena. Therefore, although based on a foraging strategy, the experiments presented could be easily extended to, for example, a col-lective cleaning or colcol-lective rescue experiment.
(a) (b)
PREY
PREY NEST
PREY
PREY
Fig. 1 a Asymmetric experimental setup: one prey is closer to the nest than the other, b Symmetric experimental setup: the two prey are at the same distance from the nest
Fig. 2 a One e-puck robot, b The 10 e-puck robots used in the experiments
3.2 Robot hardware
For the experiments, we have used the e-puck robot (see Fig. 2). E-pucks are modular, robust and non-expensive
robots designed by Mondada et al. (2009) for research and educational purposes. They are small wheeled cylindrical robots, 7 cm in diameter, whose mobility is ensured by a differential drive system.
The e-puck hardware and software are fully open source providing low-level access to every electronic device and offering extension possibilities . They are equipped with 8 infrared proximity sensors, a 3D accelerometer, a ring of 8 LEDs and a CMOS camera. Extension boards communi-cate with the main board through an I2C, SPI or RS232 bus. Finally, Bluetooth communication is available for programming the robot and communicating data to a computer or to other Bluetooth devices.
3.3 Communication hardware
We have equipped each robot with a local communication board, the E-puck Range & Bearing board (Gutiérrez et al. 2008a, 2009a). The board allows robots to communicate
This time initialization is used only for evaluation purposes.
Fig. 3 a Top and b bottom view of the E-puck Range & Bearing board
locally, obtaining at the same time both the range and the bearing of the emitter without the need for any centralized control or external reference. The E-puck Range & Bearing board is controlled by its own processor. A board includes 12 sets of IR emission/reception modules (see Fig. 3). Each of these modules is equipped with one infrared emitting diode, one infrared modulated receiver and one infrared photodiode3. A Manchester code is implemented because
the emitted energy is not dependent on the data. Therefore, any data sent at a certain distance is received with the same intensity. The implementation of the Manchester code allows a maximum data rate of 5 kbps. The range of communication can be software controlled from 0 to 80 cm.
4 Control architecture
4.1 The controller
The controller has been implemented using subsumption (Brooks 1986), a well-known behavior-based architecture. Each behavior is represented using an augmented finite state machine (AFSM). Each AFSM carries out an action and is responsible for its world perception.
In the controller, a clock is used by the robots to perform the odometry movement calculations. Moreover, the robots make use of the following sensors and actuators:
- Infrared sensors: 8 infrared sensors are distributed around the robot's perimeter. They are used to detect the presence of obstacles or any neighbors with whom the robots can communicate.
- Ground sensors: 3 infrared sensors are located in the lower-front part of the robot. Robots differentiate the areas depending on the color of the ground. The nest is represented as black, prey as gray and the rest of the arena as white.
For an exhaustive description of the board see http://www. rbz.es/randb/.
- RANDB emitter and receiver: the E-puck Range &
Bearing board.
- Motors: the two differential drive motors.
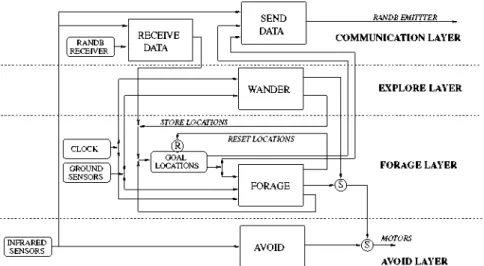
Figure 4 shows the architecture diagram of the con-troller. Each layer corresponds to a robot behavior. The arrows connect the different AFSMs, the suppressor and reset signals. The AFSMs are described below:
- Avoid: the state machine returns a vector taking into account all the IR sensors above a certain threshold. The direction sent to the motors is the opposite of this vector.
- Forage: the robot has location information about both the nest and the prey areas. It moves from nest to prey and back following the shortest path. If the robot arrives at one of the two areas, detected by the ground sensors, it stores the new estimated position and goes toward the other area. If the robot arrives at a place where the area was supposed to be but is not, it resets its Goal Locations memory. As a consequence, the robot enters the wander AFSM.
- Wander: the robot carries out a random walk. If a nest or prey area is found, the robot stores its position in its
Goal Locations memory.
- Receive Data: the robot translates the information received into its own reference axis.
- Send Data: the robot transforms the information to communicate according to the common reference axis (communication axis), and sends it to its neighbors.
The robots are initially located at random positions inside a fixed area in the center of the arena. Inside this area robots perceive neither the nest nor the prey areas. Once a robot finds the nest or the prey, it stores its position and continues with a random walk until it finds the other area. When both areas have been located, the robots try to go from one area to the other endlessly. Because of the movement integration errors, robots might arrive at some coordinates where they estimate the area should be located but it is not. If this happens, a robot considers itself lost, resets its estimated location and starts a random walk until it finds both areas again. On the other hand, if a robot correctly arrives at one of the areas, it updates the area position coordinates.
Fig. 4 The behavior structure of the foraging agents for a controller with communication defined by four levels of competence (layers) and five AFSMs (rectangles). The suppressor operators are represented by circles with an S enclosed, while the reset is represented by R
INFRARED , S E N S O R S ,
RANDB RECEIVER
RECEIVE DATA
SEND DATA
GROUND SENSORS
STORE LOCATIONS
t
!__( GOAL LOCATIONS
RESET LOCATIONS
RANDB EMITTTER
COMMUNICATION LAYER
EXPLORE LAYER
FORAGE LAYER
-©-AVOID
AVOID LAYER
X axis (Robot's heading) v
ROBOT
AREA A
Communicated direction
XJAxis (Robot's heading)
Communication axis
Fig. 5 Robots sharing information about the estimated location of area A. Robot i has previously visited area A and communicates its estimates (dyl and </>') to robot j
step, robot i transmits its estimate of the distance dy and direction <\>l of area A to robot j . For the direction, the value transmitted is the angle a, obtained from <j>t using the communication beam as reference axis: a — <\>l — y\ where y' is the bearing provided by the E-puck Range &
Bearing board. In a second step, robot j transforms the
received data into its own coordinates system. First, it calculates the direction provided by robot i as
(¡/ — y1 + a — 7i, followed by the calculation of the loca-tion (J?, y*) of area A:
j? = )}icos(yi) + dylcos((ft)
Sp = tf'sinly') + dylsin{(jJ) (1)
where X'J is the range provided by the E-puck Range &
Bearing board.
4.2 The social generalized induced fermi filter
The Social Generalized Induced Fermi Filter (SGIFF) is a filter inspired by the Kalman Filter (KF) equations
induced by the spectral norm of the error covariance matrix. Its main idea is to obtain a scalar value which represents the uncertainty a robot has about its estimates (confidence level). The SGIFF allows the robots to evaluate the information they have with respect to the information provided by their neighbors by means of a confidence-level parameter proportional to the distance travelled. Based on this confidence level, the robots are able to update their estimate state vector with the infor-mation provided by other robots without the use of any movement error model. Therefore, depending on the confidence-level ratio, the robots will adopt or ignore the information offered by their neighbors (see Gutiérrez et al. 2009b for more details).
The SGIFF can be explained as follows. Let the state vector of the robot i at time k be
xt — xt y't
ei
(2)where x\ and y\ are the robot's Cartesian coordinates and
ffk its orientation.
Robots use dead-reckoning to estimate and reach the nest and prey locations. When robot i finds the nest or the prey, it stores its a priori estimated location information (its actual position and orientation) as x k\k-\ and x :prey,i
k\k-V
respectively. Additionally, the robot keeps track of the distance travelled since it left the nest or the prey denoted by PM^ and /^¡^.'J, respectively, which represents the inverse of the a priori confidence level the robot has about its estimated information (see Fig. 6). While the robot is moving, the uncertainty about its location grows (Smith and Cheeseman 1987; Feng et al. 1994). Therefore, its confidence level decreases.
prey,]
NEST
inverse of their confidence levels. x ^ J j represents the a priori ipreyj represents the estimated nest position of robot i at time k and x ^
a priori estimated prey position of robot j at time k. The robots keep track of the distance travelled as the inverse of the confidence levels ( nest,i , vreyj*
Ak\k nestj
Pk\k
^k\k jrey
Jk\k prey,i
~ Ai | i - 1 nestj
— Pk\k-\
_ OPrey,' ~ *k\k-\ _ rpreyt — Pk\k-\
(3)
In the next step (k + 1), the a priori estimated goal locations are updated with the robot's movement in the time step duration (Axk+1), and the inverse of the a priori
confidence levels are updated with the distance travelled
(Ad'k+1) in the time step duration4: priest j priest,i
Xk+\\k ~ Xk\k nestj nestj
Pk+l\k ~Pk\k
-—-preyj -—-preyj
Xk+\\k ~~ Xk\k prey,i ^preyj
Pk+\\k ~ Pk\k
Ax\ k+\
Ad), k+\
Ax\ k+\ (4)
Jk+\\k Jk\k Ad), k+\
Therefore, if there is no encounter between the robots, the confidence level continues to decrease until the robot arrives at the nest or prey or until it gets lost.
If two robots meet, they communicate and update their estimates. In what follows, we show all the different goal location exchange
- None of the two robots know the goal locations: Robots do not exchange any information.
- One robot knows a goal location: Let us assume that robot i is the one which has previously visited the goal. and the inverse
--goal,i
Its a priori estimated location is x ^ ^ j
of its corresponding a priori confidence level is pgu^[ •
Robot j replaces its information with the one provided by robot i:
Note that when a robot spins in place we consider the distance traveled as the arc made by one of the wheels. Therefore, Ad'k+i = £?k+l • p / 2 , where p is the distance between the wheels (53 mm for the e-puck) and ¿JJ.+1 is the angular displacement made in the time step duration.
•¿goalj
Kk\k
~¡goal,i
Kk\k-\ goalj _ goal,i Pk\k Pk\k-\
(5)
Both robots know the goal location: In this case, the two robots exchange their information as follows:
SGIFFlx <¡goal,i
*k\k
goal,i _ cr,TPpir.Soal^ r,g°alj\
Pk\k -SGltt\Pk\k-vPk\k-\)
'¡goalj ggoalj goal,i goalj\ Sfc|i:-1> *LkVc-Vl'k\k-Vl'k\k-l)
(6)
Fig. 6 Robots information about the nest and prey areas and the J
„ „ . . ^.IliM í . . . t i l l LI
<¿goalj _ criTi'Ti'(^goalJ vg°al Xk\k — ¿U l r r \^XA|A-1' x>-i>.
a—,. goalj goalj k\k-VPk\k-VPk\k-\
„goalj
Pk\k
goalj goalj SGIFF[Pi^vPk]kZ
(7)
Note that pgoa'' values are not initialized until the robot
finds each area or a neighbor reports about its location. Once the robot has found one goal area, pgoal'' is set to 0. On the
other hand, a robot, to which a neighbor has communicated the area position, updates pgoal'' with the value offered by its
neighbor according to the SGIFF equations.
In order to produce an a posteriori guess location, each robot takes into account all information available, but weighs its sources in a different way. To calculate xgkT , we
adopt the so called pairwise comparison rule (Traulsen et al. 2006, 2007; Santos et al. 2006) often adopted in evolutionary/social dynamics studies, to code the social learning dynamics, which makes use of the Fermi distri-bution (see also Fig. 7):
"""" l (8)
where
1 +e
goaljj _
ngoal,ij
goalj
the
A vuui.ii vuui.i goalj j n
ÁPk\k-í=Pk\k-i-Pk\k-\ a n d P measures
importance of the relative confidence levels in the decision-making. For low values of /?, the decision-making proceeds
P = 0.03 P = 0.1 -— p = 0.3 P = 0.7
/ /
I / /
-100 -50 0
Ap
50 100
by averaging the confidence levels whereas for high values of /?, we obtain a pure imitation dynamics commonly used in cultural evolution (Hammerstein 2003) defined by a sharp step function. In the first case, the confidence level works as a small perturbation to a simple average between the two estimates, while in the latter, each robot is ready to completely ignore the estimate which has a smaller relative confidence level.
Hence, we use a weighted average to obtain the new location xgkT '' and inverse confidence level pgkT '' using the Fermi function:
-^goal,i _ i-, _ goal,i\^goal,i . soal,i f^goalj . ij\ /QN
Xk\k — \L Sk )Xk\k-\+6k yx-tyk-l^^k) \y)
goal,i _ i-, _ ngoal,i\ goal,i . eoal,i goalj /l f )N
Pk\k - \L 8k )Pk\k-l+8k Pk\k-\ \W>
Therefore, we observe that the SGIFF fuses the robot estimations based on their confidence levels. A better confidence level implies its associated measure will have a stronger weight on the filter performance. As we will see in Sect. 5, this simple mechanism makes collective decisions emerge in finding the closer goal area. This is because a closer goal gives shorter paths which have less uncertainty, and therefore they are chosen by the individuals. Typically, when ^pgM_1 ^ 0 robots average their estimated informa-tion about the locainforma-tion of the same goal area. On the other hand, there is a high probability that robots communicate information about different goal areas when ^ í f f - i is m
one of its ends. In that case, a robot adopts (Apg]M-\ ~> ° ° )
or ignores {^pgM_1 —> —oo) its neighbor estimates. When the two prey areas are located at different distances from the nest, robots coming from the nearest one {prey A) will have a better confidence level than those coming from the farthest one {prey B). The difference between confidence levels allows the robots coming from prey B to update their estimated location of prey B with that of prey A, favoring in this way the exploitation of the closest prey.
5 Experimental evaluation
In the following, we report results of simulated and real experiments and analyze the collective behavior of the robots.
5.1 Experiments in simulation
Our simulation platform is a fast, specialized multi-robot simulator for the e-puck robot. It has a custom rigid body physics engine, specialized to simulate only the dynamics in environments containing flat terrain, walls and holes.
This restriction allows for certain optimizations in the computation of the physics and thereby reduces the com-putational resources necessary for running simulations (see Christensen 2005 for more details).
In our simulations, an e-puck is modeled as a cylindrical body of 3.5 cm in radius that holds 8 infrared proximity sensors distributed around the body, 3 ground sensors on the lower-front part of the body and a range and bearing communication sensor. IR proximity sensors have a range of 5 cm, while the E-puck Range & Bearing module used for the communication has a range of 15 cm. For the three types of sensors, we have sampled real robot measurements and mapped the data into the simulator. Furthermore, we added uniformly distributed noise to the samples in order to simulate effectively the different sensors. ± 2 0 % noise is added to the infrared sensors and ± 3 0 % to the ground sensors. In the range and bearing sensor, noise is added to the range ( ± 2 . 5 cm) and bearing (±20°) values. Moreover, each message emitted can be lost with a probability that varies linearly from 1 % when the sender-receiver distance is less than 1 cm, to 50% when the two robots are 15 cm from each other. A differential drive system made up of two wheels is fixed to the body of the simulated robot. Errors have also been introduced into the encoder sensors chosen uniformly random in ± 2 0 % of the maximum movement at each time step for each wheel.
The simulator time steps are of 100 ms. At each time step, the robot senses the environment, runs the AFSMs and actuates. The robot speed has been limited to 6 cm/s when moving straight and 3 cm/s when turning. These values are also used with the real robots so as to allow comparing simulated and real experiments.
5.1.1 Experimental setup
As already mentioned, two different experimental setups (AES and SES) have been chosen to compare and study the convergence of the algorithm (see Fig. 1). Both setups are carried out in three different arenas where the dimensions and number of robots are changed as shown in Table 1.
Each experiment is repeated 30 times so as to allow sta-tistical analysis of the results.
5.1.2 General performance
The overall behavior of our controllers is a function of the parameter /?. As explained in Sect. 4.2, the value of this parameter determines the rate at which the robots adopt or ignore their neighbor's information. To assess the general impact of this value we have conducted a parameter study. We examined eight values defined by 10x, with x e {—5,
Table 1 Parameters describing the three arenas used in the
experiments A r e a d i m e n s i o n s ( m2}
Number of robots
Experiment duration (s)
Initial area radius (m)
Nest and prey radius (m)
AES: Nest location (x, y) (m)
AES: Prey 1 location (x, y) (m)
AES: Prey 2 location (x, y) (m)
SES: Nest location (x, y) (m)
SES: Prey 1 location (x, y) (m)
SES: Prey 2 location (x, y) (m)
retrieval task, that is, a task in which robots have to transport "virtual" items from the prey to the nest area. Each time a robot completes a run from the nest to the prey and comes back to the nest, we consider the robot has succeeded in its task and we count one more round trip. Figure 8 shows the number of round trips made by all the robots in the experiment for the two ESs in the three dif-ferent arenas for each f> value.
The figures show a similar shape for the different ESs and arenas. For fie {10~5, 10"4, 10"3} robots perform
poorly in the retrieval process. This is because the robots simply average the available information. This solution is suboptimal as it gives too much weight to the estimates with low confidence levels. For fi > 10~ , we observe a great improvement in the retrieval outcome. However, the optimal values are not those which imply pure imitation, but a combination of both robots' information. This is because every robot has useful information about the areas' location. Useful information means that even an estimate with low confidence can be of value, especially if the confidence levels of the two estimates are close to each other or if the estimate of higher confidence is defective. Therefore, better solutions are those which take into account the estimates of all the robots and weigh them in a different way.
5.1.3 Experimental results
To analyze the self-organizing properties of the filter, we evaluated three different values for fi (fi e {10~2, 10- 1, 1})
in the three arenas for the two ESs.
Asymmetric collective choice. In this test, robots are
initialized in the AES. The robots start their random walk in the center of the arena. Once the nest and one prey are located, the robots try to forage from nest to prey endlessly. If a robot finds an obstacle (robot or wall) while foraging, it tries to communicate with it. Then, if the obstacle is still present, the robot moves away of the obstacle until it is not
Arena 1
1.2 x 1.7
10
1800
0.2
0.1
(0.45, -0.75)
(-0.45, 0.75)
(-0.45, -0.75)
(-0.45, 0.0)
(0.45, 0.75)
(0.45, -0.75)
Arena 2
3.0 x 4.25
50
7200
0.5
0.1
(1.1, -1.7)
(-1.1, 1.7)
(-1.1, -1.7)
(-1.1, 0.0)
(1.1, 1.7)
(1.1, -1.7)
Arena 3
6.0 x 8.5
100
7200
0.5
0.1
(2.2, -3.4)
(-2.2, 3.4)
(-2.2, -3.4)
(-2.2, 0.0)
(2.2, 3.4)
(2.2, -3.4)
detected anymore. In this way, the obstacle is avoided and the robot can continue with its foraging behavior.
Figure 9 shows the percentage of robots in the popula-tion that forage from one prey area or the other as a function of time for different fi values. A robot is consid-ered to belong to a path if it forages between the nest area and one prey area without getting lost. Remember, as shown in Sect. 4.1, that a robot is considered lost if it arrives at some coordinates where it estimates the goal area is located but it is not.
In the first few minutes of the experiments, the robots choose any of the two paths with equal probability, depending on the first prey area found. However, the shortest path starts recruiting more and more robots after some robots have already found both paths. On the longest path, we observe a reduction in the number of robots for-aging on it, arriving at zero in some of the trials. The recruitment on the shortest path, in any of the different configurations, increases rapidly and non linearly. Note that the percentage of robots in the path is lower for the 10 robots in Arena 1 compared to the percentage of robots in the other arenas. The reason is that there are not enough robots in the arena to communicate in short periods of time. A robot density study is reported in Sect. 5.3 to clarify this issue.
Once the foraging has reached its equilibrium, we count the number of robots on the shortest path for each exper-iment. Figure 10 shows the percentage of experiments in which the robots select the shortest path for all the repli-cations and all the fi values tested in each arena. Note that this percentage of traffic is not taken from the total popu-lation but from the number of robots not considered lost. In this situation, we observe that the swarm chooses the shortest path in most of the experiments (100% for the experiments in Arena 2 and Arena 3 and 90% for the experiment in Arena 1).
(a) AES on Arena 1
a)
Q.
K § ^ CM • D
C 3 o O ^ cr ^
CD - Q
(c)
T3 C
O
CD . Q
(e)
C
.0- £
T3 C
O
oc
CD . Q
J H U
10"5 10"4 10"J 10"¿ 10"1 1 10 100
P values
AES on Arena 2
e
10"5 10"4 10"d 10"¿ 10"1 1 10 100
p values
8
Ú '
AES on Arena 3
n ¥ 8 É S
1 <
?
10"5 10"4 10"3 10"2 10"1 1
p values
10 100
(d)
CO Q .
T3 C
O
CD . Q
SES on Arena 1
10"° 10"* 10"° 10
P values
10 100
*
SES on Arena 2
T *
É f B
S ^ o
a
i
T
?
T
0
10"5 10"4 10"3 10"2 10"1 1 10 100
p values
10"° 10"* 10""
w
d
Trip
s
250
0
c o =3 9
-o w
rr
o . o
CD I R "
-Q
E • 3
Z o -g
4
SES
0
-• r
n °
u
on Arena 3
i 6
a
¡ 0
i
o o
10"¿ 10"1 1 10 100
p values
Fig. 8 Retrieval results for the different ESs and arenas tested in simulation (30 replications for each boxplot). Each box comprises observations ranging from the first to the third quartile. The median is
indicated by a horizontal bar, dividing the box into the upper and lower part. The whiskers extend to the farthest data points that are within 1.5 times the interquartile range. Outliers are shown as circles
(a) i
Robots foraging / f r o m t h e farthest prey
500 1000
Time (s)
(b)I
Robots foraging f r o m t h e closest prey
( c ) l
O
Fig. 9 Percentage of simulated robots foraging in the two paths for the asymmetric experimental setup (AES) and different /? values: a Arena 1 (jff = 1), b Arena 2 (jff = 10"1) and c Arena 3 (jff = 10"2)
(a)s
n p = 1 o-
-• |3=1(T D |3=1
^ C L _ ^
(b)
Q _
0-20 20-40 40-60 60-80 80-100
% Traffic on shortest path
WJ)
(J)
c
fl)
b
fl) CJ X
v°
o H o .
CO
ID
O
-= 1<T = 10"' = 1
(c)
0-20 20-40 40-60 60-80 80-100
% Traffic on shortest path
0-20 20-40 40-'
% Traffic on shortest i
Fig. 10 Distribution of the percentage of traffic on the shortest path for the simulated asymmetric experimental setup (AES) in a Arena 1, b Arena 2 and c Arena 3 (30 replications). Lost robots are not considered in the dataset. For the experiments in Arena 2 and Arena 3,
at the end of each experiment all the robots not considered lost are foraging using the shortest path. For Arena 1, more than 80% of the experiments end up with most of the robots (80-100%) foraging using the shortest path
(a).
o
(b),
^
With communication Without communication
Experiment type
(c),
With communication Without communication
Experiment type
-•±-With communication -•±-Without communication
Experiment type
Fig. 11 Percentage of simulated robots foraging in the two paths for the asymmetric experimental setup (AES) in a Arena 1, b Arena 2 and c Arena 3 for the experiments with and without communication
(30 replications). For the three arenas, the experiments in which the robots do not communicate obtain a poor foraging performance
meet (typically in the vicinity of the nest), they exchange their information according to the SGIFF. A robot that uses the shortest path, statistically has a better confidence level than the one using the longest one, because it has traveled a shorter distance since it left the prey area. This confidence-level difference makes the robots that use the shortest path ignore the other's information, and those using the longest path adopt the information from the robots using the shortest one. Encounters along the same path allow the robots to correct their location estimate errors according to the better information provided by robots that have a slightly better confidence level.
To study the improvement obtained through the robots' communication, we run the same experiments with a setup in which the robots do not communicate. Figure 11 com-pares the percentage of robots foraging in the two paths for the experiments with and without communication. Note that in the experiments without communication the robots are not able to create a path because the odometry errors are not collectively corrected. Therefore, the robots obtain a poor foraging performance.
Symmetric collective choice In this test, robots are
ini-tialized in the SES, where the two prey are at the same distance from the nest. Because of this symmetry, the robots cannot collectively choose one single preferred prey
based on the distance. In fact, when two robots arriving at the nest from different prey areas exchange their estimated prey information, the controller fuses the two robots' data sending the robot to an erroneous location at some point in between the two areas. In an ideal example, two robots which arrive at the nest from different prey areas that are at the same distance from the nest, will have the same confidence level value (j^^l\ =lfm-\)- Therefore,
= 0.5; hence x ^ ' ' = x f*k\k *k\k w
-k\k-i
vPrsyj _ k\k-i
(a):
Robots foraging from the chosen prey
500 1000 1500
Time (s)
( b )8
O
Robots foraging from the chosen prey
2000 4000 6000
Time (s)
( C )8
o
cc
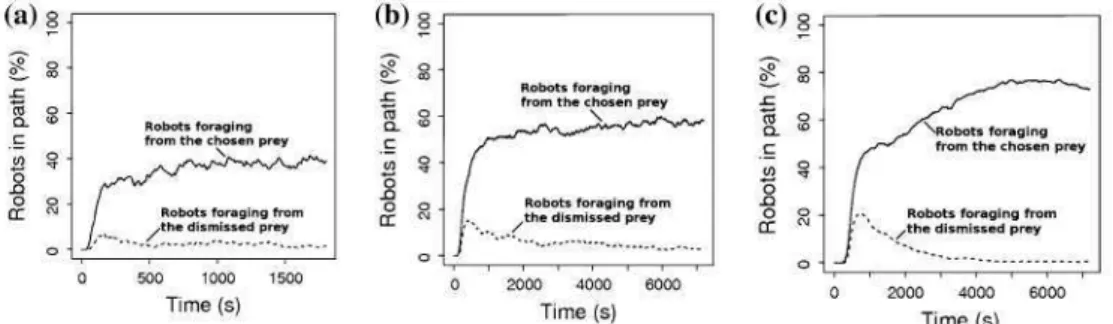
Fig. 12 Percentage of simulated robots foraging in the two paths for the symmetric experimental setup (SES) and different ft values: a Arena 1 (jff = 1), b Arena 2 (jff = 10"1) and c Arena 3 (jff = 10"2)
(30 replications). The chosen path is represented by the solid lines. In its steady state, we observe 40% of the swarm in the chosen path in Arena 1, 58% in Arena 2 and 75% in Arena 3
Fig. 13 Distribution of the percentage of traffic on the selected path for the simulated symmetric experimental setup (SES) in a Arena 1, b Arena 2 and c Arena 3 (30 replications). Lost robots are not considered in the dataset. For the three arenas robots choose with equal probability one prey area or the other
(a)e
• p • p • P
= 10""' = 10"'
= 1
(b)c
to I
LU n^D _rf] E¿] LU0-20 20-40 40-60 60-80 80-100
% Traffic on one path
l
= 10"' = 10"' = 1
i - i - n n ~ n
(c)
0-20 20-40 40-60 60-80 80-100
% Traffic on one path
xperiment
s
4
0
6
0
8
0
LU
° CM
r
b
b
II I
I I
I
DI
D
^ - n
rC
0-20 20-40 40-60 60-80 80-100
% Traffic on one path
(a).
CO O
O
(b)c
With communication Without communication
Experiment type o o
( 0 ,
i
With communication Without communication
Experiment type o
.Q O
With communication Without communication
Experiment type
Fig. 14 Percentage of simulated robots foraging in the two paths for the symmetric experimental setup (SES) in a Arena 1, b Arena 2 and c Arena 3 for the experiments with and without communication
(30 replications). For the three arenas, the experiments in which the robots do not communicate obtain a poor foraging performance
As in the asymmetric experiment, we run the same experiments with a setup in which the robots do not communicate. Figure 14 compares the percentage of robots foraging in any of the two paths in the experiments with and without communication. As in the AES, in the exper-iments in which the robots do not communicate, the swarm is not able to create a path because the odometry errors are not corrected.
5.2 Experiments with real robots
Experiments with real robots were carried out in Arena 1 (1.7 x 1.2 m2) with 10 e-pucks and lasted 1,800 s. Robots
start in a central round area of 0.2 m radius with random position and orientation. Data collection is managed
ground sensors. The communication range of the E-puck
Range & Bearing board has been limited to 15 cm, as in
the simulation experiments, to avoid the IR signals spread over the arena.
We selected f$ = 1 from the simulation results and ported the controller to the real robot. Figure 15a shows results of the exploration of the robots as a function of time for the AES. We observe that robots are able to collectively choose to forage from the closest prey, where more than 80% of the robots not considered lost end up foraging using the shortest path (see Fig. 15b). Note that in 7% of the experiments, less than 20% of the foraging robots were using the shortest path. This situation was observed in experiments in which a small percentage of robots (fewer than three robots) were foraging in the arena while the rest of the group was lost. If we look at Fig. 15a and b simul-taneously, we observe that on average 4-5 robots are lost, 4-5 robots are foraging using the shortest path and 1 robot is foraging using the longest path. Finally, a comparison between the experiments with and without communication
Fig. 15 Results for the experiments with real robots in the asym-metric experimental setup (AES) and ft = 1 (30 replications). a Percentage of e-puck robots foraging in the two paths. In its steady state we observe 45% of the population using the shortest path. b Distribution of the percentage of traffic on the shortest path. Lost robots are not considered in the dataset. More than 80% of the robots
(a) g
£
8j
Robots foraging from t h e chosen prey O O 4 / Robots foraging from
CL j t h e dismissed prey
0 500 1000 1500
Time (s)
Fig. 16 Results for the experiments with real robots in the symmetric experimental setup (SES) and ft = 1 (30 replications), a Percentage of e-puck robots foraging in the two paths. In its steady state we observe 35% of the population using the chosen path, b Distribution of the percentage of traffic on the selected path. Lost robots are not considered in the dataset. Robots choose with equal probability one
is shown in Fig. 15c. We observe that the robots obtain a poor foraging performance in the experiments without communication as already observed in the simulation experiments. Figure 16 shows results of the experiments in the SES. As already observed in the experiments with simulated robots, the swarm is able to collectively choose one of the two prey area offered.
Notice that there are quantitative differences between the real and the simulated experiments. These differences are mainly due to the imperfect communication model of the range and bearing sensor implemented in simulation. Another problem is the reflection caused by the borders of the arena that distort some of the bearing measurements when robots are near the borders. Moreover, we have observed some interferences between the range and bearing sensor and the IR proximity sensors. These alterations in the range and bearing produce extra errors not modeled in the simulation, which make the robots miscalculate the information given by other neighbors. However, we observe the same behavior in all the qualitative measures
that are not lost are foraging using the shortest path at the end of the experiment, c Comparison of the percentage of robots foraging on the two paths for the experiments with and without communication. The robots obtain a poor foraging performance in the experiments without communication
prey area or the other. Once collectively chosen, less than 5% of the robots forage using the other path, c Comparison of the percentage of robots foraging in the two paths for the experiments with and without communication. The robots obtain a poor foraging performance in the experiments without communication
(a),
Robots foraging from t h e closest prey
\
Robots foraging / f r o m t h e farthest prey
500 1000 1500
Time (s)
0>)i (c)
0-20 20-40 40-60 60-80 80-100
% Traffic on shortest path
O) Ol
o w o o
ÜC
^i-o CM
With communication Without communication
Experiment type
(b):
0-20 20-40 40-60 60-80 80-100
% Traffic on one path
With communication Without communication
Table 2 Parameters used for the robot density study (a) AES on Arena 1 Arena 1 Arena 2 Arena 3
Initial number of robots
Final number of robots
Number of robots step
dmm (m)
5
70
5
0.9
and only a decrease of less robots foraging in the chosen
than 10
200
10
2.2
10% in
20
320
20
4.4
the number of or shortest path.
.c
CO
Q.
(1)
0
£ o o ce
5.3 Robot density study
For a better understanding of the robot behavior, we run a set of experiments in simulation where we modified the number of robots at run time. In these experiments, we only use the Asymmetric Experiment Setup. The number of robots used in the experiments is given in Table 2: in Arena 1 are used from 5 to 70 robots with 5-robot steps, in Arena 2 from 10 to 200 robots with 10-robot steps and in Arena 3 from 20 to 320 robots with 20-robot steps. Notice that the number of robots is different because of the arena dimensions. In Arena 3, a swarm with few robots could not communicate in short periods of time and the robots would therefore get lost. On the other hand, a swarm with a high number of robots in Arena 1 would create a crowded environment in which the robots could not move.
Results (see Fig. 17) show that the percentage of robots in the shortest path depends on the number of robots in the arena. We observe two situations in which less than 50% of the total number of robots are foraging using the shortest path. In the first situation, there are not enough robots in the arena so it is difficult for them to communicate in short periods of time. Therefore, the robots are not able to correct their estimates and most of them get lost. This happened when there were less than 10 robots in Arena 1, 20 robots in Arena 2 and 30 robots in Arena 3.
Let us define the parameter q> as:
N 9 =
d„ (11)
where N is the number of robots in the experiment and d^n is the distance between the nest and the closest prey.
If we compare this number of robots with the distance between the nest and the closest prey, we observe there is a lower bound in which cpn¿n ~ 10. The second situation is
when there are so many robots that the number of collisions increases and the robots do not maintain themselves in the path. This situation is found for more than 45 robots in Arena 1, 110 robots in Arena 2 and 200 robots in Arena 3. These values give an upper bound of <pmax — 50.
More-over, we observe an optimum value of q>opt ~ 25 that
makes more than 80% of the robots in the experiment
(b),
CO D .
O
o
n o
CC
5 10 20 30 40 50 60 70
Number of robots in experiment
AES on Arena 2
1 ) ) J 5
10 30 50 70 90 110 130 150 170 190
Number of robots in experiment
AES on Arena 3
60 100 140 180 220 260
Number of robots in experiment
Fig. 17 Percentage of simulated robots foraging using the shortest path. Results for the different arenas tested are displayed (30 replications for each boxplot). Each box comprises observations ranging from the first to the third quartile. The median is indicated by a horizontal bar, dividing the box into the upper and lower part. The whiskers extend to the farthest data points that are within 1.5 times the interquartile range. Outliers are shown as circles
forage in the shortest path. (Table 3 shows cpmin, <pmax a nd
cpopt results for the three arenas).
Table 3 Results of the robot density study
Minimum number of robots
V'min
Optimum number of robots
<Popt
Maximum number of robots
V'max
Arena 1
10
11.11
20
22.22
45
50.00
Arena 2
20
9.09
60
27.27
110
50.00
Arena 3
40
9.09
100
22.72
200
45.45
(a) AES on Arena 1
behavior. However, a study about the relationship between the arena size and the number of robots becomes complex because it depends on many factors: the position where the robots are initialized, the location of the prey and nest areas, the number of robots already in the path, etc. Nevertheless, we have studied the recruitment behavior; that is, we have studied the time it takes for all the robots to locate the nest and prey areas at least once. Notice that the information transmitted by other robots could be erroneous because of the odometry errors. Therefore, we can not consider this information as a success of localization (recruitment) (see Nouyan et al. (2009)). Hence, a robot must arrive to both the nest and the prey areas to consider a recruitment success. As deduced from the controller behavior, a robot which has found one or both areas is able to recruit other robots by communicating the goals location. In our results, we observe that for small group sizes the robots have dif-ficulties to encounter and communicate. Therefore, the robots are not recruited toward the nest or prey areas as fast as expected. On the other hand, for large group sizes, the robots' movement inside the arena becomes difficult because of the collisions. Hence, not all the robots are able to locate both areas for the experiment duration. Figure 18 shows results about the recruit-ment process for the three different arenas. Minimum recruitment time values were observed for 20 robots for Arena 1, 60 robots for Arena 2 and 100 robots for Arena 3.
6 Conclusions
We have presented an experimental study of a collective choice mechanism that results from a simple control architecture. The robots rely on their odometry and on local communication to adopt/ignore information given by their neighbors. We have conducted a foraging experiment where robots collectively and in a self-organized manner choose one resource site (prey) and virtually transport items to a home (nest). We have considered two experi-mental setups: (i) an asymmetric experiexperi-mental setup, where
(c)
0
e a ?
5 10 20 30 40 50 60
Number of robots in experiment
AES on Arena 2
70
10 30 50 70 90 110 130 150 170 190
Number of robots in experiment
AES on Arena 3 O O -g. _ _ _ _
° o 8 °
I o S
\ '
- m
- ? y tj y
P
? i
20 60 100 140 180 220 260
Number of robots in experiment
300
Fig. 18 Time used for the recruitment process in the different arenas and with the different numbers of simulated robots tested (30 replications for each boxplot). Each box comprises observations ranging from the first to the third quartile. The median is indicated by a horizontal bar, dividing the box into the upper and lower part. The whiskers extend to the farthest data points that are within 1.5 times the interquartile range. Outliers are shown as circles
In a simulated environment, we have first studied in a retrieval task the impact of the /? parameter, which deter-mines the importance of the relative confidence levels in the decision-making. We have tested our controller in three different arenas using the two experimental setups. We have observed two main phenomena. On the one hand, once a trail becomes by chance a little stronger than the other, it is followed more accurately, and is thus more reinforced. On the other hand, the shorter a path, the stronger it is on average. This is because they get higher weights (better confidence levels) when fusing the esti-mates. The combination of these two phenomena leads to a collective choice in favor of the nearest source.
In general, our controller achieves a good performance both with real and simulated robots. However, a small difference between the real and simulated experiments has been observed in the quantitative measures. This difference is because of the sensor modelling and the non-systematic errors in the robot's movement. The experiment with real robots could be improved by increasing the number of robots. This would imply more frequent information shar-ing and therefore a better real robot performance, as explained in Sect. 5.3.
Our strategy shows two desirable properties typical of swarm robotics systems: (i) scalability and (ii) robustness to noisy conditions. Scalability has been directly tested in the simulation experiments, while robustness has been tested in the real experiments.
An interesting extension to our controller would be a mechanism that allows experimentation in environments that include obstacles. Finally, it would be interesting to study the on-line tuning of parameter /?.
Acknowledgments A. Campo and M. Dorigo acknowledge support from the Belgian F.R.S.-FNRS, of which they are a Research Fellow and a Research Director, respectively. This work was partially sup-ported by the Gestión de la Demanda Eléctrica Doméstica con Energía Solar Fotovoltaica project, funded by the Plan Nacional de I + D + i 2007-2010 (ENE2007-66135) of the Spanish Ministerio de Educación y Ciencia and the N4C—Networking for Challenged Communications Citizens: Innovative Alliances and Test beds project, funded by the Seventh Framework Program (FP7-ICT-223994-N4C) of the European Commission. The information provided is the sole responsibility of the authors and does not reflect the European Commission's opinion. The Spanish Ministry and the European Commission are not responsible for any use that might be made of data appearing in this publication.
References
Balch T, Arkin RC (1994) Communication in reactive multiagent robotic systems. Auton Robots 1(1): 1-25
Beckers R, Deneubourg J-L, Goss S (1992) Trails and U-turns in the selection of a path by the ant Lasius niger. J Theor Biol 159(4):397^15
Bonabeau E, Dorigo M, Theraulaz G (1999) Swarm intelligence: from natural to artificial systems. Oxford University Press, New York
Brooks RA (1986) A robust layered control system for a mobile robot. IEEE J Robotics Autom 2(1): 14-23
Burgard W, Fox D, Hennig D, Schmidt T (1996) Estimating the absolute position of a mobile robot using position probability grids. In: Proceedings of the Thirteenth National Conference on Artificial Intelligence. AAAI Press/MIT Press, Cambridge, pp 896-901
Burgard W, Derr A, Fox D, Cremers AB (1998) Integrating global position estimation and position tracking for mobile robots: the dynamic Markov localization approach. In: Proceedings of the IEEE International Conference on Intelligent Robots and Sys-tems, IEEE Press, Piscataway, pp 1-6
Camazine S (1993) The regulation of pollen foraging by honey bees: how foragers assess the colony's need for pollen. Behav Ecol Sociobiol 32(4):265-273
Camazine S, Deneubourg J-L, Franks NR, Sneyd J, Theraulaz G, Bonabeau E (2003) Self-organization in biological systems. Princeton studies in complexity. Princeton University Press, Princeton
Campo A, Nouyan S, Birattari M, GroB R, Dorigo M (2006) Negotiation of goal direction for cooperative transport. In: Ant colony optimization and swarm intelligence, 5th International Workshop, ANTS 2006, Brussels, Belgium, September 4-7, 2006, Proceedings. Lecture Notes in Computer Science. Springer, Berlin, pp 191-202
Cassandra AR, Kaelbling LP, Kurien JA (1996) Acting under uncertainty: Discrete Bayesian models for mobile-robot navigation. In: Proceedings of the IEEE International Conference on Intelligent Robots and Systems. IEEE Press, Piscataway, pp 963-972 Chong K, Kleeman L (1997) Accurate odometry and error modelling
for a mobile robot. In: Proceedings of the IEEE International Conference on Robotics and Automation. IEEE Press, Piscata-way, pp 2783-2788
Christensen AL (2005) Efficient neuro-evolution of hole-avoidance and phototaxis for a swarm-bot. Tech. Rep. 2005-014, IRIDIA, Université Libre de Bruxelles, Brussels, Belgium
Corradi P, Schmickl T, Scholz P, Menciassi A, Dario P (2009) Optical networking in a swarm of microrobots. In: Cheng MX (ed) NanoNet. Lecture Notes of the Institute for Computer Sciences, Social Informatics and Telecommunications Engineering. Springer, pp 107-119
Crailsheim K (1992) The flow of jelly within a honeybee colony. J Comp Physiol B 162(8):681-689
Deneubourg J-L, Aron S, Goss S, Pasteéis JM (1990) The self-organizing exploratory pattern of the Argentine ant. J Insect Behav 3(1):159-168
Dudek G, Mackenzie P (1993) Model-based map construction for robot localization. In: Proceedings of Vision Interface. CIPPR Society Press, Toronto, pp 97-102
Feng L, Borenstein J, Everett H (1994) Where am I? Sensors and methods for autonomous mobile robot positioning. University of Michigan Press, Ann Arbor
Grabowski R, Navarro-Serment L, Paredis C, Khosla P (2000) Heterogeneous teams of modular robots for mapping and exploration. Auton Robots 8(2):293-308
Gutiérrez A, Campo A, Dorigo M, Amor D, Magdalena L, Monasterio-Huelin F (2008a) An open localization and local communication embodied sensor. Sensors 8(ll):7545-7563 Gutiérrez A, Campo A, Santos FC, Pinciroli C, Dorigo M (2008b)
Social odometry in populations of autonomous robots. In: Ant Colony Optimization and Swarm Intelligence, 6th International Conference, ANTS 2008, Brussels, Belgium, September 2008, Proceedings. Lecture Notes in Computer Science. Springer, Berlin, Germany, pp 371-378
miniaturized board for local communication in swarm robotics. In: Proceedings of the IEEE International Conference on Robotics and Automation. IEEE Press, Piscataway, pp 3111— 3116
Gutiérrez A, Campo A, Fernández D, Monasterio-Huelin F, Magdalena L, Dorigo M (2009b) Social odometry: a self-organized distrib-uted location algorithm. Tech Rep 2009-014, IRIDIA, Université Libre de Bruxelles, Brusseles, Belgium
Gutiérrez A, Campo A, Santos FC, Monasterio-Huelin F, Dorigo M (2009c) Imitation based odometry in collective robotics. Int J AdvRobSys6(2):129-136
Gutmann J, Weigel T, Nebel B (2001) A fast, accurate, and robust method for self-localization in polygonal environments using laser-rangefinders. Adv Robotics J 14(1): 1-17
Gutmann JS, Weigel T, Nebel B (1999) Fast, accurate and robust self-localization in polygonal environments. In: Proceedings of the IEEE International Conference on Intelligent Robots and Sys-tems. IEEE Press, Piscataway, pp 1412-1419
Hammerstein P (2003) Genetic and cultural evolution of cooperation. MIT Press, Cambridge
Kalman RE (1960) A new approach to linear filtering and prediction problems. Trans ASME J Basic Eng Ser D 82(1):35^15 Korst P, Velthuis H (1982) The nature of trophallaxis in honeybees.
Insectes Sociaux 29(2):209-221
Kurazume R, Hirose S, Nagata S, Sashida N (1996) Study on cooperative positioning system (basic principle and measure-ment experimeasure-ment). In: Proceedings of the IEEE International Conference on Intelligent Robots and Systems. IEEE Press, Piscataway, pp 1421-1426
Larsen T, Bak M, Andersen N, Ravn O (1998) Location estimation for autonomously guided vehicle using an augmented Kalman filter to autocalibrate the odometry. In: FUSION 98 Spie Conference. CSREA Press, Las Vegas, NV, pp 33-39
Liebig J, Heinze J, Holldobler B (1997) Trophallaxis and aggression in the ponerine ant, Ponera coarctata: implications for the evolution of liquid food exchange in the hymenoptera. Ethology 103(9):707-722
Martinelli A, Siegwart R (2003) Estimating the odometry error of a mobile robot during navigation. In: Proceedings of the 1st European Conference on Mobile Robots. Warszawa, Poland: Zturek Research Scientific Inst. Press, pp 218-223
Mataric MJ (1997) Learning social behavior. Robotics Auton Syst 20(2):191-204
McLurkin J, Smith J (2004) Distributed algorithms for dispersion in indoor environments using a swarm of autonomous mobile robots. In: Proceedings of the Seventh International Symposium on Distributed Autonomous Robotic Systems. Springer, Berlin, pp 131-142
Mondada F, Bonani M, Raemy X, Pugh J, Cianci C, Klaptocz A, Magnenat S, Zufferey JC, Floreano D, Martinoli A (2009) The e-puck, a robot designed for education in engineering. In: Proceedings of the 9th Conference on Autonomous Robot Systems and Competitions. IPCB-Instituto Politécnico de Cast-elo Branco, CastCast-elo Branco, Portugal, pp 59-65
Nouyan S, Campo A, Dorigo M (2008) Path formation in a robot swarm: self-organized strategies to find your way home. Swarm Intell 2(1): 1-23
Nouyan S, GroB R, Bonani M, Mondada F, Dorigo M (2009) Teamwork in self-organized robot colonies. IEEE Trans Evol Comput 13(4):695-711
Parker LE (1998) Alliance: an architecture for fault tolerant multirobot cooperation. IEEE Trans Robotics Autom 14(2): 220-240
Payton D, Daily M, Estowski R, Howard M, Lee C (2001) Pheromone robotics. Auton Robots ll(3):319-324
Payton D, Estkowski R, Howard M (2003) Compound behaviors in pheromone robotics. Robotics and Auton Syst 44(3):229-240 Purnamadjaja AH, Russell RA (2004) Pheromone communicate:
implementation of necrophoric bee behaviour in a robot swarm. In: Proceedings of the IEEE Conference on Robotics, Automa-tion and Mechatronics. IEEE Press, Piscataway, pp 638-643 Rekleitis I, Dudek G, Milios E (2001) Multi-robot collaboration for
robust exploration. Ann Math Artif Intell 31(l):7^-0
Rekleitis I, Dudek G, Milios E (2003) Probabilistic cooperative localization and mapping in practice. In: Proceedings of the IEEE International Conference on Robotics and Automation. IEEE Press, Piscataway, pp 1907-1912
Russell R (1995) Laying and sensing odor markings as a strategy for assisting mobile robots navigation tasks. IEEE Robotics Autom Mag 2(3):3-9
Russell R (1999) Ant trails—an example for robots to follow? In: Proceedings of the IEEE International Conference on Robotics and Automation. IEEE Press, Piscataway, pp 2698-2703 Santos FC, Pacheco JM, Lenaerts T (2006) Cooperation prevails
when individuals adjust their social ties. PLoS Comput Biol 2(10):el40
Schmickl T, Crailsheim K (2008) Throphallaxis within a robotic swarm: bio-inspired communication among robots in a swarm. Auton Robots 25(1):171-188
Simmons R, Koenig S (1995) Probabilistic robot navigation in partially observable environments. In: Proceedings of the International Joint Conference on Artificial Intelligence. Morgan Kaufmann, San Mateo, pp 1080-1087
Simon D (2006) Optimal state estimation: Kalman, H Infinity, and nonlinear approaches. Wiley, London
Smith RC, Cheeseman P (1987) On the representation and estimation of spatial uncertainly. Int J Robotics Res 5(4):56-68
Stella E, Musió F, Vasanelli L, Distante A (1995) Goal-oriented mobile robot navigation using an odour sensor. In: Proceedings of the Intelligent Vehicles Symposium. IEEE Press, Piscataway, pp 147-151
Svennebring J, Koenig S (2003) Trail-laying robots for robust terrain coverage. In: Proceedings of the IEEE International Conference on Robotics and Automation. IEEE Press, Piscataway, pp 75-82 Szymanski M, Breitling T, Seyfried J, Worn H (2006) Distributed shortest-path finding by a micro-robot swarm. In Ant Colony Optimization and Swarm Intelligence, 5th International Work-shop, ANTS 2006, Brussels, Belgium, September 4-7, 2006, Proceedings, Lecture Notes in Computer Science, Springer, Germany, pp 404^-11
Traulsen A, Nowak M, Pacheco J (2006) Stochastic dynamics of invasion and fixation. Phys Rev SerE 74(1):011,909.1-011,909.5 Traulsen A, Pacheco J, Nowak M (2007) Pairwise comparison and
selection temperature in evolutionary game dynamics. J Theo Biol 246(3):522-529
Valdastri P, Corradi P, Menciassi A, Schmickl T, Crailsheim K, Seyfired J, Dario P (2006) Micromanipulation, communication and swarm intelligence issues in a swarm microrobotic platform. Robotics Auton Syst 54(10):789-804
Vaughan R, St0y K, Sukhatme G, Mataric M (2002) LOST: localization-space trails for robot teams. IEEE Trans Robotics Autom 18(5):796-812
Wagner IA, Lindembaum M, Bruckstein AM (1999) Distributed covering by ant-robots using evaporating traces. IEEE Trans Robotics Autom 15(5):918-933
Wang CM (1988) Location estimation and uncertainty analysis for mobile robots. Auton Robot Veh 1(1):1230-1235