Glutamyl aminopeptidase in microvesicular
and exosomal fractions of urine is related
with renal dysfunction in cisplatin-treated rats
Andre´s Quesada1, Ana Bele´n Segarra2, Sebastia´n Montoro-Molina2, Marı´a del Carmen de Gracia1, Antonio Osuna1, Francisco O’Valle3, Manuel Go´ mez-Guzma´n2
, Fe´lix Vargas4, Rosemary Wangensteen2*
1 Unidad de Nefrologı´a, Hospital Virgen de las Nieves, FIBAO, Granada, Spain, 2 A´ rea de Fisiologı´a, Departamento de Ciencias de la Salud, Universidad de Jae´n, Jae´n, Spain, 3 Departamento de Anatomı´a Patolo´gica, IBIMER, Universidad de Granada, Granada, Spain, 4 Departamento de Fisiologı´a, Facultad de Medicina, Universidad de Granada, Granada, Spain
*rwangens@ujaen.es
Abstract
Purpose
The aim of this work was to investigate if the content of glutamyl aminopeptidase (GluAp) in microvesicular and exosomal fractions of urine is related with renal dysfunction in cisplatin-treated rats.
Methods
Urine samples were collected 24 hours after injection of cisplatin (7 mg/kg, n = 10) or saline serum (n = 10), and they were subjected to differential centrifugation at 1.000, 17.000 and 200.000 g to obtain microvesicular and exosomal fractions. GluAp was measured with a commercial ELISA kit in both fractions. Serum creatinine (SCr) and body weight were mea-sured 15 days after treatment. We analyzed if early excretion of GluAp in microsomal and exosomal fractions was correlated with final SCr and body weight increase. In a second experiment, enzymatic activities of GluAp and alanyl aminopeptidase (AlaAp) in urine, microvesicular and exosomal fractions were measured three days after injection. We ana-lyzed the correlation of both markers with SCr determined at this point. Finally, we studied the expression of GluAp and extracellular vesicles markers Alix and tumor susceptibility gene (TSG101) in both fractions by immunoblotting.
Results
GluAp excretion was increased in all fractions of urine after cisplatin treatment, even if data were normalized per mg of creatinine, per body weight or per total protein content of each frac-tion. We found significant predictive correlations with SCr concentration, and inverse correla-tions with body weight increase determined 15 days later. Three days after injection, amino-peptidasic activities were markedly increased in all fractions of urine in cisplatin-treated rats. The highest correlation coefficient with SCr was found for GluAp in microvesicular fraction. a1111111111 a1111111111 a1111111111 a1111111111 a1111111111 OPEN ACCESS
Citation: Quesada A, Segarra AB, Montoro-Molina
S, de Gracia MdC, Osuna A, O’Valle F, et al. (2017) Glutamyl aminopeptidase in microvesicular and exosomal fractions of urine is related with renal dysfunction in cisplatin-treated rats. PLoS ONE 12 (4): e0175462.https://doi.org/10.1371/journal. pone.0175462
Editor: Partha Mukhopadhyay, National Institutes
of Health, UNITED STATES
Received: October 13, 2016
Accepted: March 27, 2017
Published: April 11, 2017
Copyright:©2017 Quesada et al. This is an open access article distributed under the terms of the
Creative Commons Attribution License, which permits unrestricted use, distribution, and reproduction in any medium, provided the original author and source are credited.
Data Availability Statement: All relevant data are
within the paper and its Supporting Information files.
Funding: This study was supported by the grants
Increase of GluAp in microvesicular and exosomal fractions from cisplatin-treated rats was con-firmed by immunoblotting. Alix and TSG101 showed different patterns of expression in each fraction.
Conclusions
Determination of GluAp content or its enzymatic activity in microvesicular and exosomal frac-tions of urine is an early and predictive biomarker of renal dysfunction in cisplatin-induced nephrotoxicity. Measurement of GluAp in these fractions can serve to detect proximal tubular damage independently of glomerular filtration status.
Introduction
Early diagnosis of acute kidney injury remains to be a challenge nowadays. Traditional bio-markers, like serum blood urea nitrogen (BUN) or creatinine (SCr) start to rise when kidney has lost at least a 50% of its function [1,2] and they have been considered by some authors as delayed biomarkers [3].
Consequently, several biomarkers such as N-acetyl-β-D-glucosaminidase (NAG), kidney injury molecule-1 (KIM-1) or neutrophil gelatinase-associated lipocalin (NGAL) have been proposed during the last years as early markers of renal dysfunction in different pathologies, and urine is the most promising source of substances that can be related with the extent of kidney injury [4].
Cisplatin is an antineoplasic drug that induces nephrotoxicity as a collateral effect [5,6], and it has been widely used to evoke kidney injury in experimental models [7]. In previous works, we have demonstrated that urinary activities of aminopeptidasic enzymes, mainly alanyl (Ala) and glutamyl aminopeptidase (GluAp) are early increased in cisplatin-treated rats. [8,9].
Urine can contain extracellular vesicles (EVs) that are released from renal epithelium [10,11]. Although there is not a general consensus for classification criteria and isolation methods for the different kinds of EVs, differential centrifugation is the most commonly used method to isolate EVs from biofluids [10]. These EVs include exosomes, that are nanovesicles (30–120 nm) secreted by epithelial cells of urinary tract [12,13], and ectosomes, also referred as microvesicles (MVs), that are bigger (100–1000 nm) than exosomes and they are produced by the direct bud-ding of the plasma membrane [13]. Amount and composition of exosomes excreted in urine might be important in diagnosis of renal dysfunction, because they can constitute a noninvasive source of multiple disease biomarkers that could provide clinically useful information [14,15,16].
GluAp was identified in urinary exosomes using proteomic analysis [17], but the presence of this enzyme in microvesicles has not been studied. With this background, the aim of this work was to study if GluAp could be quantified in exosomal and microsomal fractions obtained by differential centrifugation of urine, and to analyze if the early excretion of this enzyme in the different fractions was related with renal dysfunction in cisplatin-treated rats.
Materials and methods
Experimental design
Twenty male Wistar rats with a weight from 175 to 234 g were purchased from Harlan Labora-tories (Barcelona, Spain) and distributed in two groups: control and cisplatin (n = 10 each group). Cisplatin (Sigma-Aldrich, Madrid, Spain) was dissolved in sterile saline solution (3.5 mg/ml). Animals of Cisplatin group were subcutaneously injected with 2 ml/kg of this solu-tion, receiving a dose of 7 mg/kg of cisplatin, while animals of Control group were injected
and analysis, decisio´n to publish, or preparation of the manuscript.
Competing interests: Rosemary Wangensteen,
with 2 ml/kg of sterile saline solution. Urine samples were taken in a metabolic cage during the next 24 h. 15 days after injection, blood samples were obtained from left ventricle under anes-thesia (pentobarbital, 50 mg/kg i.p.), centrifugated at 1000gduring 15 minutes at 4˚C, and fro-zen at -80˚C until analysis.
In a second experiment, twenty male Wistar rats purchased from Envigo (Barcelona, Spain) weighing from 360 to 469 g were distributed in Control and Cisplatin groups (n = 10 each group). Cisplatin group was injected with 7 mg/kg of cisplatin and Control group was injected with saline serum as described before. Urine and blood samples were collected three days after treatment, at the peak of cisplatin nephrotoxicity, and processed as described.
Ethics statement
All experimental procedures were performed in strict accordance with the European Union Guidelines to the Care and Use of Laboratory Animals. This study was approved by the Ethical Committee of the Universidad de Jae´n and Junta de Andalucı´a with the approval number 450– 5297. All surgery was performed under sodium pentobarbital anesthesia, and all efforts were made to minimize suffering.
Processing of urine samples
Isolation method of microsomal and exosomal fractions from urine was modified from Zhou et al. [18]. Urine samples were collected 24 hours after injection and centrifugated at 1000g, 10 minutes, 4˚C in order to separate whole cells, bacteria, cellular debris and other substances present in urine. Precipitates were discarded. Some aliquots of supernatants were frozen at -80˚C to determine creatinine. The rest of supernatant was treated with protease inhibitors. 1μl of 1 mM leupeptin and 50μl of 10 mM phenylmethylsulfonyl fluoride (PMSF) were added to each ml of supernatant.
Supernatants containing protease inhibitors were subjected to a second centrifugation step at 17000g, 15 minutes, 4˚C. Precipitates including microsomal fraction (microvesicles, ecto-somes, large membrane fragments) were redissolved in 0.5 ml of 20 mM HCl-Tris, pH 8.6 and frozen at -80˚C until processing.
Finally, supernatants were subjected to ultracentrifugation at 200000g, 1 hour, 4˚C. Precipi-tates containing exosomal fraction were redissolved in 0.3 ml of 20 mM HCl-Tris, pH 8.6, and frozen at -80˚C.
In the second experiment, urine samples were collected three days after injection and pro-cessed as described. Protease inhibitors were not added in order to determine GluAp and AlaAp enzymatic activities in supernatant, microvesicular and exosomal fractions.
Measurement of GluAp content
GluAp was measured in microsomal and exosomal fractions obtained from urine 24 hours after injection as previously described, using an ELISA kit from Sunred Biotechnologies (Shanghai, China). All samples and standards were measured in duplicate. Absorbances of all samples were inside the range of the standard curve (from 4 to 64 ng/ml). Concentration of GluAp in microsomal and exosomal fractions was divided by the corresponding factor and referred to the starting volume of urine.
Measurement of GluAp and AlaAp activities
(Sigma-Aldrich, Madrid, Spain) as substrates, respectively. 20μl of urine were incubated dur-ing 30 min at 37˚C with 80μl of substrate solution (10 mM L-glutamic acidγ-2-naphthylamide or 10 mM alanyl-2-naphthylamide in pH 8.7 50 mM HCl-Tris). Substrates had been previously dissolved in 1 ml of dimethyl sulfoxide and stored at -20˚C. The amount of 2-naphthylamine released as a result of the aminopeptidase activities was measured fluorimetrically at an emis-sion wavelength of 412 nm with an excitation wavelength of 345 nm, and quantified using a standard curve of 2-naphthylamine (0–200 nmol/ml). Fluorimetric data from samples and standard curve were taken each minute. Specific aminopeptidase activities were calculated from the slope of the linear portion of enzymatic assay, and expressed as nanomol of substrate hydrolyzed per minute per mg of urine creatinine (mU).
Measurement of creatinine and protein content
Creatinine and proteinuria was measured in supernatants from all samples of urine in a Spin120 autoanalyzer using reagents purchased from Spinreact (Barcelona, Spain).
Protein concentration in microsomal and exosomal fractions was measured in a 96-well microplate using a DC Protein Bioassay kit from Biorad Laboratories, Madrid, Spain.
Immunoblotting studies
50 ml of urine samples from control rats and 200 ml from cisplatin-treated rats obtained 3 days after treatment with cisplatin were pooled and subjected to the two-steps centrifugation at 17.000 and 200.000 g. Pellets were dissolved in 50 mM Tris-HCl (pH 6.8) containing 1.5% SDS. Total protein content was measured with DC Protein Bioassay kit from Biorad Laborato-ries, Madrid, Spain. 30μg of protein were subjected to SDS-PAGE, transferred to a nitrocellu-lose membrane, blocked with 1% casein (Bio-Rad Laboratories) and probed overnight at 4˚C with 1μg/ml of goat anti-GluAp-antibody (Everest Biotech, Upper Heyford, UK), 1μg/ml of rabbit anti-Alix-antibody (Sigma-Aldrich, Madrid, Spain) or 1μg/ml of rabbit
anti-TSG101-antibody (Sigma-Aldrich, Madrid, Spain). After washing, membranes were probed with 0.04μg/ml rabbit anti-goat horseradish peroxidase-linked IgG antibody (KPL Inc., Gai-thersburg, MD, USA) or 0.04μg/ml mouse rabbit horseradish peroxidase-linked IgG anti-body (KPL Inc., Gaithersburg, MD, USA) as secondary antibodies. Bands were visualized with ECL (Amersham, Amersham, UK) in a CCD camera image system.
Statistical analysis
We used t test for the analysis of variables with normal distribution and equal variances, Welch modification of t test was used for data with normal distribution and unequal variances and Mann–Whitney W (Wilcoxon) test was used to analyze the differences when data did not correspond to a normal distribution. Shapiro–Wilk test was used to analyze the normality of distributions. Differences were considered statistically significant at p<0.05 level.
Linear regressions were made with StatGraphics software to establish the correlation of GluAp or AlaAp in the different fractions with SCr and body weight increase.
Results and discussion
Cisplatin increased microvesicular and exosomal content of GluAp
Urinary markers are usually normalized per mg of urine creatinine, useful for spot samples, or per daily total excretion when data of diuresis are available. Nevertheless, alterations in glo-merular filtration are accompanied with a low excretion of urinary creatinine that could falsely increase the levels of urinary markers. Besides, alterations in diuresis can also influence the quantification of urinary markers, because differences in water content can affect biochemical determinations. In our study, cisplatin induced an increase in microvesicular and exosomal GluAp content normalized per mg of total protein in each fraction, implicating that nephro-toxic effect of cisplatin over tubular epithelia could be assessed independently of creatinine sta-tus or diuresis.
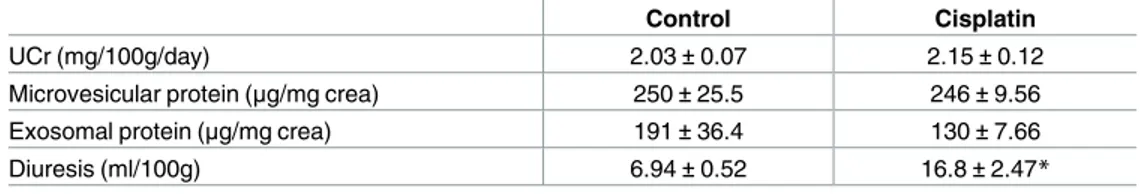
Besides, augmentation in GluAp excretion were not influenced in a high extent by creati-nine excretion or total protein content in each fraction, because there was not any difference in these variables between both groups of rats, although diuresis was significantly higher in cis-platin-treated rats (Table 1).
The high content of GluAp in exosomal and microsomal fractions that we have found in this study could be due to a direct effect of cisplatin over proximal tubule that would evoke a higher release of microvesicles and exosomes from this section of nephron where aminopepti-dasic enzymes are mainly expressed [19,20]. This could explain that microsomal and exosomal fractions were richer in GluAp content in cisplatin-treated rats than in control group. In this way, other authors have stated that exosomes may be the best source of biomarkers for renal tubulopathies,i.e. disorders that affect the function of renal tubule epithelia [12].
Microvesicular and exosomal content of GluAp was related with renal
dysfunction
Two weeks after injection, SCr concentration remained significantly increased in cisplatin-treated ratsvscontrol group, and body weight was decreased (Fig 3). We found significant
Fig 1. GluAp in microvesicular fraction. GluAp excretion in microvesicular fraction of urine samples from
Control and Cisplatin groups collected 24 hours after injection. Data were expressed in ng/mg creatinine (A), ng/100g/day (B) and ng/mg protein (C). Mean±SEM;*p<0.05,**p<0.01 Cisplatin vs. Control (n = 10 each group).
https://doi.org/10.1371/journal.pone.0175462.g001
Fig 2. GluAp in exosomal fraction. GluAp excretion in exosomal fraction of urine samples from Control and
Cisplatin groups collected 24 hours after injection. Data were expressed in ng/mg creatinine (A), ng/100g/day (B) and ng/mg protein (C). Mean±SEM;*p<0.01 Cisplatin vs. Control (n = 10 each group).
correlations between microvesicular and exosomal GluAp excreted 24 hours after cisplatin treatment and both parameters of renal damage-associated morbidity at the end of the experiment.
GluAp content in microvesicular fraction was significantly correlated with SCr and nega-tively correlated with body weight increase (Fig 4), indicating that the determination of this enzyme in microvesicles can also be an early marker of kidney injury.
Exosomal GluAp (ng/mg creatinine) showed a very strong correlation with SCr and body weight decrease (Fig 5). Correlation coefficient andp-value were higher than those obtained for soluble GluAp in a previous work [9], and they were also higher than those obtained for micro-vesicular GluAp (Fig 4andTable 2) or exosomal GluAp expressed in ng/100g/day or ng/mg of protein (Table 3). Therefore, in our study, quantification of exosomal GluAp in ng/mg of creati-nine was more related with renal dysfunction, probably because slight alterations in creaticreati-nine excretion can also contribute to later renal dysfunction. But correlation of exosomal GluAp expressed in ng/mg protein was also very strong (Table 3). Thus, it might also be a very useful marker in pathologies where evaluation of early tubular damage takes relevance.
In previous works, we found an early high increase in the excretion [9] or activity [8] of this enzyme in supernatant of urine from cisplatin-treated rats that were correlated with the extent of renal damage. Our previous studies also demonstrated that the increased excretion of GluAp was earlier than the excretion of other renal markers like NAG or NGAL [8]. Measurement of GluAp in exosomal and microsomal fractions can suppose a technical improvement with respect to analysis of urine, because samples are subjected to two centrifugation steps and pre-cipitates are dissolved in a buffer [18]. Therefore, interferences in the determination of bio-markers that can be evoked by the urea content, ionic strength or other components of urine are avoided. The high correlation that we found between the excretion of the enzyme in these urinary fractions with the augmentation in SCr concentration or body weight decrease can also constitute a useful tool to classify different levels of renal dysfunction.
GluAp and AlaAp activities were highly increased in urine,
microvesicular and exosomal fractions at the peak of toxicity
GluAp activity was highly increased three days after injection in urine supernatant, microvesi-cular and exosomal fractions from cisplatin-treated rats when data were normalized by urinary creatinine, body weight or total protein content of each fraction, and it was even increased per ml of urine (Table 4). This latter finding implicates that excretion of this marker is augmented independently of diuresis, creatinine concentration, body weight or protein content in all ana-lyzed fractions.
Table 1. Urinary variables 24 hours after injection.
Control Cisplatin
UCr (mg/100g/day) 2.03±0.07 2.15±0.12
Microvesicular protein (μg/mg crea) 250±25.5 246±9.56
Exosomal protein (μg/mg crea) 191±36.4 130±7.66
Diuresis (ml/100g) 6.94±0.52 16.8±2.47*
Urine creatinine excretion (UCr; mg/100g/day), microvesicular (μg/mg creatinine) and exosomal (μg/mg creatinine) protein content, and diuresis (ml/100g) in Control and Cisplatin groups 24 hours after injection. Data are expressed as mean±SEM.
*p<0.01 Cisplatin vs Control (n = 10 each group).
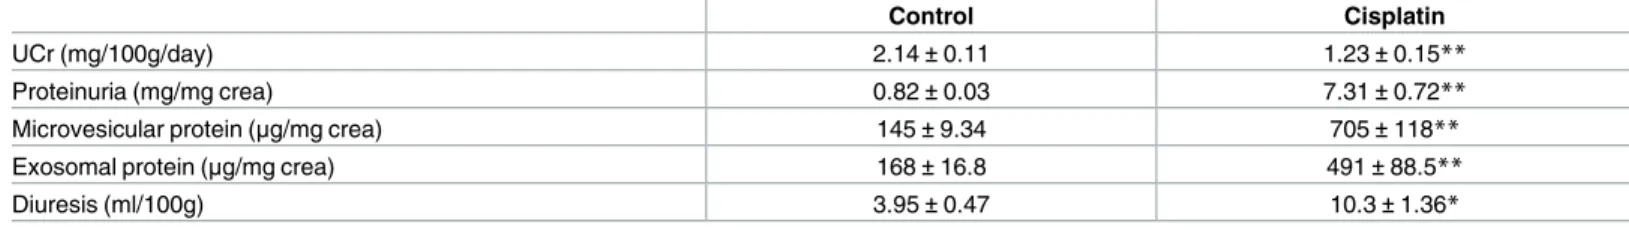
Interestingly, in this experiment, urinary creatinine excretion was decreased in cisplatin-treated group because of decreased glomerular filtration (Table 5). Therefore, in this situation, normalization of urinary markers by creatinine would falsely increase their urinary excretion. Note that the relative increase of GluAp per mg of creatinine is always higher than the relative increase of the enzyme when activity is normalized by body weight or total protein content of each fraction (Table 4). This finding remarks the needing of methods of quantification for spot samples other than normalization by creatinine concentration in order to study renal alter-ations of nephron segments independently of glomerular filtration status. In our study, we found a high excretion of GluAp per mg of protein in microvesicular and exosomal fractions that could be used to evaluate the extent of proximal tubular toxicity after cisplatin injection. Furthermore, cisplatin-treated rats displayed high proteinuria at this point (Table 5), and quantification of GluAp in supernatant fraction was falsely decreased when divided by super-natant protein.
It is also remarkable that GluAp remained increased in microvesicular and exosomal frac-tions of cisplatin-treated rats, although protein content was higher in both fracfrac-tions in this group (Table 5).
AlaAp activity, which has been described as an exosomal marker of proximal tubular dam-age [11,16] showed a very similar pattern to GluAp in Cisplatin group (Table 6).
Fig 3. SCr and body weight. SCr concentration (mg/dl) (A) and body weight increase (%) in Control and
Cisplatin groups at the end of the experiment. Individual samples and means±SEM are displayed;*p<0.05,
**p<0.001 Cisplatin vs. Control (n = 10 each group).
https://doi.org/10.1371/journal.pone.0175462.g003
Fig 4. Correlations with microvesicular fraction. Linear regressions between GluAp excretion (ng/mg
creatinine) in microvesicular fraction of urine samples collected 24 hours after injection with SCr concentration (mg/dl) (A) and body weight increase (%) (B) determined at the end of the experiment.
AlaAp and GluAp activities were highly correlated in supernatant, microvesicular and exo-somal fractions (Fig 6). These data clearly suggest that GluAp must also be considered as a marker of proximal tubular toxicity in these fractions.
GluAp activity were highly correlated with SCr at the peak of toxicity
Three days after injection, SCr was very increased and body weight was decreased (Fig 7), probably due to volume loss because of high diuresis. Correlation coefficients and p-values of GluAp and AlaAp in the different fractions with SCr at this point are shown inTable 7and Table 8, respectively. These correlations were stronger for GluAp in all studied fractions, and they were also stronger than correlations determined in the first experiment. The lowest corre-lations were found when data were normalized by total protein in supernatant fraction, further demonstrating that determinations of GluAp in microvesicular and exosomal fractions can be of interest to evaluate proximal tubular damage.
Exosomal fraction has been widely used for biomarkers research studies, and there are evi-dences of physiological and pathological roles of exosomes in the kidney, where regulate the co-functioning between different parts of the nephron, through secretion and reuptake of their contents such as mRNAs and miRNAs that can affect the function of the recipient cell [14,21]. Nevertheless, microvesicles have not received enough attention in biomarker research, although their secretion has been studied in some renal pathologies [22,23], and they also con-tain mRNA and miRNA that might play a role in transferring information in the kidney
Fig 5. Correlations with exosomal fraction. Linear regressions between GluAp excretion (ng/mg
creatinine) in exosomal fraction of urine samples collected 24 hours after injection with SCr concentration (mg/dl) (A) and body weight increase (%) (B) determined at the end of the experiment.
https://doi.org/10.1371/journal.pone.0175462.g005
Table 2. Correlations with microvesicular fraction.
r p
GluAp (ng/100g/day)
SCr (mg/dl) 0.4661 0.0383
ΔBody weight (%) -0.5882 0.0064
GluAp (ng/mg prot)
SCr (mg/dl) 0.4680 0.0374
ΔBody weight (%) -0.6275 0.0031
Correlation coefficient (r) and statistical significance (p) of linear regressions between GluAp excretion expressed in ng/100 g/day and ng/mg protein in microvesicular fraction of urine samples collected 24 hours after injection, with SCr concentration and body weight increase determined at the end of the experiment.
[24,25]. Obtention of microsomal fraction is easier and faster than exosomal fraction, and our results demonstrate that it can also constitute an important source of biomarkers related to renal dysfunction. The presence of GluAp and AlaAp in microvesicles, which has not been described in previous bibliography, can be related with the fact that microvesicles are origi-nated from direct budding of tubular cell membranes [22] that contain aminopeptidasic enzymes [19], and it cannot be discarded that large membrane fragments could also contribute to the increased enzymatic activities that we have found in this fraction.
Expression of GluAp, Alix and TSG101 in microvesicular and exosomal
fractions
Immunoblotting also demonstrated that GluAp was increased per mg of protein in microvesi-cular and exosomal fractions of urine from cisplatin-treated rats (Fig 8, left).
Table 3. Correlations with exosomal fraction.
r p
GluAp (ng/100g/day)
SCr (mg/dl) 0.6472 0.0020
ΔBody weight (%) -0.6264 0.0031
GluAp (ng/mg prot)
SCr (mg/dl) 0.6982 0.0006
ΔBody weight (%) -0.6887 0.0008
Correlation coefficient (r) and statistical significance (p) of linear regressions between GluAp excretion expressed in ng/100 g/day and ng/mg protein in exosomal fraction of urine samples collected 24 hours after injection, with SCr concentration and body weight increase determined at the end of the experiment.
https://doi.org/10.1371/journal.pone.0175462.t003
Table 4. GluAp activity in urine fractions.
Control Cisplatin Relative increase
Supernatant
GluAp (mU/ml) 0.58±0.09 2.35±0.26** 4.07
GluAp (mU/mg creatinine) 1.11±0.22 18.9±2.05** 17.0
GluAp (mU/100g/day) 2.45±0.54 22.4±2.84** 9.13
GluAp (mU/mg protein) 1.39±0.28 2.61±0.15* 1.88
Microsomal fraction
GluAp (mU/ml) 0.23±0.05 0.94±0.07** 4.12
GluAp (mU/mg creatinine) 0.42±0.09 8.23±1.27** 19.6
GluAp (mU/100g/day) 0.92±0.21 9.37±1.07** 10.2
GluAp (mU/mg protein) 2.95±0.68 12.2±0.67** 4.13
Exosomal fraction
GluAp (mU/ml) 0.10±0.03 0.38±0.04 3.70
GluAp (mU/mg creatinine) 0.19±0.05 3.34±0.59** 17.6
GluAp (mU/100g/day) 0.40±0.12 3.81±0.50** 9.45
GluAp (mU/mg protein) 1.19±0.34 7.01±0.55** 5.88
GluAp activity in supernatant, microvesicular and exosomal fractions of urine samples from Control and Cisplatin groups collected 3 days after injection. Data were expressed in mU/ml, mU/mg creatinine, mU/100g/day and mU/mg protein. Mean±SEM
*p<0.01
**p<0.001 Cisplatin vs. Control (n = 10 each group).
In order to test the enrichment in extracellular vesicles of these fractions, we analyzed the expression of Alix and TSG101, accesory proteins that are required for the formation of multi-vesicular bodies [26] and are present in exosomes irrespectively of cell type [27]. TSG101 has also been described in microvesicles where is involved in direct membrane budding [28].
In our study, we found a higher expression of Alix at 96 kDa (Fig 8, middle) and TSG101 at 46 kDa (Fig 8, right) in exosomal fractions than in microvesicular fractions from both control and cisplatin group, confirming the presence and enrichment of exosomes in this fraction.
Interestingly, both TSG101 and Alix were also detected in microvesicular fraction, but the pattern of expression was completely different to that of exosomal fraction. These differences in electrophoretic migration of both proteins can be due to the fact that microvesicles carry more proteins with posttranslational modifications when compared with exosomes [29]. In the case of TSG101, there was even an accessory band at 25 kDa that was very patent in
Table 5. Urinary variables 3 days after injection.
Control Cisplatin
UCr (mg/100g/day) 2.14±0.11 1.23±0.15**
Proteinuria (mg/mg crea) 0.82±0.03 7.31±0.72**
Microvesicular protein (μg/mg crea) 145±9.34 705±118**
Exosomal protein (μg/mg crea) 168±16.8 491±88.5**
Diuresis (ml/100g) 3.95±0.47 10.3±1.36*
Urine creatinine excretion (UCr; mg/100g/day), proteinuria (mg/mg creatinine), microvesicular (μg/mg creatinine) and exosomal (μg/mg creatinine) protein content, and diuresis (ml/100g) in Control and Cisplatin groups 24 hours after injection. Data are expressed as mean±SEM.
*p<0.01
**p<0.05 Cisplatin vs Control (n = 10 each group).
https://doi.org/10.1371/journal.pone.0175462.t005
Table 6. AlaAp activity in urine fractions.
Control Cisplatin Relative increase
Supernatant
AlaAp (mU/ml) 1.20±0.11 4.04±0.40** 3.36
AlaAp (mU/mg creatinine) 2.27±0.33 34.1±4.77** 15.0
AlaAp (mU/100g/day) 4.96±0.87 41.1±7.31** 8.29
AlaAp (mU/mg protein) 2.78±0.40 4.67±0.46* 1.68
Microsomal fraction
AlaAp (mU/ml) 0.66±0.05 1.83±0.12** 2.79
AlaAp (mU/mg creatinine) 1.18±0.11 16.1±2.34** 13.6
AlaAp (mU/100g/day) 2.57±0.32 19.0±2.92** 7.40
AlaAp (mU/mg protein) 8.39±1.02 23.8±1.59** 2.83
Exosomal fraction
AlaAp (mU/ml) 0.44±0.05 0.75±0.08* 1.72
AlaAp (mU/mg creatinine) 0.78±0.09 6.50±1.07** 8.37
AlaAp (mU/100g/day) 1.64±0.20 7.84±1.46** 4.78
AlaAp (mU/mg protein) 4.88±0.63 14.6±2.18 2.99
AlaAp activity in supernatant, microvesicular and exosomal fractions of urine samples from Control and Cisplatin groups collected 3 days after injection. Data were expressed in mU/ml, mU/mg creatinine, mU/100g/day and mU/mg protein. Mean±SEM
*p<0.01
**p<0.001 Cisplatin vs. Control (n = 10 each group).
Fig 6. Correlations between GluAp and AlaAp. Linear regressions between GluAp activity (mU/ml) in
supernatant (A), microvesicular (B) and exosomal (C) fraction of urine samples collected 3 days after injection.
https://doi.org/10.1371/journal.pone.0175462.g006
Fig 7. SCr and body weight. SCr concentration (mg/dl) (A) and body weight increase (%) in Control and
Cisplatin groups 3 days after injection. Individual samples and means±SEM are displayed;*p<0.001 Cisplatin vs. Control (n = 9–10 each group).
https://doi.org/10.1371/journal.pone.0175462.g007
Table 7. Correlations between GluAp activity and SCr.
r p
Supernatant
GluAp (mU/ml) 0.8597 <0.001
GluAp (mU/mg creatinine) 0.8832 <0.001
GluAp (mU/100g/day) 0.7683 0.0001
GluAp (mU/mg protein) 0.6138 0.0052
Microsomal fraction
GluAp (mU/ml) 0.9115 <0.0001
GluAp (mU/mg creatinine) 0.8007 <0.0001
GluAp (mU/100g/day) 0.7986 <0.0001
GluAp (mU/mg protein) 0.8599 <0.0001
Exosomal fraction
GluAp (mU/ml) 0.8217 <0.0001
GluAp (mU/mg creatinine) 0.7673 0.0001
GluAp (mU/100g/day) 0.7605 0.0002
GluAp (mU/mg protein) 0.7897 0.0001
Correlation coefficient (r) and statistical significance (p) of linear regressions between GluAp activity expressed in mU/ml, mU/mg creatinine, mU/100 g/day and mU/mg protein in supernatant, microsomal and exosomal fraction of urine samples collected 3 days after injection, with SCr concentration determined at this point.
microvesicular fraction from both control and cisplatin groups, but it was slightly detected in exosomal fraction.
It is also remarkable that the expression of Alix and TSG101 was very similar in cisplatin than in control group, and GluAp was the only marker that was clearly overexpressed in cis-platin-treated rats in both fractions, strengthening the role of the content of GluAp in these fractions as a marker of nephrotoxicity.
Conclusions
GluAp content or its enzymatic activity in microvesicular and exosomal fractions of urine has been shown to be an early and predictive biomarker of renal dysfunction in cisplatin-induced nephrotoxicity.
Table 8. Correlations between AlaAp activity and SCr.
r p
Supernatant
AlaAp (mU/ml) 0.8350 <0.0001
AlaAp (mU/mg creatinine) 0.7935 0.0001
AlaAp (mU/100g/day) 0.6348 0.0035
AlaAp (mU/mg protein) 0.4732 0.0407
Microsomal fraction
AlaAp (mU/ml) 0.8881 <0.0001
AlaAp (mU/mg creatinine) 0.7793 0.0001
AlaAp (mU/100g/day) 0.6702 0.0017
AlaAp (mU/mg protein) 0.7717 0.0001
Exosomal fraction
AlaAp (mU/ml) 0.6027 0.0063
AlaAp (mU/mg creatinine) 0.7385 0.0003
AlaAp (mU/100g/day) 0.5865 0.0083
AlaAp (mU/mg protein) 0.5467 0.0154
Correlation coefficient (r) and statistical significance (p) of linear regressions between AlaAp activity expressed in mU/ml, mU/mg creatinine, mU/100 g/day and mU/mg protein in supernatant, microsomal and exosomal fraction of urine samples collected 3 days after injection, with SCr determined at this point.
https://doi.org/10.1371/journal.pone.0175462.t008
Fig 8. Immunoblotting of GluAp, Alix and TSG101. Expression of GluAp, Alix and TSG101 in microvesicular
(MV) and exosomal (E) fractions from urines collected 3 days after treatment in Control and Cisplatin groups. Each lane contains 30μg of protein.
These variables are useful to evaluate proximal tubular damage regardless of glomerular fil-tration rate.
Supporting information
S1 File. Individual data. Individual data of body weight, diuresis and biochemical measure-ments in samples collected 24 hours (Experiment 1) and 3 days (Experiment 2) after cisplatin injection.
(XLS)
Acknowledgments
Technical and human support provided by CICT of Universidad de Jae´n (UJA, MINECO, Junta de Andalucı´a, FEDER) is gratefully acknowledged.
Author Contributions
Conceptualization: AO MG RW.
Formal analysis: AQ ABS SM FV RW.
Funding acquisition: AO RW.
Investigation: AQ ABS SM MCG.
Methodology: AQ SM MCG FO FV.
Project administration: AO FV RW.
Resources: AO FO FV RW.
Supervision: AO FV RW.
Validation: AQ ABS SM MCG RW.
Visualization: ABS SM AQ MG FV RW.
Writing – original draft: AQ SM MCG MG RW.
Writing – review & editing: AQ AO FO FV RW.
References
1. Devarajan P. Emerging biomarkers of acute kidney injury. Contrib Nephrol. 2007; 156: 203–212. https://doi.org/10.1159/0000102085PMID:17464129
2. Bonventre JV, Vaidya VS, Schmouder R, Feig P, Dieterle F. Next generation biomarkers for detecting kidney toxicity. Nat Biotechnol. 2010; 28: 436–440.https://doi.org/10.1038/nbt0510-436PMID: 20458311
3. Vaidya VS, Ferguson MA, Bonventre JV. Biomarkers of acute kidney injury. Annu Rev Pharmacol Toxi-col. 2008; 48: 463–493.https://doi.org/10.1146/annurev.pharmtox.48.113006.094615PMID: 17937594
4. Lisowska-Myjak B. Serum and urinary biomarker of acute kidney injury. Blood purif. 2010; 29: 357– 365.https://doi.org/10.1159/000309421PMID:20389065
5. Arany I, Safirstein RL. Cisplatin nephrotoxicity. Semin Nephrol. 2003; 23: 460–464. PMID:13680535
6. Yao X, Panichpisal K, Kurtzman N, Nugent K. Cisplatin nephrotoxicity: a review. Am J Med Sci. 2007; 334: 115–124.https://doi.org/10.1097/MAJ.0b013e31812dfe1ePMID:17700201
8. Quesada A, Vargas F, Montoro-Molina S, O’Valle F, Rodrı´guez-Martı´nez MD, Osuna A, et al. Urinary aminopeptidase activities as early and predictive biomarkers of renal dysfunction in cisplatin-treated rats. PLoS One. 2012; 7: e40402.https://doi.org/10.1371/journal.pone.0040402PMID:22792302
9. Montoro-Molina S, Quesada A, Zafra-Ruiz PV, O’Valle F, Vargas F, de Gracia MC, et al. Immunological detection of glutamyl aminopeptidase in urine samples from cisplatin-treated rats. Proteomics Clin. Appl. 2015; 9: 630–635.https://doi.org/10.1002/prca.201400096PMID:25470983
10. Salih M, Zietse R, Hoorn EJ. Urinary extracellular vesicles and the kidney: biomarkers and beyond. Am J Physiol Renal Physiol. 2014; 306: 1251–1259.
11. Ga´mez-Valero A, Lozano-Ramos SI, Bancu I, Lauzurica-Valdemoros R, Borras FE. Urinary extracellu-lar vesicles as source of biomarkers in kidney diseases. Front Inmunol. 2015; 6: 1–10.
12. Pisitkun T, Johnstone R, Knepper MA. Discovery of urinary biomarkers. Mol Cell Proteomics 2006; 5: 1760–1771.https://doi.org/10.1074/mcp.R600004-MCP200PMID:16837576
13. Ohno S, Ishikawa A, Kuroda M. Roles of exosomes and microvesicles in disease pathogenesis. Adv Drug Deliv Rev. 2013: 65: 398–401.https://doi.org/10.1016/j.addr.2012.07.019PMID:22981801
14. Dimov I, Jankovic Velickovic L, Stefanovic V. Urinary exosomes. Scientific World Journal. 2009: 9: 1107–1118.https://doi.org/10.1100/tsw.2009.128PMID:19838597
15. Alvarez S, Suazo C, Boltansky A, Ursu M, Carvajal D, Innocenti G et al. Urinary exosomes as a source of kidney dysfunction biomarker in renal transplantation. 2013; Transplant Proc. 45: 3719–3723. https://doi.org/10.1016/j.transproceed.2013.08.079PMID:24315007
16. Dear JW, Street JM, Bailey MA. Urinary exosomes: a reservoir for biomarker discovery and potential mediators of intrarenal signalling. Proteomics 2013; 13: 1572–1580.https://doi.org/10.1002/pmic. 201200285PMID:23129434
17. Gonzales PA, Pisitkun T, Hoffert JD, Tchapyjnikov D, Star RA, Kleta R, et al. Large-scale proteomics and phosphoproteomics of urinary exosomes. J Am Soc Nephrol. 2009; 20: 363–379.https://doi.org/ 10.1681/ASN.2008040406PMID:19056867
18. Zhou H, Yuen PS, Pisitkun T, Gonzales PA, Yasuda H, Dear JW, et al. Collection, storage, preserva-tion, and normalization of human urinary exosomes for biomarker discovery. Kidney Int. 2006; 69: 1471–1476.https://doi.org/10.1038/sj.ki.5000273PMID:16501490
19. Kenny AJ, Maroux S. Topology of microvillar membrane hydrolases of kidney and intestine. Physiol Rev. 1982: 62: 91–128. PMID:6119713
20. Song L, Ye M, Troyanovskaya M, Wilk E, Wilk S, Healy DP. Rat kidney glutamyl aminopeptidase (ami-nopeptidase A): molecular identity and cellular localization. Am J Physiol. 1994; 267: F546–F557. PMID:7943354
21. Fang DY, King HW, Li JY, Gleadle JM. Exosomes and the kidney: Blaming the messenger. Nephrology. 2013; 18: 1–10.https://doi.org/10.1111/nep.12005PMID:23113949
22. Jayachandran M, Lugo G, Heiling H, Miller VM, Rule AD, Lieske JC. Extracellular vesicles in urine of women with but not without kidney stones manifest patterns similar to men: a case control study. Biol Sex Differ. 2015; 6: 2.https://doi.org/10.1186/s13293-015-0021-2PMID:25729563
23. Viñuela-Berni V, Donı´z-Padilla L, Figueroa-Vega N, Portillo-Salazar H, Abud-Mendoza C, Baranda L, et al. Proportions of several types of plasma and urine microparticles are increased in patients with rheumatoid arthritis with active disease. Clin Exp Immunol. 2015; 180: 442–451.https://doi.org/10. 1111/cei.12598PMID:25639560
24. Lv LL, Cao Y, Liu D, Xu M, Liu H, Tang RN, et al. Isolation and quantification of microRNAs from urinary exosomes/microvesicles for biomarker discovery. Int J Biol Sci. 2013; 9: 1021–1031.https://doi.org/10. 7150/ijbs.6100PMID:24250247
25. Murakami T, Oakes M, Ogura M, Tovar V, Yamamoto C, Mitsuhashi M. Development of glomerulus-, tubule-, and collecting duct-specific mRNA assay in human urinary exosomes and microvesicles. 2014; PLoS One. 2: e109074.
26. Morita E, Sandrin V, Chung H-Y, Morham SG, Gygi SP, Rodesch CK, et al. Human ESCRT and ALIX proteins interact with proteins of the midbody and function in cytokinesis. 2007; EMBO J. 26: 4215– 4227.https://doi.org/10.1038/sj.emboj.7601850PMID:17853893
27. Thery C, Boussac M, Veron P, Ricciardi-Castagnoli P, Raposo G, Garin J, et al. Proteomic analysis of dendritic cell–derived exosomes: A secreted subcellular compartment distinct from apoptotic vesicles. J Immunol. 2001; 166: 7309–7318. PMID:11390481


![This article has been published in: Clinical Oral Investigations Jul 3. doi: 10.1007/s00784-018-2548-1. [Epub ahead of print]](data:image/gif;base64,R0lGODlhAQABAIAAAP///wAAACH5BAEAAAAALAAAAAABAAEAAAICRAEAOw==)