Planning and management of mobility in natural protected
areas
Maria Eugenia Lopez Lambas
Universidad Politecnica de Madrid - Departamento de Ingeneria Civil Transportes, C/Profesor Aranguren 3, 28040 Madrid, Spain
Stefano Ricci
Sapienza Università di Roma - DICEA, Via Eudossiana 18, 00184 Roma, Italy
SUMMARY
quantification of the effects (variation of emissions) for each scenario and a selection of the most effective management actions to be taken.
1. INTRODUCTION
1.1 History and context
Since ancient Roman times some first experiences of land protection are reported: Varrone ordered the establishment around Tarquinia of an area where deer, mouflon and hares were protected from hunting. It was a prototype of protected area, which includes the idea of safeguarding resources for a more rational use in favor of a superior collective interest. In modern times the extension of the land protection concept brings to the safeguard of the natural resources, to let them be enjoyed by future generations, mainly for conservation, education and scientific research purposes and to the different relevance assigned to these purposes corresponds the variety of modern protected area establishment and management criteria resulting in natural parks:
• in the USA (the first natural park was established in 1872 at Yellowstone) the privilege is for naturalistic-touristic aspects and the natural park is managed like a factory, where the visitor is driven to be integrated in the natural environment according to rigid rules;
• in Africa the main aspect is the safeguard from extinction the local flora and fauna; • in Europe the concept of natural park is more complex and normally includes
additional elements (e.g. population density, cultural and historical heritages), which enlarge the protection concept to a variety of assets and requires to council it with the public accessibility and the socio-economic development of the local communities.
Therefore the constraints must be imposed not to all the human activities, but only to those not compatible with consolidated local habits and traditions. The mobility is one of the primary activities, therefore in principle strictly related to local habits and traditions, nevertheless its sensibility to the modification of land-use may bring, if not correctly managed, may provoke devastating effects to the environment.
1.2 Selection and definition of protected areas
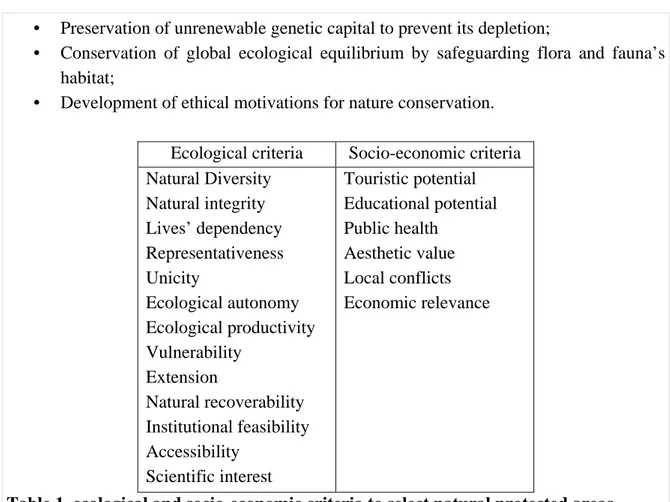
The identification of areas to be protected is normally arising from scientific studies in the concerned naturalistic sectors highlighting the peculiarities and exceptionalities possessed as far as geology, geomorphology, flora, fauna and/or landscape. Moreover, the demographic pressure should be limited, at least in the areas to be subjected to the highest levels of protection. Therefore, the final choice is normally based on a combination of ecological and socio-economic criteria, whose extensive nature is summarized in Table 1.
1.3. Legislation
• Preservation of unrenewable genetic capital to prevent its depletion;
• Conservation of global ecological equilibrium by safeguarding flora and fauna’s habitat;
• Development of ethical motivations for nature conservation.
Ecological criteria Socio-economic criteria Natural Diversity
Natural integrity Lives’ dependency Representativeness Unicity
Ecological autonomy Ecological productivity Vulnerability
Extension
Natural recoverability Institutional feasibility Accessibility
Scientific interest
Touristic potential Educational potential Public health
Aesthetic value Local conflicts Economic relevance
Table 1. ecological and socio-economic criteria to select natural protected areas
Starting from basic principles fixed at International levels since 1973 (Washington Convention on international safeguard of animal and vegetal species under extinction threat) many European Directives entered in force.
The key milestone was the Directive 92/43 “Habitat” concerning the conservation of natural and semi-natural habitats of wild flora and fauna, on which basis a network of special conservation zones “Natura 2000” is established. On this basis the International Union for Conservation of Nature (IUCN), the world’s oldest and largest global environmental organization, starts to work in strict connection with the EU, by fostering Commissions’ initiatives in favor of:
• investments for natural protected areas in Mediterranean area, where the diversity of species is higher;
• increase of protected surfaces;
• strengthening of monitoring systems to assess the protection’s effects;
• improvement of management and control systems to avoid destructive effects and decrease anthropic pressure;
• prioritization of natural protected areas on the basis of potential damages due to socio-political dynamics;
• development of sustainable tourism and other economic activities compatible with the natural vulnerability to avoid the depletion of local communities;
• support of collaboration and integration policies among EU countries.
legislative context includes the Law 349/1986, establishing the Ministry for Environment and providing with rules against the environmental damages and the Framework Law 394/1991 introducing the system for nature protection, which includes classification criteria for the protected areas, rules for protection and safeguard, planning and management instruments and the corresponding management bodies (Fig. 1). Therefore, the so called Plan of the Park is the key instrument to define the protected area structure and their perspectives, both in terms of safeguard and sustainable development and aims to regulate the following aspects:
• vehicular and walking accessibility;
• distribution of areas (zoning) by different uses and safeguard levels; • constraints, land use assignment and implementation rules;
• services and equipment for social and cultural management; • actions criteria towards fauna, flora and related habitats.
Fig. 1 - Bodies and instruments for Framework Law 394/91 implementation
The focus of the present paper deals with the first aspect, which has to be tackled on the basis of preliminary investigations dedicated to sketch the state-of-the-art of mobility according the land use zoning and activities location.
2. MOBILITY IN NATURAL PROTECTED AREAS
2.1. Mobility needs
Mobility in the natural protected areas satisfies various needs, which may be classified as follows:
• tourism, to be further differentiated according to the motivation and duration of the journeys, into holiday period, weekend journey, daily trip (picnic, etc.), excursion or alpinism, natural studies, photographic tour;
• work;
Ministry for Environment
Nature Chart
Environmental profiles
and vulnerabilities
Committee for protected
areas
Guidelines for land‐use
development Plan of protected areas
Modification of protected
areas and funding assignment
Technical Secretary for
protected natural areas
Instructories
Technical Board for
natural protected areas
• emergency and rescue;
• regular inhabitants trips among villages and towns.
The most part of this mobility is characterized by high seasonal variability; moreover the touristic mobility may be further differentiated according to the distance between the origin of the trips and the protected area. The mobility behaviors inside the park are strongly depending upon the trip motivation, including organized groups, mainly travelling by rented buses, familiar groups, “soft” excursionists using main roads and surrounding areas, “hard” excursionists approaching more remote and physical engaging paths, etc..
2.2. Mobility management in European parks
to UK, for the parking areas design criteria, it has been highlighted since long time (Yorkshire Dales National Park Committee, 1984; North Yorkshire and Cleveland Heritage Coast, 1995) that their location should be far from sensible areas, managed by real-time information systems to avoid parasite mobility, linked to them by not motorised links (mainly walking and biking paths), as well as natural barriers (e.g. vegetal fences, roads restrictions) should be introduced to avoid undesired parking.
3. TRAFFIC ANALYSIS METHODOLOGIES
The traffic analysis is a key activity to be developed before the implementation of any measure.
The typical methodologies to approach this analysis are normally involving:
• Identification of the study area by means of detailed cartography, including protected areas;
• Analysis of socio-economic activities location against protected areas; • Analysis of geometrical and functional characteristics of transport network; • Study area zoning according to land use and transport network morphology; • Schematization of transport network in a graph;
• Studies on mobility demand;
• Reproduction of the present mobility framework: demand modelling and calibration.
The following steps are beyond the traffic analysis itself and represent the full application of the methodology to the study context:
• Infrastructural and operational measures identification: building up of scenarios; • Evaluation of measures evaluation by means of simulation of scenarios.
4. RELEVANT IMPACTS ASSESSMENT
4.1. Impacts identification and relevance
normally tackled by active (source attenuation) and passive (barriers construction) measures according to zoning limits depending upon local land use (Presta and Ricci, 2003). The lithosphere is potentially attacked in its two main components: soil (erosion due to modification of morphology and dispersion of aggressive essences by vehicles) and subsoil (modification of stratigraphy, sediments, mineralogy, paleontology, hydrogeology, etc. due to transport infrastructures intrusion). Moreover, the mechanical pressure on lithosphere is producing vibrations, again resulting in disturbing normal human activities and habitats of animals and plants: the mitigation of these effects is based on structural measures on generating infrastructures and receiving buildings. The hydrosphere is potentially threated superficially (natural inundation favored by transport infrastructures and contamination of water courses) or deeply (variation of water level due to dredging, accidental and continuous contamination). The biosphere is potentially attacked by mobility effects by various impacts: soil subtraction, fragmentation and solation of biotopes (ecological corridors interruption), polluting essences dispersion. Finally, the natural landscape may be treated in its natural and anthropic components as well as in cultural and historical heritages by the intrusive presence of punctual (e.g. parking and stations) and linear (e.g. roads, railways, and ropeways) infrastructures. In the following analysis the relevance assessment of impacts has been further developed only for the most frequently aggressive factors against natural protected areas under normal operational conditions of surface transport systems: air pollution and noise.
4.2. Impacts simulation
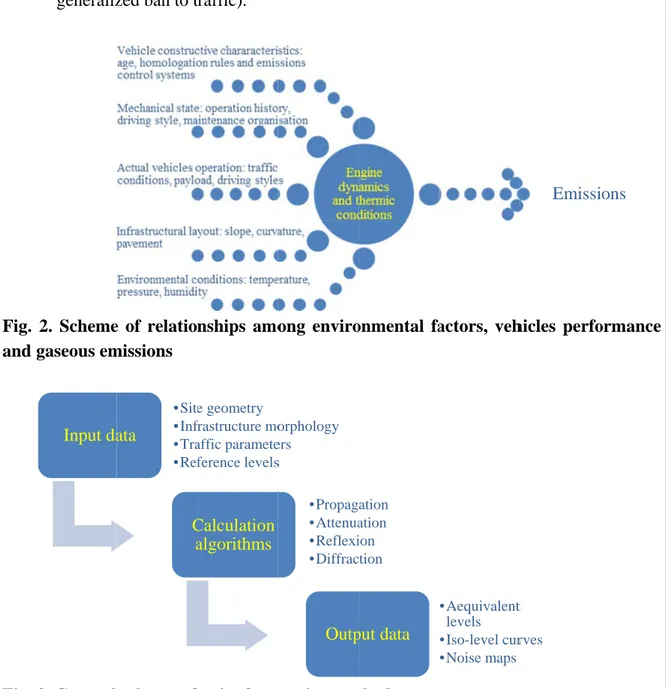
The effectiveness of infrastructural and operational measures aimed to grant the mobility and to safeguard the natural protected areas is evaluated by means of simulation models. In particular the simulation of air pollution in the proposed methodology is developed by an original framework model based on consolidated sub-models approaching various affecting parameters (Chiquetto and Balckledge, 1998) (Fig. 2). A similar approach is used also for forecasting noise levels; the model scheme, based on consolidated sub-models (Farina and Brero, 1996), is synthetically described in fig. 3.
5. IMPACTS MITIGATION AND COMPENSATION
Measures to mitigate and/or compensate the impacts on the sensible environment typical of the protected areas have been developed with reference to air chemical pollution and noise. The measures have been selected according to their effective implementation in natural protected areas. So, for the protection against the pollution from road traffic, the analyzed measures are:
• passive infrastructural: green barriers (continuous tree alignment) capable to absorb and filter undesired particles by leafs;
Fig. and Fig. For t elect locom trees comp The p • • generaliz 2. Scheme gaseous em 3. General the protecti tric traction motives. Th planted in pensation) o protection a
active m operation effects a passive equipme surround Input da
zed ban to t
e of relatio missions
scheme of
on against n operation he compens
n the prot or by limitat against nois measures on
n and fricti and excessiv measures o ent of viad ding buildin ata • Site • Inf • Tra • Ref C a traffic). nships amo
f noise forec
the pollutio or, at lea sation of po
ected area tion of pollu e is possibl n vehicles,
ion on roll ve speed;
on pavemen ducts and t ngs. e geometry frastructure mo affic paramete ference levels Calculation algorithms ong enviro casting met
on from rail ast, the use ollution eff
(local com ution from e thanks to:
particularly ling surface
nts (noise tunnels), w orphology ers s • Propag • Attenua • Reflexi • Diffrac Outp onmental fa thods
l traffic the e of low p fects is norm
mpensation) fixed source :
y acting on es, or on tr
absorbing), with barrier ation ation ion ction put data actors, veh
e only analy olluting an mally perfo ) or somew es located n
n making m raffic, by a
, on structu rs (natural
• Aequivalent levels • Iso-level cur • Noise maps
hicles perfo
yzed measu nd well ma ormed by m
where else nearby. more silent avoiding co ures (anti-v and artific t rves Emissi ormance
The only compensation measure for noise effects is the possible modification of land use, that is nearly very difficult to be applied in the natural protected areas.
6. CASE STUDY METHODOLOGY APPLICATION
6.1. Case study description
The National Park Gran Sasso e Monti della Laga is located in the central Italy, it was established in 1991 over a surface of about 1500 km2 over 3 regions (Abruzzo, Lazio and Marche), 5 provinces (L’Aquila, Pescara, Teramo, Rieti and Ascoli Piceno) and 45 municipalities. The high mountains environment makes difficult the internal communications. The most relevant transport infrastructure is the A24 motorway and its long tunnel under Gran Sasso mountains with two stations laying inside the protected area. The other main roads are the National Roads SS4, SS80 and SS81 and the secondary rich network, often extended over the real needs of the low population regions. The railway links are poor both on the east (secondary not electrified west-east lines linking Teramo and Ascoli Piceno to the Adriatic coast) and west side (the secondary and not electrified north-south line Terni-Rieti-L’Aquila-Sulmona) with a limited amount of stations and a poor public transport system linking them to the most attractive Park areas. As a consequence the accessibility to the park is today based on road systems.
6.2. Transport systems network
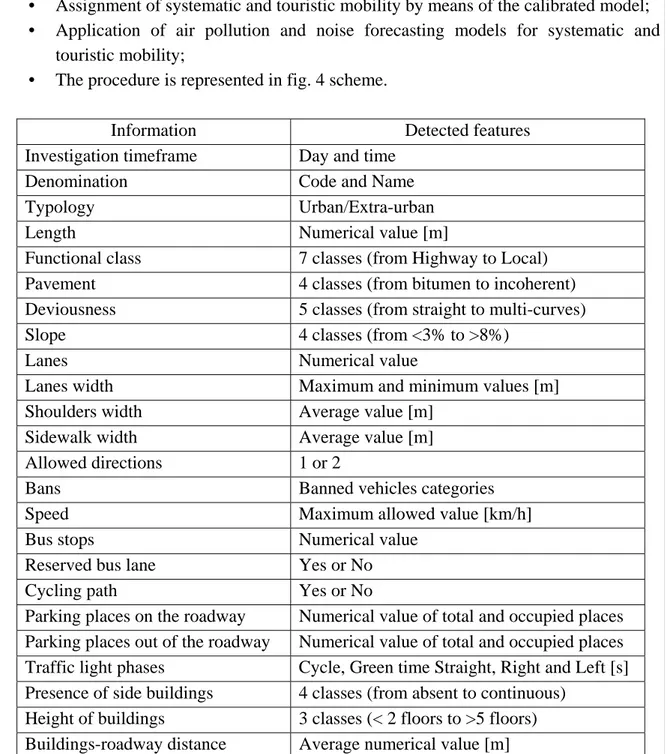
The first activity was the acquisition and the storage of the mobility-environment systems data in a dedicated GIS database starting from a 1:50000 digital cartography. The second stage was the identification of traffic zones starting from the most detailed available zoning produced by the National statistics institute (ISTAT) and progressively aggregating them according to the local land use and the location of attractive touristic zones: the final adopted zoning includes 53 traffic zones. On this basis, the transport network has been represented by an overlaid graph including both real nodes and links of the road and rail networks and centroids representing potential mobility sources/pits internal and external to the protected area. The elements of the graphs have been characterized with their geometrical and functional features on the basis of the available data (Motorway, National roads and railways) and a dedicated on site investigation, covering all the secondary road network, performed by the compilation of sheets including the information summarized in table 2. On the basis of the resulting characteristics it has been associated to each link and node a flow curve (relationship between vehicular flow and speed).
6.3. Mobility analysis
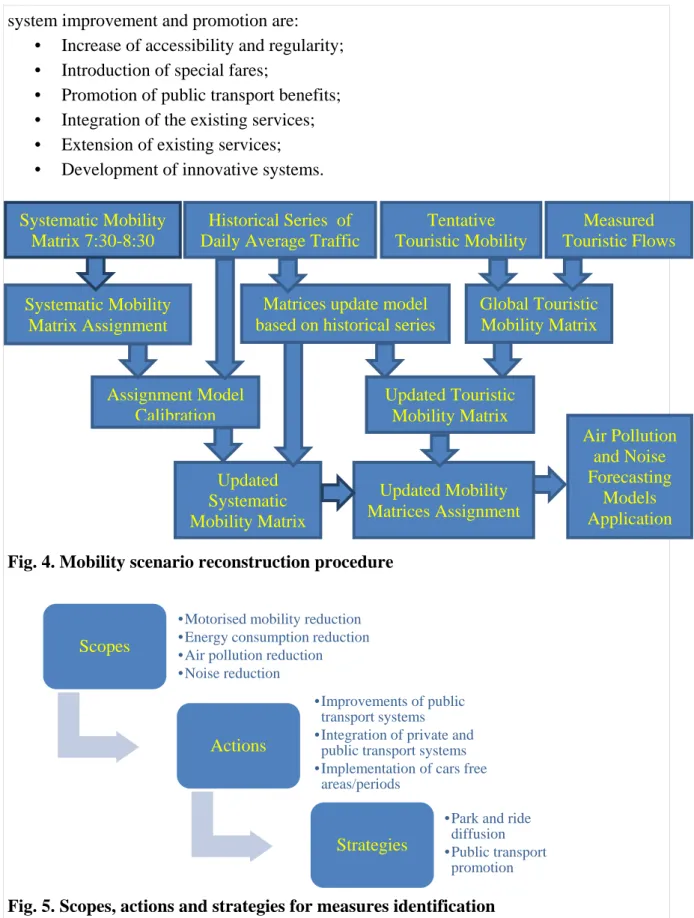
The present mobility scenario has been defined on the basis of the procedure including the following macro-phases:
• Assignment model application and calibration;
• Update of systematic mobility by means of flows measured by road management company (ANAS);
• Touristic mobility reconstruction by means of measured flows;
• Assignment of systematic and touristic mobility by means of the calibrated model; • Application of air pollution and noise forecasting models for systematic and
touristic mobility;
• The procedure is represented in fig. 4 scheme.
Information Detected features
Investigation timeframe Day and time
Denomination Code and Name
Typology Urban/Extra-urban
Length Numerical value [m]
Functional class 7 classes (from Highway to Local) Pavement 4 classes (from bitumen to incoherent) Deviousness 5 classes (from straight to multi-curves) Slope 4 classes (from <3% to >8%)
Lanes Numerical value
Lanes width Maximum and minimum values [m] Shoulders width Average value [m]
Sidewalk width Average value [m] Allowed directions 1 or 2
Bans Banned vehicles categories
Speed Maximum allowed value [km/h]
Bus stops Numerical value
Reserved bus lane Yes or No
Cycling path Yes or No
Parking places on the roadway Numerical value of total and occupied places Parking places out of the roadway Numerical value of total and occupied places Traffic light phases Cycle, Green time Straight, Right and Left [s] Presence of side buildings 4 classes (from absent to continuous)
Height of buildings 3 classes (< 2 floors to >5 floors) Buildings-roadway distance Average numerical value [m]
Table 2. information collected during the on-site investigation on the secondary road network
6.4. Identification of measures
system improvement and promotion are: • Increase of accessibility and regularity; • Introduction of special fares;
• Promotion of public transport benefits; • Integration of the existing services; • Extension of existing services; • Development of innovative systems.
Fig. 4. Mobility scenario reconstruction procedure
Fig. 5. Scopes, actions and strategies for measures identification
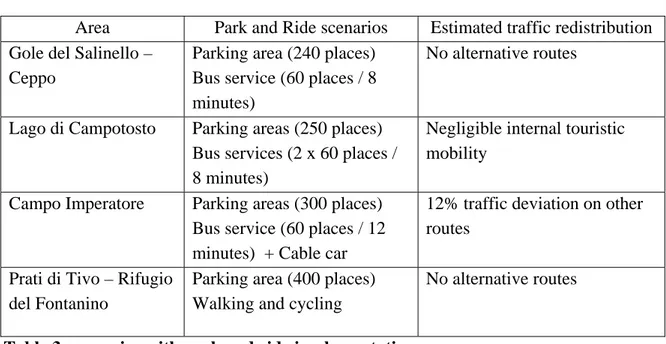
The following actions have been dedicated to the identification, on the basis of simulations results, of specific areas where private mobility is completely banned whilst the private mobility and allow full accessibility is allowed by the improved public transport services. The selected areas and the corresponding park and ride measures are synthetically
Scopes
• Motorised mobility reduction • Energy consumption reduction • Air pollution reduction • Noise reduction
Actions
• Improvements of public transport systems
• Integration of private and public transport systems • Implementation of cars free
areas/periods
Strategies
• Park and ride diffusion • Public transport
promotion Systematic Mobility
Matrix 7:30-8:30
Historical Series of Daily Average Traffic
Tentative Touristic Mobility
Measured Touristic Flows
Systematic Mobility Matrix Assignment
Assignment Model Calibration
Matrices update model based on historical series
Global Touristic Mobility Matrix
Updated Touristic Mobility Matrix
Updated Mobility Matrices Assignment Updated
Systematic Mobility Matrix
Air Pollution and Noise Forecasting
described in table 3.
Area Park and Ride scenarios Estimated traffic redistribution Gole del Salinello –
Ceppo
Parking area (240 places) Bus service (60 places / 8 minutes)
No alternative routes
Lago di Campotosto Parking areas (250 places) Bus services (2 x 60 places / 8 minutes)
Negligible internal touristic mobility
Campo Imperatore Parking areas (300 places) Bus service (60 places / 12 minutes) + Cable car
12% traffic deviation on other routes
Prati di Tivo – Rifugio del Fontanino
Parking area (400 places) Walking and cycling
No alternative routes
Table 3. scenarios with park and ride implementation
6.5. Measures assessment
The effects of new scenarios have been globally estimated, by means of assignment and forecasting models, both in terms of mobility indicators (length of journeys and average speed) and gaseous emissions (CO, NOx, HC and PM). Results are summarized in table 4. The effects on noise levels have been locally relevant but not globally valuable due to the not additive effects and indicators.
Indicators Present scenario Implementation of new scenarios Total journeys of private cars [km]
Average speed [km/h] CO emissions [kg/km] NOx emissions [kg/km] HC emissions [kg/km] PM emissions [kg/km]
212,170 84.9 0.889 0.203 0.119 0.019
181,382 (- 15.5%) 84.5 (- 0.5%) 0.878 (- 1.2%) 0.179 (- 11.8%) 0.105 (- 11.8%) 0.017 (- 5.9%)
Table 4. global effects on new scenarios implementation
7. CONCLUSIONS AND FURTHER RESEARCH DEVELOPMENTS
safeguarding measures to compose project scenarios. The process is completed by the assessment of the scenarios themselves from different perspectives. The application of the whole procedure to an Italian case study, the “Gran Sasso and Monti della Laga” natural park, allowed to identify some specific measures of mobility management, with a view to banning private traffic and to satisfy the mobility needs by non-motorized solutions or by public transport systems. The relative advantages of these solutions are relevant and could be further increased by operating public transport systems with low (or locally zero) emissions vehicles. Another application of the proposed procedure and models, although not described in the present paper, was developed with reference to the “Gargano” natural park located in the Southern Italy (Puglia region). Further developments of the research topic could include:
Application to a more extended area, including larger and multimodal transport networks and potentially stronger flows re-distribution effects;
Inclusion in the procedure of models approaching additional relevant impacts (e.g. those listed in §4.1).
Introduction of dynamic, instead static, modelling of gaseous emissions taking into account instantaneous values of speed and acceleration.
REFERENCES
BAR P., FAVERE B.M. and RAPIN J.M. (1980). Guide du Bruit des Transport Terrestres; Prévision des Niveaux Sonores.
CHIQUETTO S. and Balckledge D. (1998). Estimating the Energy and Emission Impacts from the implementation of transport measures. 8th World Conference on Transport
Research, Antwerp.
CURTIS L.F. and WALKER A.J.(1982). Exmoor National Park, Moorland Conservation in Exmoor.
DARTMOOR NATIONAL PARK AUTHORITY (1997-1998). Annual Report.
FARINA A. and BRERO G. (1996). Computer code based on experimental results for designing sound reduction devices. Conference “Noise & Planning”, Pisa.
NORTH YORKSHIRE AND CLEVELAND HERITAGE COAST (1995). Management Plan, Second Review Strategy.
PARCO NATURALE ADAMELLO BRENTA (1992). Piano del parco, Disciplina degli accessi al parco.
PARQUE NACIONAL DE LA CALDERA DE TABURIENTE (1995). Plan Rector de Uso y Gestion.
PARQUE NACIONAL DE TEIDE (1995). Revision del Plan Rector de Uso y Gestion. Santa Cruz de Tenerife.
PEMBROKESHIRE COAST NATIONAL PARK (1999). National Park Plan, Second Review.
WIT Press, Southampton.