University of Málaga. Energy Group. Campus de Teatinos E-29071 Malaga. Spain.
ABSTRACT: In Spain, regulations for Self-Consumption installations have been recently approved. However, regulations for Net Metering installations are still under discussion. The target of this study is to discuss different options for Net Metering implementation which are not defined yet. Also, an approach to new criteria for sizing this kind of installations will be done from different points of view: technical and economic.
Different cases have been studied: the regulatory frame which was drafted by the former government (but not approved yet) and other proposals amending the mentioned draft that are being issued by other entities as National Energy Commission of Spain, Photovoltaic Producers Association, etc.
The results let us conclude that the regulations which are drafted now will not permit the optimal performance of Net Metering installations neither from energy point of view nor economic point of view. It should be necessary to change the regulation draft just to reach the optimal performance of Net Metering installations.
Keywords: Self-consumption, Net-metering, Photovoltaic system
1 INTRODUCTION
On November 18th, 2011, former Spanish
Government approved the Royal Decree RD 1699/2011 [1] which regulates administrative and technical conditions for grid connection of small renewable energy and cogeneration power plants. This Decree transposes to Spanish regulations part of the European Directive 2009/28/CE [2] and its aim is to simplify the required formalities in order to accelerate the access to the grid of such small size power plants. Also on November 2011 is announced the close-future issue of a regulation for the power generation in a consumer´s internal electric installation which is connected to the grid [3, 4]. This announced and drafted future regulation is known as Self-Consumption with Net Metering.
In January of 2012 was approved the RD 1/2012 [5] which stopped completely the renewable energy promotion system of Spain, active until that date.
Both facts: the announcement and draft of close future regulations for Net Metering together with the stop of promotions to renewable energies done in RD 1/2012, have increased the interest and attention for Self Consumption and Net Metering from electric consumers, and therefore from installers and promoters.
The target of this study is to carry out an energy and economic analysis of the following models of photovoltaic Self Consumption:
Self-Consumption in special regime, approved
through RD 1699/2011 [1].
Self-Consumption with Net Metering,
announced and drafted by the former government in November 2011 [6].
Self-Consumption with Net Metering, proposed
by the National Energy Commission (CNE) in April 2012 [7].
2 SIMULATION OF ENERGY FLOWS
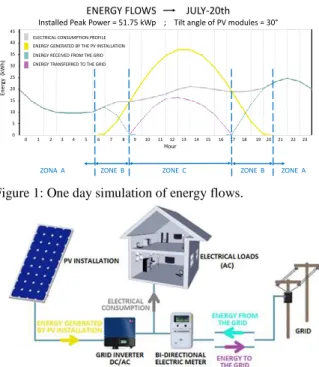
Energy flows produced by the system have been simulated for an industry in which is known a whole year hourly consumption profile (figure 1). In the simulated photovoltaic Self-Consumption installation (figure 2), have been done different simulations changing the installed peak power and the tilt angle of the photovoltaic modules.
For each yearly simulation, the following hourly data has been obtained: energy generated by the installation, energy consumed from the grid and energy transferred to the grid.
0 1 2 3 4 5 6 7 8 9 10 11 12 13 14 15 16 17 18 19 20 21 22 23
Hour
ENERGY FLOWS JULY-20th Installed Peak Power = 51.75 kWp ; Tilt angle of PV modules = 30°
ZONA A ZONE B ZONE C ZONE B ZONE A
ZONE A ZONE B ZONE C
45 40 35 30 25 20 15 10 5 0
Ener
gy
(kWh
)
ELECTRICAL CONSUMPTION PROFILE ENERGY GENERATED BY THE PV INSTALLATION ENERGY RECEIVED FROM THE GRID ENERGY TRANSFERRED TO THE GRID
Figure 1: One day simulation of energy flows.
Figure 2: Self-Consumption photovoltaic installation scheme.
3 ANALYSIS OF THE SELF-CONSUMPTION MODELS
The differences among mentioned Self-Consumption models and the energy costs associated to each one of them are studied below.
3.1 Self-Consumption in special regime (without Net Metering).
Consumers with this model can sell to the Electric Supplying Company the excess of energy generated in his installation that cannot be consumed instantly. The energy transference to the grid produces an economic profit. The price of the energy sold is the electric pool price at the moment of the transference.
After the energy-economic study for all the simulations, those designs which minimize yearly cost of the energy consumption are obtained. In figure 3 is shown the yearly consumption distribution between Self-Consumption and energy purchased from the grid for the optimal installation. The energy sold to the grid can be seen in figure 4.
Figure 3: Yearly consumption distribution for Self- Consumption in special regime model.
Figure 4: Energy sold to the grid yearly for Self-Consumption in special regime model.
3.2 Self-Consumption with Net Metering, announced and drafted by the former government. Energy model.
Consumers with this model could transfer to the grid the excess of energy generated in his installation that could not be consumed instantly. The energy transference to the grid produces deferred rights that could be used in any moment with a maximum delay of 12 months since the actual date of the transference. During those 12 months, the energy purchased from the grid could be balanced until the same amount of excess energy transferred to the grid, but always in the same tariff period in which the transference of energy excess was done.
In Spain, every kWh of electricity supplied by the grid has to pay an access toll just due to the use of the grid. The only cost that a kWh should have to pay when it
is consumed from the grid and balanced by Net Metering should be that access toll. It is mentioned but not defined a Net Metering service cost.
An energy-economic study of this model has been done for all the simulations. In figure 5 is shown the
yearly consumption distribution between Self-
Consumption, energy recovered by Net Metering and energy purchased from the grid for the optimal installation. In figure 6 can be seen, also for the optimal installation, the energy recovered by Net Metering and the energy lost for each tariff period, considering a 3 periods tariff: low (low price), medium (medium price) and high (high price).
Figure 5: Yearly consumption distribution for Self-Consumption with Net Metering. Energy model.
Figure 6: Yearly recovered energy and lost energy for Self-Consumption with Net Metering, energy model.
3.3 Self-Consumption with Net Metering, proposed by the National Energy Commission (CNE). Economic model.
The National Energy Commission (CNE) of Spain proposed that Net Metering shouldn´t be based only in energy exchanges between consumers and the grid, as it is said in the energy model drafted by the former government. CNE proposal considers that energy exchange should be completed with the economic value of that energy. The value should be just the unit purchase price of the energy at the real time of exchange with the grid. So, Net Metering should have a more economic and efficient basis.
The energy transference to the grid produces deferred economic rights. The energy purchased by the consumer could be balanced until an amount of money equal to the economic rights acquired. There is no maturity previously defined for the rights. A signed agreement between parties should define accurate economic terms and temporal frame.
This model has a great advantage respect to the energy model because the use of the economic rights is not limited to the tariff period in which the right is generated.
Figure 7: Yearly consumption distribution for Self-Consumption with Net Metering. Economic model.
Figure 8: Yearly recovered and lost economic rights for Self-Consumption with Net Metering. Economic model.
4 ANNUAL COSTS OF ENERGY FOR EACH MODEL
In figure 9 are shown the annual costs of energy (for the industry subject of study) joined to Self Consumption for 51 installations with optimal design (17 peak powers installed and 3 models for each peak power).
For installations with peak power installed under 17.50 kWp, can be seen in figure 9 that the 3 models have the same annual cost of energy. This is because all the energy generated by the installation is self consumed instantly and there is no energy excess transferred to the grid. The transference to the grid makes the difference between the 3 models studied.
For peak power installed between 17.50 kWp and 34.50 kWp can be seen that both models with Net Metering reduce the cost of energy the same amount. Model without Net Metering doesn´t reduces the cost of energy so much. The reason for this is that the value of the kWh which is balanced by Net Metering is very similar to the value of the kWh purchased from the grid (the only difference is the access toll); however, the electric pool sale price of the kWh transferred to the grid in the model without Net Metering is much lower than the price of the kWh purchased from the grid, so the benefits obtained by energy sale to the grid in the model without Net Metering are lower than the savings obtained by balance in the models with Net Metering.
First differences between both models with Net Metering appear for installed peak power since 34.50 kWp. In the economic model (proposed by CNE), costs of energy continue lowering at the same rate until 57.50 kWp. However, in the energy model, the cost of energy decrease at a slower rate since 34.50 kWp. This is because in the economic model, the rights obtained by transferring energy excess to the grid can be balanced with energy from the grid in any tariff period; in the energy model the balance must be done in the same tariff period in which the rights were generated.
The cost of energy in Self Consumption installations
with Net Metering becomes constant for installed peak power in which is not possible to recover more rights (energy or economic). For the industry studied and with the Net Metering economic model, this point is reached with an installed peak power of 57.50 kWp; for this peak power the Net Metering is complete, the installation pays nothing in concept of energy, only pays the access toll, around 2000 €. For the industry studied and with the Net Metering energy model, this point is reached with an installed peak power of 63.25 kWp; for this peak power, in two tariff periods the Net Metering is complete and all the energy consumed is balanced with the energy produced (only pays access toll), but in the third tariff period (night period) the installation needs to continue paying all the energy purchased from the grid because in that period no energy is produced and cannot be balanced. That´s the reason why for Net Metering energy model the energy costs become constant around 4000 €.
For installed peak power over 63.25 kWp, both models of Self-Consumption with Net Metering have constant energy costs. Opposite to this, Self Consumption in special regime (without Net Metering) continue selling energy to the grid and continue decreasing their yearly total energy cost. So, for big installations with high peak power installed, yearly energy cost can be lower in Self Consumption installations in special regime than in Self Consumption installations with Net Metering.
Figure 9: Annual cost of energy for 3 models and different installed peak power.
5 ECONOMIC FEASIBILITY STUDY OF SELF- CONSUMPTION MODELS
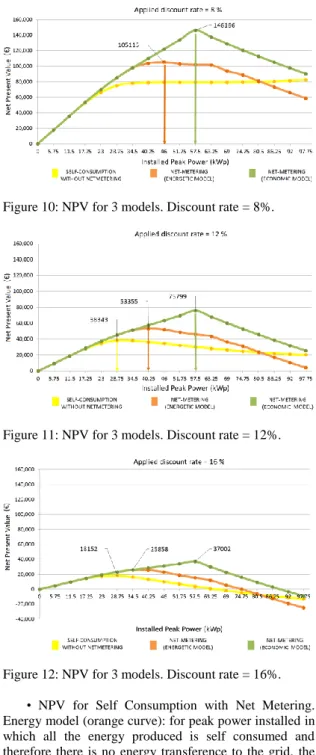
After the analysis and energy cost comparison done to 3 models of Self Consumption, it´s convenient to know which peak power installed optimizes the value of each model. For that, it has been done a Net Present Value (since now on NPV) analysis of the energy cost savings obtained with each model for several peak power installed.
the project will decrease when the peak power installed increase.
This model obtains the maximum profitability (maximum NPV) for peak power installed in which the installation can consume instantly most of the energy produced. Optimal peak power installed is between 40.25 kWp (discount rate=8%) and 28.75 kWp (discount rate=16%). For peak power installed over these values, the investment done to increase peak power is not compensated with the profit obtained by energy sold to the grid.
Figure 10: NPV for 3 models. Discount rate = 8%.
Figure 11: NPV for 3 models. Discount rate = 12%.
Figure 12: NPV for 3 models. Discount rate = 16%.
• NPV for Self Consumption with Net Metering. Energy model (orange curve): for peak power installed in which all the energy produced is self consumed and therefore there is no energy transference to the grid, the behaviour is similar to Self Consumption in special regime. When peak power is enough to transfer energy to the grid energy consumption rights are generated. If the energy transferred is recovered, then roughly 55% of the purchase price of that energy is recovered (the other 45% is the transport toll). Rights that cannot be recovered will
not generate profit to the system. From the feasibility study, the optimal installed peak power is between 34.50 kWp and 46.00 kWp. Increasing installed peak power over those values, NPV curve has negative slope. Since 63.25 kWp of installed peak power, Net Metering is completed for 2 tariff periods with energy generation and NPV slope becomes even more negative because is not possible to recover more consumption rights.
• NPV for Self-Consumption with Net Metering. Economic model (green curve): for peak power installed in which all the energy produced is self consumed, the behaviour is similar to both previous models. Increasing the peak power installed, starts the energy transference to the grid, generating economic consumption rights that could be consumed in any of the tariff periods; that´s the reason why can be recovered more rights than in the energy model and therefore corresponding NPV curve increases more than the others.
The optimal peak power installed is 57.50 kWp. Values of peak power installed over that have nonsense because all the energy will be lost as the total Net Metering is reached for 57.50 kWp.
6 CONCLUSIONS
In Spain, Royal Decree 1699/2011 regulating grid connection of small power plants, opened the door to
Self-Consumption. However Electric Supplying
companies are reluctant to legalize Net Metering because they see a menace in their oligopoly of power generation. Spanish Photovoltaic sector is very aware on the steps that present government is giving related to Self-Consumption and Net Metering.
Present study has permitted to create a tool for sizing Self-Consumption photovoltaic plants, optimizing the cost of energy and the NPV of a defined installation. The sizing process and result depend on the consumer demand curve.
According to present study, the great advantages of photovoltaic Self-Consumption are the energy-economic savings and its feasibility.
With photovoltaic Self-Consumption, electricity doesn´t move through big distances, so grid energy losses are avoided. Moreover, generation is done with clean technologies, reducing fossil fuels use and also reducing energy dependence.
Finally, photovoltaic Self-Consumption will promote the employment and the economic activity in Spanish renewable energy sector, increasing demand on photovoltaic modules and permitting start up of new local companies to install and maintain home and small installations. Self-Consumption could ensure the future of the sector.
7 REFERENCES
[1]Real Decreto 1699/2011, de 18 de noviembre, por el que se regula la conexión a red de instalaciones de producción de energía eléctrica de pequeña potencia. Madrid, 2011. In Spanish.
[2]Directive 2009/28/EC of the European Parliament and of the Council of 23 April 2009 on the promotion of the use of energy from renewable sources. Brussels, 2009.
[3]E. Daroqui, Autoconsumo fotovoltaico doméstico e industrial. Grupo Elecnor. 2013. In Spanish.
marco del sector eléctrico español”. Iberdrola. Bilbao, 2012. In Spanish.
[5]Real Decreto-ley 1/2012, de 27 de enero, por el que se procede a la suspensión de los procedimientos de preasignación de retribución y a la supresión de los incentivos económicos para nuevas instalaciones de producción de energía eléctrica a partir de cogeneración, fuentes de energía renovables y residuos. Madrid, 2012. In Spanish.
[6]MITC, Ministerio de Industria, Turismo y Comercio. Proyecto de Real Decreto por el que se establece la regulación de las condiciones administrativas, técnicas y económicas de la modalidad de producción de energía en la modalidad de balance neto. Madrid, 2011. In Spanish.
[7]CNE, Comisión Nacional de la Energía. Informe sobre la propuesta de real decreto por el que se establece la regulación de las condiciones administrativas, técnicas y económicas de la modalidad de suministro de energía eléctrica con balance neto. Madrid, 2012. In Spanish.
ACKNOWLEDGEMENT