Manuscript submitted to Cement and Concrete Research
Hydration mechanisms of two polymorphs of synthetic ye’elimite
A. Cuestaa, G. Álvarez-Pinazoa, S. G. Sanfélixb, I. Peralc, M. A. G. Arandaa,c,A. G. De la Torrea,*.
a
Departamento de Química Inorgánica, Universidad de Málaga, Campus Teatinos S/N. 29071-Málaga, Spain.
b
Unidad Técnica de Investigación de Materiales, AIDICO, Avda. Benjamín Franklin, 17 Paterna, Valencia, Spain.
c
ALBA-CELLS synchrotron, Carretera BP 1413, Km. 3.3, E-08290 Cerdanyola, Barcelona, Spain.
Abstract 1
Ye’elimite is the main phase in calcium sulfoaluminate cements and also a key phase in sulfobelite 2
cements. However, its hydration mechanism is not well understood. Here we reported new data on 3
the hydration behaviour of ye’elimite using synchrotron and laboratory powder diffraction coupled 4
to the Rietveld methodology. Both internal and external standard methodologies have been used to 5
determine the overall amorphous contents. We have addressed the standard variables: water-to-6
ye’elimite ratio and additional sulfate sources of different solubility. Moreover, we report a deep 7
study of the role of the polymorphism of pure ye’elimites. The hydration behaviour of orthorhombic 8
stoichiometric and pseudo-cubic solid-solution ye’elimites is discussed. In the absence of additional 9
sulfate sources, stoichiometric-ye’elimite reacts slower than solid-solution-ye’elimite, and AFm-10
type phases are the main hydrated crystalline phases, as expected. Moreover, solid-solution-11
ye’elimite produces higher amounts of ettringite than stoichiometric-ye’elimite. However, in the 12
presence of additional sulfates, stoichiometric-ye’elimite reacts faster than solid-solution-ye’elimite. 13
14 15
Keywords: Hydration mechanism (A), Rietveld method (B), dissolution and crystallization kinetics 16
(A), calcium sulfoaluminate (D) ye’elimite (D). 17
1. Introduction 1
Ye’elimite is the most important phase in calcium sulfoaluminate cements (CSA) [1], which are 2
very promising environmentally-friendly materials. These cements address one of the major 3
concerns of the cement industry as they allow decreasing the CO2 footprint of cement production.
4
On average, for every ton of ordinary Portland cement (OPC) produced, 0.97 tons of CO2 are
5
released into the atmosphere, with the cement industry contributing around 6% of all anthropogenic 6
CO2 emissions translating into approximately 4% of the planet’s global warming[2]. By
7
comparison, CSA cements are produced with significantly lower CO2 emissions relative to OPC,
8
achieved through the use of lower amount of carbonated raw-materials (part of calcite is replaced 9
by gypsum) and a reduced clinkering temperature [1]. The overall CO2 emission reduction can
10
amount up to 40% [3]. CSA binders may have quite variable compositions, but all of them contain 11
ye’elimite phase, Ca4Al6O12SO4, also called Klein’s salt or tetracalcium trialuminate sulfate
12
(C4A3𝑆̅ in cement nomenclature) as their main phase [4,5]. The term CSA cements are usually
13
reserved for those clinkers containing more than 50 wt% of ye’elimite and they may also have 14
minor amount of phases as belite, tetracalcium aluminoferrate, anhydrite, gehlenite or mayenite [6]. 15
Cements with large amounts of ye’elimite may have special applications such as high strength 16
developments at early-ages [7]. Ye’elimite is also present, ~25 wt%, in sulfobelite cements [8,9]. 17
CSA cements were introduced into the Chinese market as a result of the high-performing and 18
dimensionally-stable cementitious matrices develop by China Building Materials Academy [10]. In 19
Europe, the use of CSA cements is limited by the lack of standards concerning special cements 20
derived from non-Portland clinkers. Nevertheless, the manufacture and marketing of CSA cements 21
has recently been started by several European cement companies [4,11-13]. 22
This work is focus on the reactivity of ye’elimite. Stoichiometric ye’elimite has been reported to be 23
orthorhombic at room temperature [(14, 15] and solid solutions of this phase crystallize in a cubic 24
structure [16,17]. There are some studies about the influence of clinkering process on mineral 25
formation of calcium sulfoaluminate based clinkers [18,19]. They have proved that minor elements, 26
such as iron, form solid solution with ye’elimite and stabilize the cubic form. The effect of 27
ye’elimite polymorphism on hydration mechanism has been also addressed. However, these 28
systems are complex and there are too many parameters, f.i. type and amount of sulfate source, 29
belite polymorphism, water/solid ratio, etc., affecting the hydration mechanisms. Consequently, a 30
simplification of the problem by the study of pure phases is advisable. 31
During early age hydration of ye’elimite in the presence of a sulfate source like gypsum, bassanite 32
or anhydrite, ettringite (AFt, C6A𝑆̅3H32) phase is the main crystalline hydration product, reaction
(1) [20, 21]. On the other hand, ye’elimite is able to react with water to form AFm (monosulfate) 1
according to reaction (2) [20]. In both reactions amorphous aluminium hydroxide is formed. 2
C4A3𝑆̅ + 2C𝑆̅Hx + (38-2x)H → C6A𝑆̅3H32 + 2AH3 (1)
3
C4A3𝑆̅+ 18H → C4A𝑆̅H12 + 2AH3 (2)
4
It is known [20, 21] that for molar ratios of calcium sulfate to ye’elimite larger than 2, only reaction 5
(1) is taking place. However, there are some contradictory results concerning the reactivity of 6
ye’elimite with water in the absence of another sulfate source. Some authors stated that only 7
reaction (2) takes place [20] while others have published that mixtures of AFt and AFm phases are 8
produced [19, 22]. 9
On the other hand, X-ray powder diffraction (XRPD) is very well suited for in-situ studies of 10
chemical processes involving crystalline materials [23, 24]. During the last years, it has been 11
reported quantitative phase analysis of cements, clinkers and supplementary cementitious materials 12
by combining XRPD and Rietveld methodology [13, 25-27]. This combination results in Rietveld 13
quantitative phase analysis (RQPA). More recently, this procedure has been expanded to hydrated 14
cementitious systems [23, 28] and in some of these studies, the non diffracting fraction was 15
determined [29-31], although a more precise term has been coined: Amorphous and Crystalline not-16
quantified, content [32]. Furthermore, the use of an intense ray source, such as synchrotron X-17
rays, coupled with a fast X-ray detection system permits time-resolved diffraction experiments 18
allowing in-situ measurementsduring the hydration process of cements [19, 23]. 19
Here, we report a hydration study of two synthetic ye’elimite samples: stoichiometric ye’elimite 20
that presents an orthorhombic unit cell [15] and solid-solution ye’elimite that crystallizes in a 21
pseudo-cubic unit cell. The final goal is to understand the ye’elimite hydration mechanisms as a 22
function of ye’elimite polymorphism, water content and type and content of sulfate source. In order 23
to do so, laboratory and synchrotron XRPD (LXRPD and SXRPD) and Rietveld methodology are 24
employed. Kinetics of hydration have been established and correlated to calorimetric data. This 25
study is a step forward to better understand the eco-cement CSA performances at early ages. 26
27
2. Experimental Section 28
2.1. Sample Preparation. 29
Stoichiometric ye’elimite (C4A3𝑆̅), labelled hereafter st-C4A3𝑆̅, was prepared as previously 30
reported [15]. Solid-solution ye’elimite, labelled ss-C4A3𝑆̅ hereafter, was prepared as follows 31
(nominal composition: Ca3.8Na0.2Al5.6Fe0.2Si0.2O12SO4). Suitable amounts of CaCO3 (99.95%,
32
Alfa Aesar), Al2O3 (99.997%, Alfa Aesar), Fe2O3 (99.945%, Alfa Aesar), SiO2 (99.56%, ABCR),
Na2CO3 (99.999%, Sigma Aldrich) and CaSO4·2H2O (ground natural single-crystal from Málaga)
1
were used to obtain approximately 8 g of ss-C4A3𝑆̅. This composition was chosen following 2
previous studies of active belite CSA [13]. In that work we speculated with the simultaneous 3
presence of Na, Fe and Si within cubic ye’elimite as a consequence of an electron microscopy 4
study. Moreover, it has been previously reported [33] that the cubic symmetry could be restored by 5
substituting larger caged ions for Ca2+ or SO42- to expand the framework to a non-collapsed state
6
and by smaller framework cations such as B3+, Si4+ or Fe3+ for Al+3. Consequently, following our 7
previous results and that information reported by others, we were able to obtain ss-C4A3𝑆̅sample as 8
a pure single phase with the proposed composition. Further details about crystal structure and 9
thermal behaviour of this sample will be published elsewhere. 10
The mixture was ground for 1 hour in an agate mortar with ethanol. The resulting powder was 11
pelletized (20 mm diameter and 500 MPa) and heated at 1250ºC for 4 hours (heating rate of 5 12
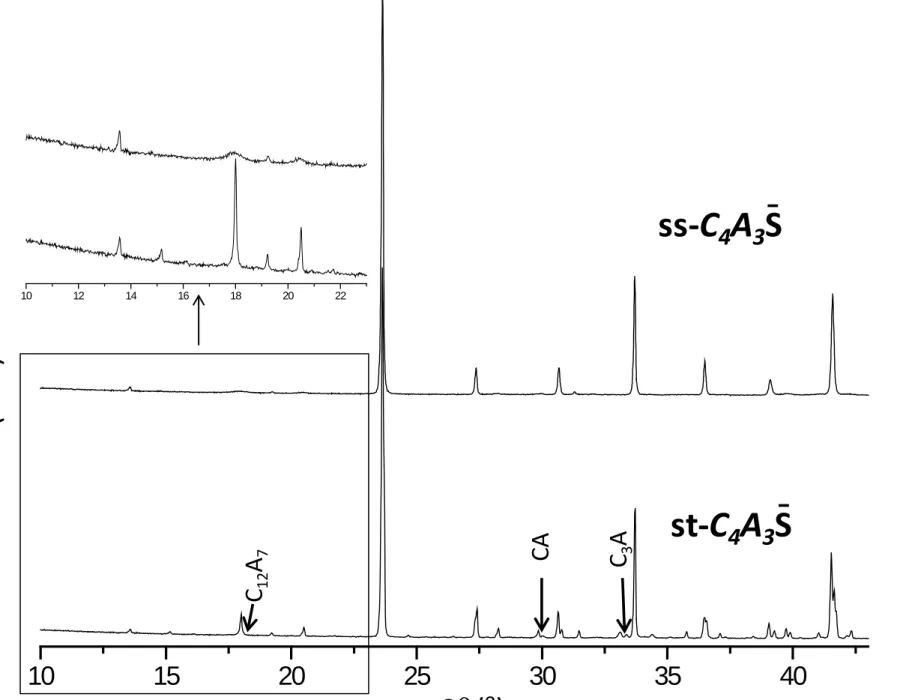
ºC/min) followed by a rapid cooling. The pellets were ground in an agate mortar. Figure 1 shows 13
the LXRPD raw patterns for both anhydrous samples. St-C4A3𝑆̅ sample presents 1.2(2) wt% of 14
C3A, 4.4(2) wt% of CA and 4.0(2) wt% of C12A7 as impurities [15].
15
St-C4A3𝑆̅ and ss-C4A3𝑆̅ were mixed with gypsum (g) or anhydrite (a), in some cases, according to 16
the stoichiometry of reactions (1) and (2). Table 1 reports pastes mix proportions, including 17
water/solid (w/s) ratios. The gypsum used for the hydration studies was that marketed by BELITH 18
S.P.R.L. (Belgium). Anhydrite was produced by heating that gypsum at 700ºC for 1 hour. Blaine 19
fineness for all the samples was ranged between 4400-5000 cm2/g. 20
Two experimental set ups were employed: i) in-situ SXRPD and ii) ex-situ LXRPD. For the in-situ
21
SXRPD study all the anhydrous mixtures were mixed with 15 wt% SiO2 (99.56%, ABCR) as an
22
internal standard [34] and powder diffraction data were collected to obtain the initial phase 23
assemblage (t0). It is important to bear in mind that in the water/solid ratio the amount of internal
24
standard is not taken into account. Pastes were ex-situ prepared and immediately loaded into glass 25
capillaries of 0.5 mm of diameter with a syringe. The capillaries were sealed with grease to avoid 26
any water loss. Moreover, we were aware that the internal standard could influence the 27
hydration/crystallization processes. We performed an internal study with and without internal 28
standard and check the reproducibility of the Rietveld QPA, observing only minor differences. 29
Consequently, we could trust in the results obtained by this methodology. On the other hand, for the 30
ex-situ LXRPD study, pastes were poured into hermetically closed Teflon® tubes in the form of 31
cylinder until 1 day. Then, the samples were taken out and stored within demineralised water at 32
20ºC. Pieces were taken out at ages ranging between 2 and 7 days. One fraction of the pastes was 33
filtration in a Whatman system (90 mm diameter Whatman filter with a pore size of 2.5 μm on a 1
Teflon support) with acetone twice and finally with ether. These samples were stored in a closed 2
desiccator (without vacuum application) to avoid further hydration and/or carbonation. 3
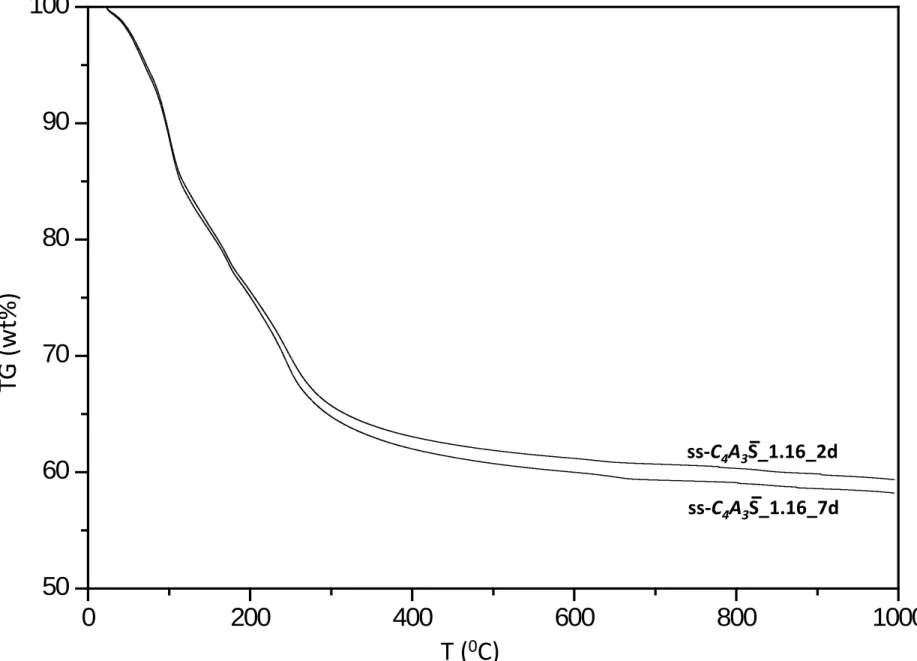
2.2. Thermal analysis. 4
Differential thermal analysis (DTA) and thermogravimetric (TGA) measurements were performed 5
in a SDT-Q600 analyzer from TA instruments (New Castle, DE) for stopped-hydration pastes. The 6
temperature was varied from RT to 1000ºC at a heating rate of 10 ºC/min. Measurements were 7
carried out in open platinum crucibles under nitrogen flow. The weighed loss from RT to 600ºC 8
was computed to be water (chemically bounded water) and that from 600 to 1000ºC was considered 9
as CO2. Table 2 and Figure S1, S2 and S3 (given as supporting information) report the TGA results.
10
2.3. Laboratory X-Ray powder diffraction (LXRPD) and Synchrotron X-Ray powder 11
diffraction (SXRPD). LXRPD data were recorded on an X’Pert MDP PRO diffractometer 12
(PANalytical) equipped with a Ge (111) primary monochromator, using strictly monochromatic 13
CuKα1 radiation (λ=1.54059 Å) and an X’Celerator detector. An overall measurement time of ∼ 4h
14
per pattern was required for good statistics over the angular range 5.0 - 70.0º (2θ) with a 0.017º step 15
size. 16
SXRPD patters were collected in Debye-Scherrer (transmission) mode using the X-ray powder 17
diffraction station of ALBA synchrotron (Barcelona, Spain) [35]. The wavelength, 0.61975(1) Å, 18
was selected with a double-crystal Si (111) monochromator and determined from Si640d NIST 19
standard (a=5.43123 Å). The diffractometer is equipped with a MYTHEN detector especially suited 20
for time-resolved experiments. The capillaries were rotated during data collection to improve 21
diffracting particle statistics and the synchrotron beam was focused in the detector to improve the 22
diffraction peak shape. The data acquisition time was ∼15 min per pattern to attain very good 23
signal-to-noise ratio over the angular range 1-35º (2θ). The temperature inside the experimental 24
hutch was 26(1) ºC. 25
2.4. XRPD Data Analysis. 26
Raw SXRPD patterns were normalized taking into account the decay of X-ray beam flux with time. 27
SXRPD and LXRPD patterns were analysed by using the Rietveld methodology as implemented in 28
the GSAS software package [36], in order to obtain RQPA. The refined overall parameters were 29
background coefficients, cell parameters, zero-shift error, peak shape parameters, and phase scales. 30
Peak shapes were fitted by using the pseudo-Voigt function [37]. The ACn contents were 31
determined by internal standard methodology [34] from SXRPD data and by external standard 32
2.5. Calorimetry. The isothermal calorimetric study was performed in an eight channel Thermal 1
Activity Monitor (TAM) instrument using glass ampoules. Pastes were prepared ex-situ by mixing 2
~ 6 g of each sample with the appropriated water and were immediately introduced in the 3
calorimeter. A stabilization period of 45 minutes was needed to start the measurements. The heat 4
flow was collected up to 7 days at 20ºC. 5
3. Results and discussions 6
3.1. Hydration of stoichiometric ye’elimite with variable water/solid ratios and without 7
additional sulfate source. 8
Hydration mechanism of st-C4A3𝑆̅ was initially studied without additional sulfate source and two 9
different w/s ratios (0.58 and 1.16), see Table 1. These pastes have been studied at early ages, up to 10
30 hours, by in-situ SXRPD with internal standard methodology. Time-resolved SXRPD was 11
employed to track the dissolution of the anhydrous phases followed by the crystallization of the 12
different hydrated phases (AFt and AFm). Moreover, the pastes were also prepared into cylinders 13
and studied with the external standard methodology, G-factor, at 2 days and 7 days by ex-situ
14
LXRPD. 15
The w/s ratio of 0.58 corresponds to the stoichiometric amount of water according to reaction (2) 16
with 10% of excess. The w/s value of 1.16 is the double of the previous value to study the effect of 17
large water excess on hydration mechanisms. Table 3 shows the phase assemblages at different ages 18
for st-C4A3𝑆̅_0.58 mixture. It is clear that for this w/s ratio the dissolution (and reaction) rate is very 19
slow, since up to 30 hours very small amount of ye’elimite was dissolved and there are no new 20
crystalline hydrates. After 2 days ye’elimite was partially dissolved and the precipitation of small 21
quantities of AFm and AFt were quantified. This observation indicates that both reactions (2) and 22
(1) are taking place. This observation disagrees with the thermodynamic calculation that predicts 23
that only reaction (2) should take place [20]. However, this experimental behaviour has been 24
previously reported [22]. 25
However, to disentangle the extension of both reactions is not an easy task. Interconversion between 26
AFt and AFm may take place depending upon the experimental conditions including the sulfate 27
concentration in the pore water. It has been observed that the crystallization of ettringite reaches a 28
maximum at 2 days of hydration, see Table 3, and then it diminishes. This effect has consequently 29
caused a lack of sulfate ions in the pore solution. For longer hydration times, the formation of AFm 30
is favoured not only from ye’elimite reaction but also likely from AFt dissolution. 31
It is well known that higher amounts of water enhance ye’elimite reactivity [38]. Thus, a paste with 32
a function of time, with peaks due to a given phase labelled. Table 4 gives RQPA results for
st-1
C4A3𝑆̅_1.16 from SXRPD and LXRPD data. Figure 3a shows the degree of reaction of ye’elimite 2
with water. Comparing Tables 3 and 4 and inspecting Figure 3a it is confirmed that reactivity has 3
been enhanced, achieving over 75% of degree of reaction at 7 days with w/s 0.58 and 20 hours, with 4
w/s 1.16. Calorimetric data, see Table 1 and Figure S5, show that more heat is released for w/s ratio 5
of 1.16 than for 0.58, which is in full agreement with a larger reaction degree. In this case, the main 6
hydration product has been AFm, at all hydration times, indicating that higher amounts of water 7
favour reaction (2). This behaviour is in agreement with that previously reported in [20], where only 8
AFm was obtained with a w/s ration of 2.0. However, w/s ratio of 1.16 is not high enough to avoid 9
reaction (1) and a small amount of AFt is also quantified. It is also observed that AFt content is 10
maximum at 2 days, and at later ages partly reacts. 11
The quantification of AFm-type phases presents two important problems: i) broad diffraction peaks 12
due to both poor crystallinity and highly disorder structures and ii) the lack of structural 13
descriptions for some phases. Thus, the crystal structure reported for C4A𝑆̅H12 [39] has been used
14
to quantify all AFm-type phases by adjusting c-values, as previously reported [19]. Other AFm type 15
phases, such as mono- and hemicarbonate AFm phases [40,41], were checked but they did not fit 16
properly the patterns. The AFm contents reported in Tables 3 and 4 are expressed as the total 17
amount of AFm-type phases. Figure 5 shows Rietveld plots of st-C4A3𝑆̅_1.16 at 2 days of hydration 18
where all the AFm-types phases have been labelled, as an example of a complex sample. Moreover, 19
we have observed that stopping procedure has affected the mineralogical composition, especially 20
AFm-type phases [42]. In the in-situ synchrotron experiment, the hydration was not stopped and 21
higher crystallinity and no modifications of its basal spacing was observed, see Figure 2 up to 31 h 22
of hydration. On the other hand, the ex-situ LXRPD data were collected for stopped samples and 23
broader peaks are observed. Three AFm-type phases with modified c-values are needed to fit the 24
pattern, see broad peaks labelled with a star in Figure 2 at 2 days. 25
Tables 3 and 4 include the ACn values obtained from internal and external standard methodologies. 26
The first column gives t0 values obtained from the SXRPD pattern of the anhydrous samples. Free
27
water, FW, in this column is the theoretical value. Remaining values obtained from internal 28
standard method encompass not only ACn but also FW (not chemically bound water) and are 29
expressed as a single value in Tables 3 and 4. This is due to the inability of the internal standard 30
methodology to distinguish between different not-diffracting phases. On the other hand, data 31
obtained with G-factor methodology from LXRPD, 2 days and 7 days, corresponds only to ACn 32
values, since FW was removed by the stopping hydration procedure. The FW contents were 33
determined from TGA study (from RT to 600ºC), Table 2 and Figures S1, S2 and S3. Consequently, 1
in Tables 3 and 4, ACn and FW values are given for data obtained from LXRPD. It is important to 2
highlight that the results obtained by the internal standard method are in agreement with those 3
obtained at later ages showing the consistence of both methodologies. 4
3.2. Hydration of ye’elimite as function of polymorphism and without additional sulfate 5
source. 6
In order to understand the role of polymorphism in the hydration mechanism, a solid-solution 7
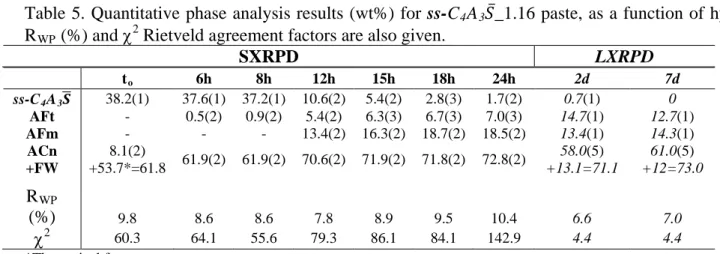
ye’elimite paste, with a w/s ratio of 1.16, (ss-C4A3𝑆̅_1.16), has also been studied. Table 5 shows 8
RQPA results at the measured ages. Comparing Tables 4 and 5, it can be observed that solid-9
solution ye’elimite reacts at a faster pace since after 12 hours the degree of reaction of ye’elimite is 10
~75%, Figure 3a. In addition to a faster kinetics, solid-solution ye’elimite yields much larger 11
relative amounts of AFt. Figures 4a and 4b show the evolution of sulfate content with time for
st-12
C4A3𝑆̅_1.16 and ss-C4A3𝑆̅_1.16 pastes. The amount of residual sulfate content was calculated using 13
the quantitative data reported in Tables 4 and 5 for C4A3𝑆̅, given as solid symbols. In addition, the 14
crystallized sulfate content was calculated from the quantified ettringite in Figure 4a (crossed 15
symbols) and global sulfate content from the amounts of ettringite jointly with AFm-phases in 16
Figure 4b. The dotted and dashed lines in Figures 4a and 4b represents the maximum sulfate group 17
content which can crystallize in each sample. As mentioned before, AFt crystallization in
ss-18
C4A3𝑆̅ Ris higher than in the stoichiometric sample. Moreover, ~17% and ~10% of hydrated sulfate
19
groups for st-C4A3𝑆̅ and ss-C4A3𝑆̅, respectively were mainly incorporated into ACn phase(s) and/or 20
in pore solution. Consistently with the former two studies, after two days the amount of AFt starts 21
to decrease. Calorimetric data, see Table 1 and Figure S5 (given as supporting information), show 22
that more heat is released by the solution sample, due to a larger reaction degree of solid-23
solution-ye’elimite and also to a larger relative amount of ettringite at seven days. The higher 24
dissolution rate of ss-C4A3𝑆̅ may be related by the release of Na+ to the pore solution, provoking a 25
similar effect (although less pronounced) than KOH [20]. 26
This third study is mainly focused on the soluble sulfate (gypsum and anhydrite) effect in the 1
hydration of ye’elimite. Both ye’elimites, stoichiometric and solid-solution, have been studied with 2
both type of sulfates, see Table 1. st-C4A3𝑆̅ was studied with two w/s ratios, 0.71 and 1.42. The w/s 3
ratio of 0.71 corresponds to the theoretical water, according to reaction (1) plus an excess of 10 4
wt%. The w/s ratio of 1.42 is the double of the latter to study the influence of a large w/s ratio. 5
Tables S1 and S2 show the RQPA obtained by SXRPD of these two mixtures. Firstly, AFm is not 6
observed and so only reaction (1) takes place, as expected. Secondly, the phase assemblage is not 7
modified with the increase of the w/s ratio but the reaction is accelerated, see Figure 3b. Finally, 8
from the in-situ SXRPD study it was observed that over 12 hours of hydration the dissolution of 9
reactants was complete for most of the samples, see Figure 3b. Consequently, these pastes have 10
only been studied by in-situ SXRPD. 11
To study the role of ye’elimite polymorphism in the hydration reactions, st-C4A3𝑆̅_g_1.42 and ss-12
C4A3𝑆̅_g_1.42 mixtures were prepared. RQPA obtained from SXRPD are given in Tables S2 and 13
S3. Moreover, the full phase content evolution is displayed in Figure 6, where calorimetric data are 14
also included. The calorimetric curve shows a broad and intense signal (between 5 to 12 hours of 15
hydration) associated to dissolution and precipitation processes [20]. The times for the maximum 16
heat release agree well with the progress of the reactions observed by SXRPD. For both pastes, the 17
reaction has almost finished after 14 hours of hydration, with a degree of reaction for ye’elimite 18
being ~100% and ~85%, for stoichiometric and solid-solution ye’elimite, respectively, see Figure 19
3b. Moreover, the overall reactivity of these two samples has also followed reaction (1). AFt is the 20
only crystalline hydrated product, consequently there should be an amorphous phase with 21
stoichiometry close to AH3. It is important to note that the hydration of st-C4A3𝑆̅ with a source of 22
sulfate is highly accelerated compared to that of the sample without gypsum. 23
The time evolution of ACn and FW contents in st-C4A3𝑆̅_g_1.42 and ss-C4A3𝑆̅_g_1.42 is reported 24
in Figure 6 and Tables S2 and S3. It can be observed that for both pastes, these values slightly 25
diminished with time. It is worth noting that the opposite behaviour is observed for samples without 26
gypsum. This is mainly due to the larger amounts of ettringite and the absence of AFm-type phases. 27
The main difference found between the hydration of st-C4A3𝑆̅_g_1.42 and that of ss-C4A3𝑆̅_g_1.42 28
is related to the reaction rate. The presence of gypsum has largely accelerated the hydration kinetic 29
of st-C4A3𝑆̅. Figure 3b displays the degree of reaction of ye’elimite in the presence of gypsum. It 30
can be observed that stoichiometric sample attained more than 50% of degree of reaction after 2.5 31
hours, meanwhile, solid-solution ye’elimite degree of reaction is almost 0%, at that time. This effect 32
has been corroborated by calorimetric measurements since most of the heat evolved by 33
see Figure S4. On the other hand, the presence of gypsum has accelerated little the hydration of 1
solid-solution ye’elimite. After ~12 h, the degree of reaction reached ~75%, in the absence and 2
presence of gypsum, Figure 3a and 3b, respectively. 3
A less soluble sulfate source [20], anhydrite, was also used to study its influence on the hydration 4
mechanism of ye’elimite. Table 1 gives the w/s ratio used, following the same criterion as in 5
previous pastes. The anhydrite study has been performed at early ages for the sake of comparison 6
with the gypsum study. Figure 7 shows raw SXRPD patterns as a function of time for st-7
C4A3𝑆̅_a_1.62 paste and Table 6 reports the RQPA for this mixture. The main hydration product is, 8
as in the presence of gypsum, ettringite. This is in agreement with reaction (1), although in this case 9
some (minor) amounts of AFm also crystallized during early hydration. The anhydrite is dissolved 10
at a very low pace, disappearing after 7 hours. Consequently, the pore solution was undersaturated 11
in calcium and sulfate with respect to gypsum or anhydrite [20]. As a consequence, AFm partly 12
precipitates or forms at early stage, first few hours. Once anhydrite starts to dissolve, close to the 13
third hour, AFt appears and AFm disappears, see Table 6. AFm content reaches a maximum content 14
at 3 hours under the given experimental conditions. 15
On the other hand, solid-solution ye’elimite with anhydrite and a w/s ratio of 1.62 has a slower 16
kinetic of hydration. Table 7 shows the phase assemblage as a function of time up to 9 hours. The 17
main difference between stoichiometric and solid-solution ye’elimite is the hydration pace, since
ss-18
C4A3𝑆̅ reacts slowly and at 9 hours the degree of reaction is as low as 13.5%, see Figure 3b and 19
Table 7. AFm is not observed at any time likely as a consequence of the slow dissolution pace of 20
solid-solution ye’elimite in these conditions. Figure 8a and 8b shows Rietveld plots of
st-21
C4A3𝑆̅_a_1.62 and ss-C4A3𝑆̅_a_1.62, respectively, at 3 hours of hydration. This Figure illustrates 22
the presence of both AFt and AFm for st-C4A3𝑆̅ sample, see Figure 8a, and the total absence of 23
hydration products for ss-C4A3𝑆̅ one. Calorimetric data have confirmed these differences. For st-24
C4A3𝑆̅_a_1.62, the heat released is much faster than for ss-C4A3𝑆̅_a_1.62, see Figure S4. This 25
observation fully agrees with the diffraction study described just above. 26
27
4. Conclusions 28
First of all, it is worth highlighting the successful synthetic procedure of a single phase of doped 29
ye’elimite by the addition of Na, Si and Fe in the structure. Moreover, this work reports new data on 30
the mechanisms for early age hydration of ye’elimite. Here we demonstrate that hydration kinetics 31
not only depends on the w/s ratio and the solubility of the additional sulfate source, but also on the 32
In the absence of additional sulfate sources, some findings should be highlighted: i) stoichiometric 1
ye’elimite reacts slower than solid-solution ye’elimite; ii) the formation of AFm-type phases from 2
stoichiometric ye’elimite is strongly accelerated by high w/s ratios; iii) in the investigated 3
experimental conditions, w/s ratios of 0.58 and 1.16, a mixture of AFm and AFt has been always 4
found although AFm was the crystalline hydrate phase in major content; and iv) solid-solution 5
ye’elimite produces higher amounts of ettringite than stoichiometric ye’elimite in similar hydrating 6
conditions. 7
In the presence of gypsum or anhydrite as additional sulfate sources, the key findings are: i) 8
stoichiometric ye’elimite reacts faster than solid-solution ye’elimite, and this difference is 9
exacerbated for anhydrite; ii) the formation of AFm-type phases at late ages is avoided by the 10
addition of gypsum and anhydrite; iii) for anhydrite addition, AFm is measured at very early ages 11
(first few hours); iv) the hydration of stoichiometric ye’elimite in the presence of gypsum is 12
accelerated when compared to the corresponding conditions without gypsum; v) the presence of 13
gypsum has little effect in the kinetics of hydration of solid-solution ye’elimite when compared to 14
the hydration if the absence of gypsum; finally and chiefly vi) the hydration of ye’elimite in 15
presence of anhydrite is very much slowed. 16
17
Acknowledgements 18
This work has been supported by Junta de Andalucía through P11-FQM-7517 research grant and by 19
Spanish MINECO through MAT2010-16213 research grant, which is co-funded by FEDER. ALBA 20
synchrotron is thanked for providing synchrotron beamtime at BL04-MSPD beamline. 21
References 22
[1] F.P. Glasser, L. Zhang, High-performance cement matrices based on calcium sulphoaluminate-23
belite compositions, Cem. Concr. Res. 31 (2001) 1881-1886. 24
[2] R.J. Flatt, N. Roussel, C.R. Cheeseman, Concrete: An eco material that needs to be improved, J. 25
Eur. Ceram. Soc. 32 (2012) 2787–2798. 26
[3] M.A.G.Aranda, A.G. De la Torre, Calcium sulfoaluminate cements and concretes, in
Eco-27
efficient concrete; Ed. F. Pacheco-Torgal, Ed. S.Jalali, Ed. J. Labrincha, Woodhead Publishing: 28
Cambridge, 2013, pp. 488-522. 29
[4] E. Gartner, Industrially interesting approaches to ‘‘low-CO2’’ cements, Cem. Concr. Res. 34
30
(2004), 1489-1498. 31
[5] I. Odler, Special Inorganic Cements, Taylor and Francis, London, 2000. 32
[6] S. Sahu, J. Majling, Phase compatibility in the system CaO–SiO2–Al2O3–Fe2O3–SO3 referred
33
to sulphoaluminate belite cement clinker, Cem. Concr. Res. 23 (1993) 1331–1339. 34
[7] K. Quillin, Performance of belite–sulfoaluminate cements, Cem. Concr. Res. 31 (2001) 1341-35
[8] G. Álvarez-Pinazo, I. Santacruz, L. León-Reina, M.A.G. Aranda, A.G. De la Torre, Hydration 1
Reactions and Mechanical Strength Developments of Iron-Rich Sulfobelite Eco-cements, Ind. Eng. 2
Chem. Res. 52 (2013), 16606-16614. 3
[9] V. Morin, G. Walenta, E. Gartner, P. Termkhajornkit, I. Baco, J.M. Casabonne, Hydration of a 4
Belite-Calcium Sulfoaluminate- Ferrite cement: AetherTM , Proceedings of the 13th international 5
Congress on the Chemistry of Cement, Madrid, Spain, 2011. 6
[10] L. Zhang, M. Su, Y. Wang, Development of the use of sulpho-and ferroaluminate cements in 7
China, Adv. Cem. Res. 11 (1999)15-22. 8
[11] G.S. Li, G. Walenta, E.M. Gartner, Formation and hydration of low-CO2 cements based on
9
belite, calcium sulfoaluminate and calcium aluminoferrite, Proceedings of the 12th ICCC, Montreal, 10
Canada (2007). 11
[12] M.C.G. Juenger, F. Winnefeld, J.L. Provis, J.H. Ideker, Advances in alternative cementitious 12
binders, Cem. Concr. Res. 41 (2011) 1232-1243. 13
[13] G. Álvarez-Pinazo, A. Cuesta, M. García-Maté, I. Santacruz, E.R. Losilla, A.G. De la Torre, L. 14
León-Reina, M.A.G. Aranda, Rietveld quantitative phase analysis of Yeelimite-containing cements, 15
Cem. Concr. Res. 42 (2012) 960-971. 16
[14] N.J. Calos, C.H.L. Kennard, A.K. Whittaker, R.L. Davis, Structure of calcium aluminate 17
sulfate Ca4Al6O16S, J. Solid State Chem. 119 (1995) 1-7.
18
[15] A. Cuesta, A.G. De la Torre, E.R. Losilla, V.K. Peterson, P. Rejmak, A. Ayuela, C. Frontera, 19
M.A.G. Aranda, Structure, atomistic simulations, and phase transition of stoichiometric yeelimite, 20
Chem. Mater. 25 (2013) 1680-1687. 21
[16] O. Andac and F.P. Glasser, Polymorphism of calcium sulphoaluminate (Ca4Al6O16·SO3) and
22
its solid solutions, Adv. Cem. Res. 6 (1994) 57-60. 23
[17] M. Idrissi, A. Diouri, D. Damidot, J.M. Greneche, M. Alami Talbi, M. Taibi, Charactersation 24
of iron inclusion during the formation of calcium sulfoaluminate phase. Cement and Concrete 25
research 40 (2010), 1314-1319. 26
[18] F. Bullerjahn, D. Schmitt, M. Ben Haha, Effect of raw mix design and of clinkering process on 27
the formation and mineralogical composition of (ternesite) belite calcium sulphoaluminate ferrite 28
clinker, Cem. Concr. Res. 59 (2014) 87-95. 29
[19] G. Álvarez-Pinazo, A. Cuesta, M. García-Maté, I. Santacruz, E. R. Losilla, L.M. Ordóñez, S. 30
G. Sanfélix, F. Fouth, M.A.G. Aranda, A. G. De la Torre, In-situ early-age hydration study of 31
sulfobelite cements by synchrotron powder diffraction, Cem. Concr. Res. 56 (2014) 12-19. 32
[20] F. Winnefeld, S. Barlag, Calorimetric and thermogravimetric study on the influence of calcium 33
sulfate on the hydration of ye’elimite, J. Therm. Anal. Calorim. 101 (2010) 949-957. 34
[21] C.W. Hargis, A.P. Kirchheim, P.J.M. Monteiro, E.M. Gartner, Early age hydration of calcium 35
suloaluminate (synthetic ye’elimite, C4A3S) in the presence of gypsum and varying amounts of
36
calcium hydroxide, Cem. Concr. Res. 48 (2013) 105-115. 37
[22] S. Berger, C. Cau-Dit-Coumes, P. Le Bescop, D. Daminot, Influence of a thermal cycle at early 38
age on the hydration of calcium sulphoaluminate cements with variable gypsum contents, Cem. 39
Concr. Res. 41 (2011) 149-160. 40
[23] M. Merlini, G. Artioli, C. Meneghini, T. Cerulli, A. Bravo, F. Cella, The early hydration and 41
the set of Portland cements: In situ X-ray powder diffraction studies, Powder Diffr. 22 (2007) 201-42
[24] R. Snellings, G. Mertens, R. Adriaens, J. Elsen, In situ synchrotron X-ray powder diffraction 1
study of the early age hydration of cements blended with zeolite and quartzite fines and water-2
reducing agent, J. Appl. Clay Sci. 72 (2013) 124-131. 3
[25] A.G. De la Torre, A. Cabeza, A. Calvente, S. Bruque, M.A.G. Aranda, Full phase analysis of 4
Portland clinker by penetrating synchrotron powder diffraction, Anal. Chem. 73 (2001) 151-156. 5
[26] A.G. De la Torre, M.A.G. Aranda, Accuracy in Rietveld quantitative phase analysis of 6
Portland cements, J. Appl. Cryst. 36 (2003) 1169-1176. 7
[27] L. León-Reina, A.G. De la Torre, J.M. Porras-Vázquez, M. Cruz, L.M. Ordonez, X. Alcobe, F. 8
Gispert-Guirado, A. Larrañaga-Varga, M. Paul, T. Fuellmann, R. Schmidt, M.A.G. Aranda, Round 9
robin on Rietveld quantitative phase analysis of Portland cements, J. Appl. Cryst. 42 (2009) 906-10
916. 11
[28] K.L. Scrivener, T. Füllmann, E. Gallucci, G. Walenta, E. Bermejo, Quantitative study of 12
Portland cement hydration by X-ray diffraction/Rietveld analysis and independent methods, Cem. 13
Concr. Res. 34 (2004) 1541-1547. 14
[29] S.R. Klaus, J. Neubauer, F. Goetz-Neunhoeffer, Hydration kinetics of CA2 and
CA-15
Investigations performed on a synthetic calcium aluminate cement, Cem. Concr. Res. 43 (2013) 62-16
69. 17
[30] D. Jansen, F. Goetz-Neunhoeffer, C. Stabler, J. Neubauer, A remastered external standard 18
method applied to the quantification of early OPC hydration, Cem. Concr. Res. 41 (2011) 602-608. 19
[31] S.M. Clark, P. Barnes, A comparison of laboratory, synchrotron and neutron diffraction for the 20
real time study of cement hydration, Cem. Concr. Res. 25 (1995) 639-646. 21
[32] M.A.G. Aranda, A.G. De la Torre, L. León-Reina, Rietveld Quantitative Phase Analysis of 22
OPC Clinkers, Cements and Hydration Products, Rev. Mineral. Geochem. 74 (2012) 169-209. 23
[33] C.W. Hargis, J. Moon, B. Lothenbach, F. Winnefeld, H-R. Wenk, P. J.M. Monteiro, Calcium 24
Sulfoaluminate Sodalite (Ca4Al6O12SO4) Crystal Structure Evaluation and Bulk Modulus
25
Determination, J. Am. Ceram. Soc. 97 (2014) 892-898. 26
[34] A.G. De la Torre, S. Bruque, M.A.G. Aranda, Rietveld quantitative amorphous content 27
analysis, J. Appl. Crystallogr. 34 (2001) 196-202. 28
[35] F. Fauth, I. Peral, C. Popescu, M. Knapp, The new Material Science Powder Diffraction 29
beamline at ALBA Synchrotron, Powder Diffr. 28 (2013) S360-S370. 30
[36] A.C. Larson, R.B. Von Dreele, General Structure Analysis System (GSAS), Los Alamos 31
National Laboratory Report LAUR (2000) pp 86-748. 32
[37] P. Thompson, D.E. Cox, J.B. Hasting, Rietveld refinement of Debye-Scherrer synchrotron X-33
ray data from Al2O3, J. Appl. Cryst. 20 (1987) 79-83.
34
[38] M. Doval, M. Palou, V. Kovar, Heat evolution and mechanism of hydration in CaO-Al2O3
-35
SO3 system, Ceram. Silik. 49 (2005) 104-108.
36
[39] R. Allmann, Refinement of the hybrid layer structure [Ca2Al(OH)6]+·[1/2SO4·3H2O]-, Neues.
37
Jahrb. Mineral. Monatsh. (1977) 136-144. 38
[40] M. François, G. Renaudin, O. Evrad, A cementitious compound with composition 39
3CaO•Al2O3•CaCO3•11H2O, Acta Cryst. C 54 (1998) 1214-1217.
40
[41] T. Runcevski, R.E. Dinnebier, O.V. Magdysyuk, H. Pöllmann, Crystal structures of calcium 41
hemicarbo aluminate and carbonated calcium hemicarboaluminate from synchrotron powder 42
[42] L. Zhang, F.P. Glasser, Critical examination of drying damage to cement pastes, Adv. Cem. 1
Res. 12 (2000) 79-88. 2
3 4
Figure Captions
5
Figure 1. Selected range of the LXRPD raw patterns for st-C4A3𝑆̅ Rand ss-C4A3𝑆̅. Stars stand for
6
main peaks of minor impurities. Inset detail the low-angle range. 7
Figure 2. Selected range of the SXRPD and LXRPD raw patterns for st-C4A3𝑆̅_1.16 recorded at 8
different hydration ages. The main peaks due to a given phase are labelled; AFt: circle, AFm: star, 9
C4A3𝑆̅: square, Qz: triangle. 10
Figure 3. Degree of dissolution/reaction [α] of ye’elimite as a function of time for (a) st-C4A3𝑆̅ and 11
ss-C4A3𝑆̅ pastes without additional sulfate source; and (b) st-C4A3𝑆̅ and ss-C4A3𝑆̅ pastes with 12
gypsum or anhydrite. 13
Figure 4. Evolution of sulfate groups in st-C4A3𝑆̅_1.16R (square)and ss-C4A3𝑆̅_1.16R (circle) for (a)
14
residual (solid symbols) and crystallized only as ettringite (crossed symbols) and (b) residual (solid 15
symbols) and totally crystallized as AFt and AFm-phases (open symbols). Dashed and dotted lines 16
represent the maximum values of sulfate groups that could crystallize. 17
Figure 5. LXRPD Rietveld plot for st-C4A3𝑆̅_1.16 at 2 days of hydration, with the main peaks due 18
to a given phase labelled; AFt: circle, AFm: star, C4A3𝑆̅: square. 19
Figure 6. Full quantitative phase analysis results for a) st-C4A3𝑆̅_g_1.42 and b) ss-C4A3𝑆̅_g_1.42. 20
Calorimetric heat flow curves (dashed line) are also displayed. 21
Figure 7. Selected range of the SXRPD raw patterns for st-C4A3𝑆̅_a_1.62 recorded at different 22
hours of hydration, with the main peaks due to a given phase labelled; AFt: circle, AFm: star, 23
C4A3𝑆̅: square, Qz: triangle; CS�: rhombus. 24
Figure 8. SXRPD Rietveld plots for a) st-C4A3𝑆̅_a_1.62 at 3 hours of hydration, with the main 25
peaks due to a given phase labelled. Inset: Enlargement of the low angle region. b)
ss-26
C4A3𝑆̅_a_1.62, at 3 hours of hydration, with the main peaks due to a given phase labelled; AFt: 27
circle, AFm: star, C4A3𝑆̅: square, Qz: triangle; CS�: rhombus 28
Table 1. Paste mix proportions in weight percentages (wt%). The total heat evolved at 7 days of hydration is also given.
Mixture st-C4A3𝑺�
wt%
ss-C4A3𝑺�
wt%
gypsum/anhydrite wt%
water/solid Total heat
(J/g)
st-C4A3𝑺�_0.58 100 - - 0.58 391
st-C4A3𝑺�_1.16 100 - - 1.16 555
ss-C4A3𝑺�_1.16 - 100 - 1.16 577
st-C4A3𝑺�_g_0.71 64.1 - 35.9/- 0.71 -
st-C4A3𝑺�_g_1.42 64.1 - 35.9/- 1.42 518
ss-C4A3𝑺�_g_1.42 - 64.1 35.9/- 1.42 488
st-C4A3𝑺�_a_1.62 69.0 - -/31.0 1.62 566
ss-C4A3𝑺�_a_1.62 - 69.0 -/31.0 1.62 544
Table 2. Summary of the weight losses from the TGA study for pastes without additional sulfate source.
mixture Hydration
time / d
Theoretical
weight loss# / %
Weight loss RT-600ºC / %
Weight loss 600-1000ºC / %
st-C4A3𝑺�_0.58 2d 36.7 25.5 0.9
7d 36.7 32.1 1.3
st-C4A3𝑺�_1.16 2d 53.7 36.7 1.5
7d 53.7 35.8 1.8
ss-C4A3𝑺�_1.16 2d 53.7 38.8 1.8
7d 53.7 39.9 1.8
#
Theoretical weight loss: total initial free water.
Table 3. Quantitative phase analysis results (wt%) for st-C4A3𝑆̅_0.58 paste, as a function of hydration time obtained by SXRPD and LXRPD. RWP (%) and χ2 Rietveld
agreement factors are also given.
SXRPD LXRPD
to 8h 24h 30h 2d 7d
st-C4A3𝑺� 61.1(1) 54.1(1) 51.6(1) 46.4(1) 34.3(1) 10.6(2)
AFt - - 0.3(1) 0.5(1) 6.3(3) 4.7(1)
AFm - - 0.6(1) 3.2(1) 7.1(3) 20.2(4)
ACn +FW
2.2(1)
+36.7*=38.9 45.9(1) 47.6(1) 49.9(1)
41.0(4) +11.3=52.3
59.9(5) +4.9=64.5
RWP(%) 6.2 5.5 5.2 5.6 8.1 10.3
χ2 29.7 30.7 28.2 25.3 4.6 7.0
Table 4. Quantitative phase analysis results (wt%) for st-C4A3𝑆̅_1.16 paste, as a function of hydration time obtained by SXRPD and LXRPD. RWP (%) and χ2 Rietveld
agreement factors are also given.
SXRPD LXRPD
to 12h 18h 24h 31h 2d 7d
st-C4A3𝑺� 44.9(1) 43.0(1) 29.4(1) 10.3(3) 9.2(3) 4.6(2) 2.9(2)
AFt - - 2.3(1) 1.1(2) 1.0(2) 9.2(3) 6.8(3)
AFm - - 7.1(1) 22.0(2) 22.2(2) 25.1(4) 25.8(5)
ACn +FW
1.4(1)
+53.7*=55.1 57.0(1) 61.2(1) 66.5(2) 67.6(2)
44.1(5) +17=61.1
46.5(6) +17.9=64.4
RWP (%) 6.2 4.9 4.7 11.4 12.8 10.0 10.5
χ2
Table 5. Quantitative phase analysis results (wt%) for ss-C4A3𝑆̅_1.16 paste, as a function of hydration time obtained by SXRPD and LXRPD. RWP (%) and χ2 Rietveld agreement factors are also given.
SXRPD LXRPD
to 6h 8h 12h 15h 18h 24h 2d 7d
ss-C4A3𝑺� 38.2(1) 37.6(1) 37.2(1) 10.6(2) 5.4(2) 2.8(3) 1.7(2) 0.7(1) 0
AFt - 0.5(2) 0.9(2) 5.4(2) 6.3(3) 6.7(3) 7.0(3) 14.7(1) 12.7(1)
AFm - - - 13.4(2) 16.3(2) 18.7(2) 18.5(2) 13.4(1) 14.3(1)
ACn +FW
8.1(2)
+53.7*=61.8 61.9(2) 61.9(2) 70.6(2) 71.9(2) 71.8(2) 72.8(2)
58.0(5) +13.1=71.1
61.0(5) +12=73.0
RWP
(%) 9.8 8.6 8.6 7.8 8.9 9.5 10.4 6.6 7.0
χ2
Table 6. Quantitative phase analysis results (wt%) for st-C4A3𝑆̅_a_1.62 paste, as a function of hydration time obtained by SXRPD. RWP (%) and χ2 Rietveld agreement
factors are also given.
Wt% to 1h 2h 3h 7h
st-C4A3𝑺� 23.9(1) 25.0(1) 17.2(1) 2.3(2) 0.7(1)
C𝐒� 10.8(2) 11.1(1) 10.0(1) 6.0(1) 0.3(1)
AFt - 1.3(1) 4.3(1) 19.0(2) 45.2(3)
AFm - - 4.4(1) 10.5(2) 1.4(1)
ACn +FW
4.0(1)
+61.3*=65.3 62.6(1) 64.2(1) 62.3(1) 52.3(1)
RWP
(%) 5.5 3.2 3.8 6.2 3.9
χ2
22.2 7.8 12.0 32.0 17.5 *Theoretical free water content
Table 7. Quantitative phase analysis results (wt %) for ss-C4A3𝑆̅_a_1.62 paste, as a function of hydration time obtained by SXRPD. RWP (%) and χ2 Rietveld agreement
factors are also given.
Wt% to 2h 3h 7h 9h
ss-C4A3𝑺� 20.6(1) 22.4(1) 22.6(1) 20.4(1) 17.8(1)
C𝐒� 10.7(2) 11.2(1) 11.6(1) 9.9(1) 8.7(1)
AFt - - 0.2(1) 3.5(2) 8.1(2)
ACn +FW
7.4(1)
+61.3*=68.7 66.4(1) 65.6(1) 66.2(1) 65.3(1)
RWP (%) 7.7 5.5 5.5 5.4 5.0
χ2
63.5 29.8 28.5 21.7 16.6
Figure 1
10
15
20
25
30
35
40
ss-C
4
A
3
S
st-C
4
A
3
S
C
12A
7CA
C
A
3I (
u.a
.)
2
θ
(
0
)
0.04
0.06
0.08
0.10
0.12
0.14
0.16
sen
θ/
λ
(
Å
-1)
t
018 h
31 h
2 d
0 20 40 60 80 100
1 10 165
0 20 40 60 80 100
st-C4A3S_0.58
st-C4A3S_g_0.71
st-C4A3S_g_1.42
ss-C4A3S_g_1.42
st-C4A3S_a_1.62
ss-C4A3S_a_1.62
st-C4A3S_1.16 ss-C4A3S_1.16
t (h)
α
(%
)
α
(%
)
a)
b)
0 2 4 6 8
a)
b)
Su
lfa
te
co
nte
nt
(w
t%
)
max ss max st
y
5.0 10.0 15.0 20.0 25.0
LXRPD
Counts
X10\u 3
0.0
2.0
4.0
2\gH, deg
Figure
4
R
WP=10.0%
χ2
=7.1
0 20 40 60 80 100
w
t (
%)
0.000 0.005 0.010 0.015 0.020 0.025
N
or
m
al
iz
ed
heat
flow
(W
/g)
Ye’elimite
Gypsum
ACn+FW
AFt
0 5 10 15 20
0 20 40 60 80 100
w
t (
%)
t (h)
0.000 0.005 0.010 0.015 0.020 0.025
N
or
m
al
iz
ed
heat
flow
(W
/g)
a)
4
6
8
10
12
2
θ
(
0)
I (
u.a.
)
1h
2h
3h
7h
t
0Figure 7
SXRPD
y 2\gH, deg C ount s
4.0 6.0 8.0 10.0 12.0 14.0
X 10 \u 4 0 .0 0 .5 1 .0
Figure 8
y 2\gH, deg C oun ts4.0 6.0 8.0 10.0 12.0 14.0
X 10\ u 4 0 .0 0 .2 0 .4 0 .6 0 .8 1 .0
a)
b)
SXRPD
λ
=0.62 Å
SXRPD
λ
=0.62 Å
y 2\gH, deg Coun ts
3.0 3.2 3.4 3.6 3.8 4.0 4.2 4.4
0
200
400
600
800
1000
50
60
70
80
90
100
st-C
4A
3S_0.58_2d
st-C
4A
3S_0.58_7d
T (
0C)
TG
(wt
%
)
Figure S2
0
200
400
600
800
1000
50
60
70
80
90
100
T (
0C)
st-C
4A
3S_1.16_7d
st-C
4A
3S_1.16_2d
TG
(wt
%
Figure S3
0
200
400
600
800
1000
50
60
70
80
90
100
T (
0C)
TG
(wt
%
)
ss-C
4A
3S_1.16_2d
Figure S4
0
10
20
30
40
0.00
0.05
0.10
N
or
m
al
iz
ed heat
f
low
(W
/g)
t(h)
Figure S5
0
20
40
60
80
100
120
140
160
0
100
200
300
400
500
600
T
ot
al
heat
(
J/
g)
t (h)
0 2 4 6 8 10 12 14
1 10
0 2 4 6 8 10 12 14
Su
lfa
te
co
nte
nt
(w
t%
)
max st & ss
max ss max st