This research aims to investigate the relationship between operating efficiency and financial performance of the company on capital structure indicated in terms of the relative balance of the company's financing sources using earnings management as a moderator variable in the process of management decision-making regarding improving the balance of the firm's capital structure. Finally, the statistical results show that all the variables used in the third regression model, namely earnings management, Tobin's Q ratio and firm size have a significant negative relationship with the capital structure of the firm. The possible impact of capital structure policy is therefore that it can increase both profits and losses of the firm according to the situation (Ross, Westerfield, & Jordan, 2001).
Earnings management philosophy is to take advantage of the standard method flexibility and accepted accounting principles. Earnings management is one important feature of the quality of financial reporting and the main issue among all stakeholders of the company. Ranjan and Bishnu (2017) delve into the determinants of the financial performance of textile sector firms listed in the Dhaka stock exchange.
The operating efficiency of a business in relation to the efficient utilization of the resources is reflected in net profit margin. The capital structure decisions mainly aim to achieve the optimal level of capital financing that maximizes the profitability of the company and in turn the shareholders' value. This is often caused, as a rule, by a misconception of the current profitability and future prospects of the firm.
This conclusion supports Anderson's research on British companies, which shows a negative relationship between short-term borrowing and liquid assets of the company.
Liquidity and Earnings Management
As for the interest of one of the managers to receive a reward, he will be motivated and have a lot of incentive to do everything possible to fix the company's profits. The greater the profits that the company brings, the greater the desire of investors to inject capital. Purnama and Nurdiniah (2018) investigated the impact of profitability and firm size on earnings management with managerial ownership as moderation, they use 60 companies listed on the Indonesia Stock Exchange in the period 2012-2016.
The findings show that profitability has a significant positive impact on earnings management, while firm size has a negative impact on earnings management. The findings also show that financial leverage has a significant negative impact on the bank's capital adequacy ratio, and as financial leverage increases, the bank's capital adequacy ratio decreases.
Earnings Management and Capital Structure
Results show that there is a negative relationship between real earnings management activities and debt/equity ratio; that is, companies with lower leverage have a higher level of earnings management, which in turn will affect the quality of financial accounting earnings.
Research Conceptual Framework
Research Methodology
- We calculate the total accruals as follow
- We estimate the Modified Jones Model as follows
- We calculate the discretionary accruals as follows
- The non-discretionary accruals can be calculated as follows
First regression model, used to examine the relationship between operating efficiency and financial performance on capital structure. Second: regression model used to examine the relationship between operating efficiency and financial performance on earnings management. Operating efficiency ratio is calculated by dividing the sum of. operating costs + cost of goods sold) after net sales.
ROE ROE means how the company's management is able to generate returns on shareholders' investment through increased productivity and profits in a sustainable manner. The current CR ratio is a liquidity ratio that shows the company's ability to pay its short-term liabilities and debts on time. The AT asset turnover ratio is used to show how well companies are effectively using their assets to generate income.
Asset turnover ratio is measured by dividing net sales by average total assets during a given period. The IT inventory turnover ratio shows how many times, on average, a company has sold all of the inventory it has and then replaced it over and over again over a period of time. The inventory turnover rate is measured by dividing the value of goods sold by the average inventory.
Earnings Management EM occurs when the company adjusts and manipulates its earnings in a way that makes the accounting figures of the financial statements match the predetermined target. In this research, we use the modified Jones model - discretionary accruals as a proxy for earnings management. Tobin's Q = Market value of equity + Book value of current liabilities) ÷ Book value of total assets.
To calculate discretionary accruals, we first measure non-discretionary accruals as a fraction of total accruals using the Modified Jones model as follows. Δ 𝐷𝐶𝐿t = Change in short-term debt included in current liabilities in year 𝑡, 𝐷𝐸𝑃t = Depreciation and amortization expense in year 𝑡. 🝑
Δ 𝑅𝐸𝐶t = Net receivables in year 𝑡 minus net receivables in year 𝑡 − 1, 𝑃𝑃𝐸t = Gross tangible fixed assets in year 𝑡,. 𝑁𝐷𝐴𝐶𝐶t = Non-discretionary accruals divided by total assets in year 𝑡 − 1, Δ 𝑅𝐸𝑉t = Revenue in year 𝑡 minus revenue in year 𝑡 − 1,.
Statistical Results and Analysis
The residuals of the prediction model should follow the normal distribution of the long-run normal distribution with mean equal to zero and variance equal to one, the Chi-square test is used to test normality with the criterion that if the p-value is greater than 0.05 this means that the residuals are normally distributed. Show the graphical representation of your predicted values within the standard error of the model. After applying the pooled panel regression for the three models and performing panel model diagnostics, it is found that the most suitable linear panel model for estimating the capital structure (CS) in both model (1) and (3) is the clustered linear panel model and the random effect linear panel model is the best fit for estimating Earnings Management (EM) in model (2).
The two pooled linear panel model for estimating Capital Structure (CS) and the Random Effect linear panel model for estimating Earning Management (EM) showed high levels or long-term residual stability using the white test for heteroscedasticity and the Chi-square test for normality. of residues. Also the independent variables and controlling variables of the three models have shown a low VIF level, meaning that they do not suffer from multicollinearity, and finally, the Ramsey Reset test for irrelevant variables showed that all variables are relevant and that this is not necessary to add or remove variables from any of the three models. Table (2) shows the statistical results for the first regression model used to examine the relationship between operating efficiency and financial performance in terms of capital structure. The overall fixed effect model is significant with an adjusted R-squared value of 81.35%, meaning that the significant independent variable and the controlling variables explain the change in the by 81.35%.
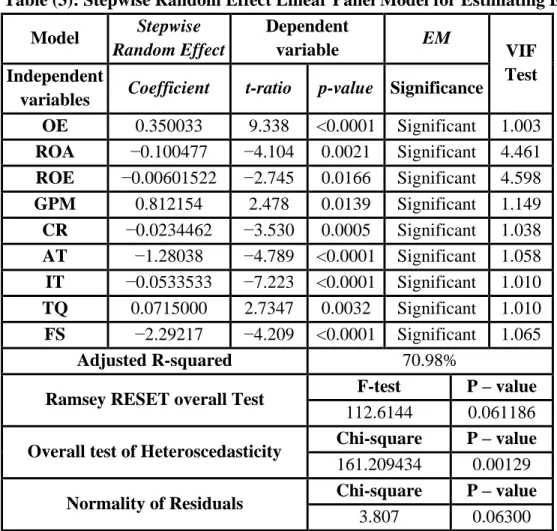
All independent variables and control variables have a significant effect on CS, except for the constant, which should be dropped from the equation, as its p-value is 0.7976, which is greater than 0.05. ROE, gross profit margin and firm size have a positive significant impact on the firm's capital structure, while operating efficiency, ROA, Tobin's Q ratio and all liquidity ratios used in the model (current ratio, asset turnover. The entire fixed effect model is significant) . with an adjusted R-squared value of 70.98%, which means that the significant independent variable and control variables explain 70.98% of the variation.
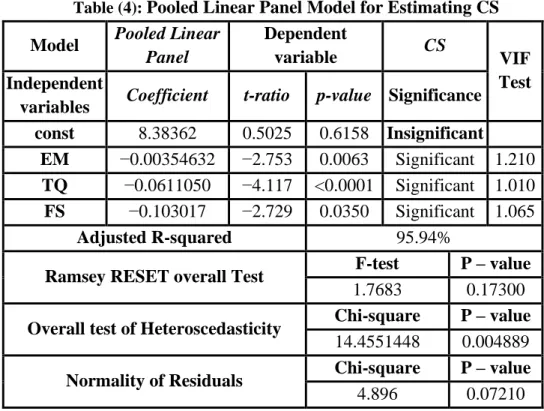
Operating efficiency, gross profit margin and Tobin's Q ratio have a positive, significant impact on the company's earnings management, while ROA, ROE and all liquidity ratios used in the model (current ratio, asset turnover and inventory turnover) have a significantly negative relationship with the gain. management. Table (4) shows the statistical results for the third regression model used to examine the relationship between capital structure and earnings management. The overall fixed effect model is significant with an adjusted R-squared value of 95.94%, meaning that the significant independent variable and the controlling variables explain the change in the by 95.94%.
All independent variables and control variables have significant influence on CS, except the constant should be removed from the equation as its p-value is 0.6158 which is greater than 0.05. All variables used in this model, earnings management, Tobin's Q ratio and firm size have a significant negative relationship with the firm's capital structure. The graphs below present the forecast of capital structure and earnings management in the three models for the entire time series period from 2013 to 2019 for the 65 companies of the sample sections.
Table (5): Summary of the results of the three linear panel regression models and their hypotheses. ROA Independent Significant Independent Significant ROE Independent Significant Independent Significant GPM Independent Significant Independent Significant CR Independent Significant Independent Significant AT Independent Significant Independent Significant IT Independent Significant Independent Significant.
Conclusion
34;Creative accounting nature, incidence and ethical issues". 34;Is improved audit quality associated with better real earnings management?". with better management of real profits?". 34;Effect of capital structure on the performance of listed manufacturing companies in Sub-Saharan Africa". A dissertation submitted in partial fulfillment of the requirements for the award of Doctorate of Philosophy in Finance in the Department of Accounting and Finance, Kwara State University, Malete, Nigeria.
34;The Effect of Leverage and Liquidity Ratios on Earnings Management and Capital of Banks Listed on the Tehran Stock Ratios on Earnings Management and Capital of Banks Listed on the Tehran Stock Exchange. 34;Exploring the relationship between operational efficiency and firms' financial performance : A relationship between operational efficiency and firms' financial performance: An empirical evidence from the Ghana Stock Exchange (GSE)". 34;The relationship between operational efficiency and financial performance of firms which is listed on the Nairobi Securities Exchange.
A research project presented in partial fulfillment of the requirements for the award of the degree of Master of Science Finance, School of Business, University of Nairobi. 34;Impact of Capital Structure on Financial Performance of Listed Trading Companies in Sri Lanka”.