FACTBOOK
2010-2011
Office of Institutional Research Page i
Table of Contents
Page Number
About The Office of Institutional Research 1
Student – Admissions Overall Admissions Profile
Relative Importance of Academic and Non-Academic Factors in Admissions Decisions 3 First-time, First-year (Freshman) Students by Gender (Fall 08-Fall 10) 4
Student Selectivity Trends (Fall 06-Fall 10) 5
Student Yield Trends ((Fall 06-Fall 10) 5
SAT Scores
First-Time, First-Year (Freshman) Degree-Seeking Students Enrolled in Fall 2010
Submitted SAT Scores 6
25
th, 75
thPercentile for SAT Scores (2009-2010) 6
Percent of First-Time, First-Year (Freshman) Students Enrolled in Fall 2010 with Scores in
Each Range 6
Average Test Scores for all First-Time, First-Year (Freshman) Students Enrolled in Fall 2010 6
All New Undergraduate Students AttributesAll New Undergraduate Students Fall 10 by Admit Type 7
All New Undergraduate Students Fall 10 by Gender and Certificate 7 All New Undergraduate Students Fall 10 by Gender and Nationality 9
Student Enrollment
Fall 2010 Overall Enrollment Profile
Enrollment by Full-Time/Part-Time, Gender and Career (2010) 11
Student Credit Hours (2010) 11
Overall Enrollment Trends
All Students in Fall Semesters by Career Level (2006 -2010) 12
Degree Seeking Students Attributes (1995-2010) 12
All Students in Fall Semesters by Citizenship (2006-2010) 13
Undergraduate Students in Fall Semesters by Double Major (2006-2010) 14 Graduate Students in Fall Semesters by Double Major (2006-2010) 15 Undergraduate Student Enrollment Trends
Undergraduate Students Enrollment by School (2006-2010) 16
Undergraduate Students Enrollment by Gender and Nationality Fall 10 17
Student Retention Rates (2004-2009) 20
School of Business Undergraduate Enrollment
(2006-2010) 20
School of Global Affairs and Public Policy Undergraduate Enrollment (2006-2010) 21
School of Humanities and Social Sciences Undergraduate Enrollment (2006-2010) 22
School of Sciences and Engineering Undergraduate Enrollment (2006-2010) 23
Office of Institutional Research Page ii
Graduate Student Enrollment Trends
Graduate Students Enrollment by School (2006-2010) 24
Graduate Students Enrollment by Gender and Nationality Fall 10 25
School of Business Graduate Enrollment (2006-2010) 28
School of Global Affairs and Public Policy Graduate Enrollment (2006-2010) 29 School of Humanities and Social Sciences Graduate Enrollment (2006-2010) 30 School of Science and Engineering Graduate Enrollment (2006-2010) 31
School of Continuing Education
School of Continuing Education Enrollment Trend 32
School of Continuing Education Enrollment Percent by Gender and Nationality 32
Students-Graduation
Annual Graduation Patterns
Annual Graduation Patterns (1991-2010) 33
Undergraduate Graduation Trends
Students Completion Rates (1997-2004) 34
Undergraduate Graduation patterns by Major (2008-2010) 35
Undergraduate Graduation Patterns by Citizenship 36
Undergraduate Graduation Patterns by Gender 37
Graduate Graduation Trends
Graduation Patterns by Major: Graduate Students (2008-2010) 38
Graduation Patterns by Citizenship: Graduate Students 39
Graduation Patterns by Gender: Graduate Students 40
Faculty
Full-Time Faculty
Full-Time Faculty by Citizenship (Fall 2010) 41
Full-Time Faculty by Terminal Degree (Fall 2010) 41
Full-Time Faculty by Rank (Fall 2010) 41
Full-Time Faculty by Gender (Fall 2010) 41
Full-Time Faculty Profile by School and Department (Fall 2010) 42 Part-Time Faculty
Part-Time Faculty Profile by School and Department (Fall 2010) 43 Teaching Faculty FTE
Full-Time and Part-Time Teaching Faculty by Headcount and FTE (Fall 2010) 44
Financial Aid/Scholarships
Undergraduate Students Achievement-Scholarships and Financial Aid (2006-2010) 45 Percentage of Change in Undergraduate Students Receiving Achievement Scholarships and
Financial Aid (2006-2010) 45
Graduate Students on Achievement Scholarships and Financial Aid (2006-2010) 46
Percentage of Change in Graduate Students Receiving Achievement Scholarships and Financial 46
Office of Institutional Research Page iii
Aid (2006-2010)
Students on Other Scholarship Programs (2010) 47
Alumni
Alumni Contributions(2006-2010) 48
Alumni Association Listings (2006-2010) 48
Sponsored Programs
Sponsored Programs Fiscal Year 2009-2010 49
Professional Training 52
Finances
AUC Operating Budget (2006-2010) 53
Research Centers 54
Office of Institutional Research Page 1
About Office of Institutional Research (OIR)
Mission
The mission of the Office of Institutional Research (IR) is to partner with university officials to support effective decision making that advances AUC’s Mission. IR provides timely, accurate and relevant information and analysis to external and internal constituencies.
About the Office of Institutional Research
The Office of Institutional Research comprises different functions that work together to advance AUC’s mission and promote effective decision making. Across these different specializations, we offer a variety of services and products to support AUC academic and administrative units, as well as outside constituencies, with planning, assessment, research, and testing needs. In addition, we strive to ensure that AUC is timely in reporting to US and Egyptian government and accreditation bodies.
In our role as the clearinghouse for university data, we are committed to a process of transparency, a culture of evidence and open communication in which information is made widely available to the campus community, as well as facilitating the flow of information between the central administration and campus units.
Planning
Supporting strategic planning and decision making through the analysis, presentation, and distribution of relevant and timely information.
Proactively generating institutional analyses that enhance the academic planning process.
Developing feasibility studies for decisions pertaining to institutional planning and programmatic proposals.
Assessment
Leading, coordinating, and advancing the university’s institutional, program, and unit-based assessment activities.
Providing expertise and general leadership and coordination for program and unit assessment.
Developing faculty and administrator capacities for effective outcomes assessment and related topics.
Research
Serving the university as a repository of information and maintaining databases of AUC’s institutional data.
Responding to internal and external requests for information about the institutional characteristics of AUC, including preparing reports and analyses for institutional decision making and planning.
Developing, conducting, and providing analyses for institutional surveys.
Office of Institutional Research Page 2
Testing
Providing assessment and evaluation support for AUC through the collection and processing of test data.
Providing both academic and non-academic units at AUC with scanning, scoring, and reporting for their testing needs.
Administering diagnostic tests for current and prospective students, as well as administering exams for other testing institutions, other universities abroad, and distance learners.
IR also provides a wide array of services to the AUC community, including consulting on assessment,
feasibility studies, survey services, conducting focus groups, providing training and workshops, test scanning services, and the administration of standardized exams such as the ELPET and the SAT.
The office also coordinates and supports programmatic accreditations and institution-wide accreditation by the Middle States Commission on Higher Education (MSCHE), who most recently reaffirmed AUC’s
accreditation subsequent to AUC's institutional self-study, led by the Office of Institutional Research.
Office of Institutional Research (OIR) Team Members:
Ahmed Abouelkheir
Senior Manager of Institutional Testing tel: 2615-1466
e-mail: [email protected]
Ann Boudinot-Amin
Director of Planning and Assessment tel: 2615-2232
e-mail: [email protected]
Azza Shafei
Institutional Research Specialist tel: 2615-2228
e-mail: [email protected]
Mahitab El Ramlawy Administrative Assistant tel: 2615-2236
e-mail: [email protected]
Ola Abdel Hamid Anwar Manager of Institutional Surveys tel: 2615-2230
e-mail: [email protected]
Sherif Dimitri
Institutional Testing Officer tel: 2615-1465
e-mail: [email protected]
Maryam Maafa
Institutional Research Manager tel: 2615-2234
e-mail: [email protected]
Zaid Ansari
Executive Director, Office of Institutional Research
tel: 2615-2233
e-mail: [email protected]
Rasha Sadek Radwan
Director of Institutional Research tel: 2625-2231
e-mail: [email protected]
Office of Institutional Research Page 3
Student – Admissions
OVERALL ADMISSIONS PROFILE
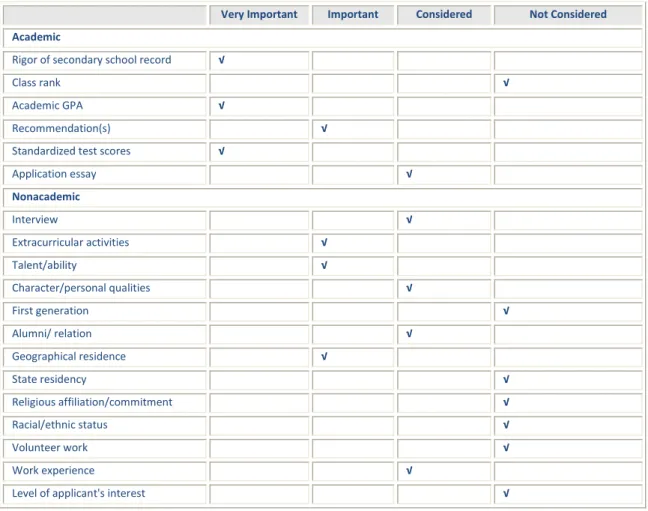
Table A.1: Relative Importance of Academic and Non-Academic Factors in Admissions Decisions
Very Important Important Considered Not Considered
Academic
Rigor of secondary school record √
Class rank √
Academic GPA √
Recommendation(s) √
Standardized test scores √
Application essay √
Nonacademic
Interview √
Extracurricular activities √
Talent/ability √
Character/personal qualities √
First generation √
Alumni/ relation √
Geographical residence √
State residency √
Religious affiliation/commitment √
Racial/ethnic status √
Volunteer work √
Work experience √
Level of applicant's interest √
Office of Institutional Research Page 4 Table A.2: First-time, First-year (freshman) Students by Gender
Fall 2008 Fall 2009 Fall 2010
Total first-time, first-year (freshman) males applied 1,278 1,430 787
Total first-time, first-year (freshman) females applied 1,198 1,256 770
Total first-time, first-year (freshman) applications 2,476 2,686 1,557
Total first-time, first-year (freshman) males admitted 633 743 343
Total first-time, first-year (freshman) females admitted 695 762 414
Total first-time, first-year (freshman) admitted 1,328 1,505 757
Total full-time, first-time, first-year (freshman) males enrolled 367 433 207 Total part-time, first-time, first-year (freshman) males enrolled 131 150 62 Total full-time, first-time, first-year (freshman) females enrolled 442 497 278 Total part-time, first-time, first-year (freshman) females enrolled 119 142 58 Total first-time, first-year enrolled, full-time and part- time 1,059 1,222 605
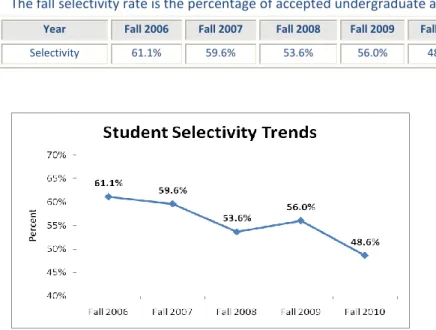
Office of Institutional Research Page 5 Table A.3: Student Selectivity Trends (Fall 2006 – fall 2010)
The fall selectivity rate is the percentage of accepted undergraduate applicants
Year Fall 2006 Fall 2007 Fall 2008 Fall 2009 Fall 2010Selectivity 61.1% 59.6% 53.6% 56.0% 48.6%
Table A.4: Student Yield Trends (Fall 2006 – Fall 2010)
The fall yield rate is the percentage of accepted and registered undergraduates
Year Fall 2006 Fall 2007 Fall 2008 Fall 2009 Fall 2010Percent 73.3% 75.5% 79.7% 81.1% 79.9%
Office of Institutional Research Page 6
SAT SCORES
Table A.5: Number and Percent of First-Time, First-Year (Freshman) Degree-Seeking Students Enrolled in fall 2010 who Submitted SAT Scores
Number Percent
271 45%
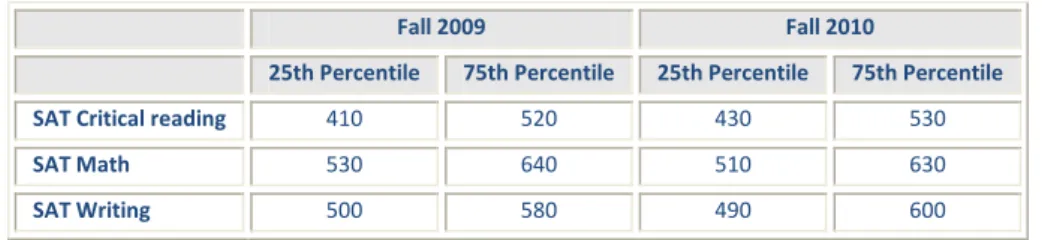
Table A.6: 25th, 75th Percentile Classification for SAT Scores (2009-2010)
Fall 2009 Fall 2010
25th Percentile 75th Percentile 25th Percentile 75th Percentile
SAT Critical reading 410 520 430 530
SAT Math 530 640 510 630
SAT Writing 500 580 490 600
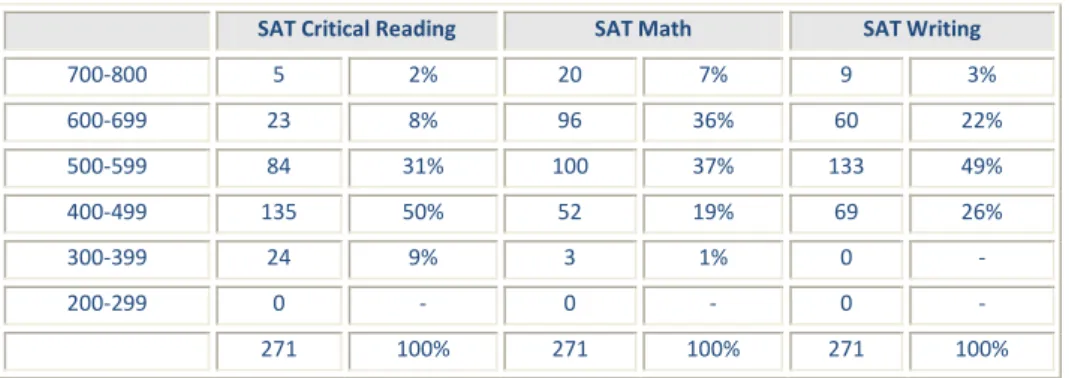
Table A.7: Percent of First-Time, First-Year (freshman) Students Enrolled in fall 2010 with Scores in Each Range
SAT Critical Reading SAT Math SAT Writing
700-800 5 2% 20 7% 9 3%
600-699 23 8% 96 36% 60 22%
500-599 84 31% 100 37% 133 49%
400-499 135 50% 52 19% 69 26%
300-399 24 9% 3 1% 0 -
200-299 0 - 0 - 0 -
271 100% 271 100% 271 100%
*Unable to calculate percentage since N =1
Table A.8 Average Test Scores for All First-Time, First-Year (Freshman) Students Enrolled in Fall 2010 Average Test Scores SAT Critical Reading SAT Math SAT Writing
2010 enrolled freshmen 490 575 550
Office of Institutional Research Page 7
ALL NEW UNDERGRADUATE STUDENTS
Table A.9: All New Undergraduate Students Fall 2010 by Admit Type
Regular Transfer Readmits Total
605 (94.5%) 23 (3.6%) 12 (1.9%) 640
Table A.10: All New Undergraduate Students Fall 2010 by Gender and Certificate
School Department Gender Thanaweya Amma Other Certificates Total
School of Humanities and Social Sciences (HUSS)
Anthropology Male 0 0 0
Female 0 1 1
Total 0 1 1
Political Science
Male 0 2 2
Female 0 0 0
Total 0 2 2
Total Male 0 2 2
Female 0 1 1
Total 0 3 3
School of Business (SB) Accounting Male 0 2 2
Female 0 0 0
Total 0 2 2
Business Administration
Male 0 0 0
Female 0 1 1
Total 0 1 1
Total Male 0 2 2
Female 0 1 1
Total 0 3 3
School of Global Affairs and Public Policy (GAPP)
Journalism Male 0 0 0
Female 0 1 1
Total 0 1 1
School of Sciences and Engineering (SSE)
Actuarial Sciences
Male 0 0 0
Female 0 1 1
Total 0 1 1
Architectural Engineering
Male 0 2 2
Female 0 7 7
Total 0 9 9
Biology Male 0 6 6
Female 0 10 10
Total 0 16 16
Chemistry Male 0 0 0
Female 0 1 1
Total 0 1 1
Computer Engineering
Male 0 8 8
Female 0 2 2
Total 0 10 10
Computer Science
Male 0 2 2
Female 0 1 1
Total 0 3 3
Construction Engineering
Male 1 4 5
Female 1 9 10
Total 2 13 15
Office of Institutional Research Page 8 Electronics
Engineering
Male 1 5 6
Female 0 2 2
Total 1 7 8
Mathematics Male 1 0 1
Female 0 0 0
Total 1 0 1
Mechanical Engineering
Male 3 18 21
Female 0 3 3
Total 3 21 25
Petroleum Engineering
Male 1 3 4
Female 0 0 0
Total 1 3 4
Physics Male 0 1 1
Female 1 1 2
Total 1 2 3
Total Male 7 49 56
Female 2 37 39
Total 9 86 95
Undeclared Male 35 196 231
Female 28 279 307
Total 63 475 538
Grand Total Male 42 (14.4%) 249 (85.6%) 291
Female 30 (8.6%) 319 (91.4%) 349
Total 72 (11.25%) 568 (88.75%) 640
Office of Institutional Research Page 9 Table A.11: All New Undergraduate Students Fall 2010 by Gender and Nationality
School Department Gender Egyptian Non-Egyptian Total
School of Humanities and Social Sciences (HUSS)
Anthropology Male 0 0 0
Female 0 1 1
Total 0 1 1
Political Science Male 1 1 2
Female 0 0 0
Total 1 1 2
Total Male 1 1 2
Female 0 1 1
Total 1 2 3
School of Business (SB) Accounting Male 2 0 2
Female 0 0 0
Total 2 0 2
Business Administration
Male 0 0 0
Female 1 0 1
Total 1 0 1
Total Male 2 0 2
Female 1 0 1
Total 3 0 3
School of Global Affairs and Public Policy (GAPP)
Journalism Male 0 0 0
Female 1 0 1
Total 1 0 1
School of Sciences and Engineering (SSE)
Actuarial Sciences
Male 0 0 0
Female 1 0 1
Total 1 0 1
Architectural Engineering
Male 2 0 2
Female 6 1 7
Total 8 1 9
Biology Male 4 2 6
Female 10 0 10
Total 14 2 16
Chemistry Male 0 0 0
Female 1 0 1
Total 1 0 1
Computer Engineering
Male 8 0 8
Female 2 0 2
Total 10 0 10
Computer Science
Male 2 0 2
Female 1 0 1
Total 3 0 3
Construction Engineering
Male 5 0 5
Female 9 1 10
Total 14 1 15
Electronics Engineering
Male 5 1 6
Female 2 0 2
Total 7 1 8
Mathematics Male 1 0 1
Female 0 0 0
Total 1 0 1
Mechanical Engineering
Male 19 2 21
Female 3 0 3
Office of Institutional Research Page 10
Total 22 2 24
Petroleum Engineering
Male 3 1 4
Female 0 0 0
Total 3 1 4
Physics Male 1 0 1
Female 2 0 2
Total 3 0 3
Total Male 50 6 56
Female 37 2 39
Total 87 8 95
Undeclared Male 204 27 231
Female 282 25 307
Total 486 52 538
Grand Total Male 257 (88.31%) 34 (11.69%) 291
Female 321 (91.98%) 28 (8.02%) 349
Total 578 (90.31%) 62 (9.69%) 640
Office of Institutional Research Page 11
Student Enrollment
FALL 2010 OVERALL ENROLLMENT PROFILE
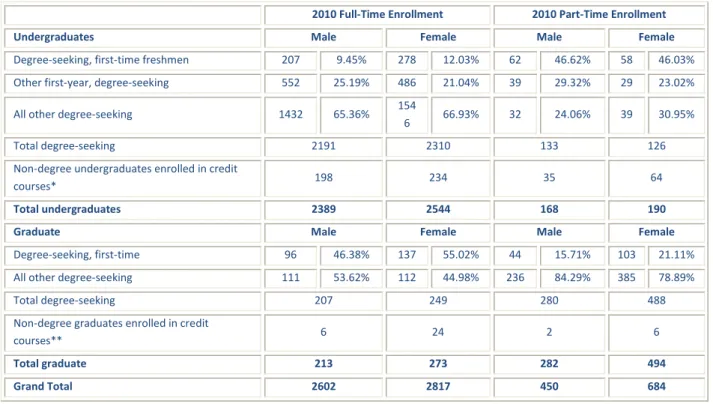
Table E.1: Enrollment by Full-Time/Part Time, Gender and Career
2010 Full-Time Enrollment 2010 Part-Time Enrollment
Undergraduates Male Female Male Female
Degree-seeking, first-time freshmen 207 9.45% 278 12.03% 62 46.62% 58 46.03%
Other first-year, degree-seeking 552 25.19% 486 21.04% 39 29.32% 29 23.02%
All other degree-seeking 1432 65.36% 154
6 66.93% 32 24.06% 39 30.95%
Total degree-seeking 2191 2310 133 126
Non-degree undergraduates enrolled in credit
courses* 198 234 35 64
Total undergraduates 2389 2544 168 190
Graduate Male Female Male Female
Degree-seeking, first-time 96 46.38% 137 55.02% 44 15.71% 103 21.11%
All other degree-seeking 111 53.62% 112 44.98% 236 84.29% 385 78.89%
Total degree-seeking 207 249 280 488
Non-degree graduates enrolled in credit
courses** 6 24 2 6
Total graduate 213 273 282 494
Grand Total 2602 2817 450 684
* Includes non-degree students and those studying in the Arabic Language Institute
** Includes graduate diplomas students and those studying in the Center for Arabic Study Abroad (CASA)
Table E.2: Student Credit Hours
Fall 2010
Undergraduate Graduate
Total credit hours of all part-time students 1,806 2,930
Number of credit hours for of a full-time student 12 9
Office of Institutional Research Page 12
OVERALL ENROLLMENT TRENDS
Table E.3 All Students in Fall Semesters by Career Level (2006 – 2010)
Fall 2006 Fall 2007 Fall 2008 Fall 2009 Fall 2010
Undergraduate Programs Enrollment 4,023 71.8% 4,229 71.4% 4,530 74.7% 5,055 76.2% 4,760 72.7%
Graduate Programs Enrollment 1,049 18.7% 1,093 18.5% 1,047 17.3% 1,148 17.3% 1,224 18.7%
Non-Degree Seeking Enrollment 529 9.5% 600 10.1% 487 8.0% 428 6.5% 569 8.7%
All Academic Student Enrollment 5,601 5,922 6,064 6,631 6,553
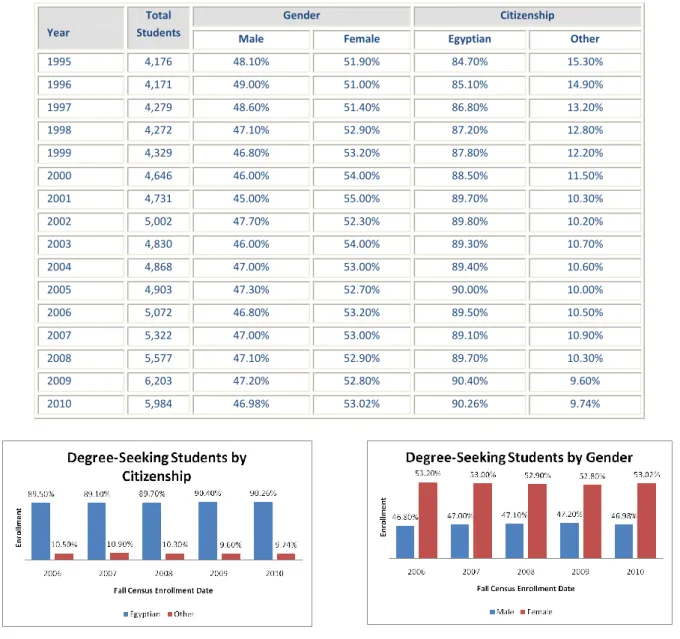
Table E.4 Degree-Seeking Students Attributes (1995 – 2010) Year
Total Students
Gender Citizenship
Male Female Egyptian Other
1995 4,176 48.10% 51.90% 84.70% 15.30%
1996 4,171 49.00% 51.00% 85.10% 14.90%
1997 4,279 48.60% 51.40% 86.80% 13.20%
1998 4,272 47.10% 52.90% 87.20% 12.80%
1999 4,329 46.80% 53.20% 87.80% 12.20%
2000 4,646 46.00% 54.00% 88.50% 11.50%
2001 4,731 45.00% 55.00% 89.70% 10.30%
2002 5,002 47.70% 52.30% 89.80% 10.20%
2003 4,830 46.00% 54.00% 89.30% 10.70%
2004 4,868 47.00% 53.00% 89.40% 10.60%
2005 4,903 47.30% 52.70% 90.00% 10.00%
2006 5,072 46.80% 53.20% 89.50% 10.50%
2007 5,322 47.00% 53.00% 89.10% 10.90%
2008 5,577 47.10% 52.90% 89.70% 10.30%
2009 6,203 47.20% 52.80% 90.40% 9.60%
2010 5,984 46.98% 53.02% 90.26% 9.74%
Office of Institutional Research Page 13 Table E.5 All Students in Fall Semesters by Citizenship (2006 – 2010)
Year Egyptian US Arab Countries All Other Countries Total
2006 4,589 81.9% 527 9.4% 249 4.4% 236 4.2% 5,601
2007 4,794 81.0% 649 11.0% 231 3.9% 248 4.2% 5,922
2008 5,039 83.1% 591 9.7% 228 3.8% 206 3.4% 6,064
2009 5,637 85.0% 569 8.6% 232 3.5% 193 2.9% 6,631
2010 5,534 84.4% 591 9.0% 199 3.0% 229 3.5% 6,553
Office of Institutional Research Page 14 Table E.6 Undergraduate Students in Fall Semesters by Double Major (2006 – 2010)
School Major Fall 2006 Fall 2007 Fall 2008 Fall 2009 Fall 2010
School of Business
Accounting 114 123 132 131 128
Business Administration 422 477 466 415 391
Economics 163 147 189 210 208
School of Humanities and Social Sciences
Anthropology 14 13 13 14 15
Arabic and Islamic Civilization 0 0 0 1 3
Arabic Studies 1 5 5 3 2
Art 61 64 62 56 49
Egyptology 10 12 10 10 10
English & Comparative Literature 21 25 25 31 23
History 0 1 17 45 59
Honors Program in Political Science 0 0 0 0 5
Modern History 28 35 15 6 3
Philosophy 18 15 14 21 21
Political Science 258 272 312 379 306
Psychology 68 65 54 72 93
Sociology 21 19 12 14 18
Theatre 20 20 22 27 25
School of Sciences and Engineering
Actuarial Science 26 22 35 45 53
Architectural Engineering 0 43 82 148 217
Biology 61 49 63 69 70
Chemistry 28 27 26 33 25
Computer Engineering 0 26 63 82 81
Computer Science 235 186 137 116 94
Construction Engineering 226 237 259 303 286
Electronic Engineering 209 205 209 202 164
Engineering (specialty undeclared) 2 19 18 0 0
Mathematics 12 13 16 19 27
Mechanical Engineering 319 287 313 342 341
Petroleum & Energy Engineering 0 3 37 126 150
Physics 19 20 27 38 36
School of Global Affairs and Public Policy
Communication and Media Arts 0 0 10 211 226
Integrated Marketing
Communication 0 0 22 180 205
Journalism 0 0 11 56 82
Journalism & Mass Communication 475 479 445 106 20
Middle East Studies 5 13 16 13 12
Undeclared 1,266 1,394 1,495 1,630 1,456
Office of Institutional Research Page 15 Table E.7 Graduate Students in Fall Semesters by Double Major (2006 – 2010)
School Major Fall 2006 Fall 2007 Fall 2008 Fall 2009 Fall 2010
School of Business
Business Administration 212 202 157 146 152
Economics 51 41 30 26 35
Economics – International Development 50 51 43 41 45
School of Humanities and Social Sciences
Arabic Studies 37 48 44 47 54
Community Psychology 0 0 0 3 9
English & Comparative Literature 15 15 21 22 23
Family and Couples Counseling 0 0 0 1 1
Family and Child Counseling 0 0 0 26 23
Political Science 103 129 117 107 87
Sociology and Anthropology 38 37 28 36 29
Teaching Arabic as a Foreign Language 47 47 49 42 43
Teaching English as a Foreign Language 60 47 43 43 44
School of Sciences and Engineering
Master’s Degrees
Biotechnology 0 19 41 55 59
Chemistry 0 0 0 10 18
Computer Science 82 80 85 61 48
Computing 0 0 2 11 5
Construction Engineering 0 29 38 42 45
Electronics Engineering NA NA NA NA 13
Engineering 74 23 9 7 0
Environmental Engineering 0 8 5 8 13
Environmental Systems Design NA NA NA NA 2
Mechanical Engineering 0 23 24 29 31
Nanotechnology NA NA NA NA 9
Physics 20 18 16 15 12
Product Development and System
Management 0 0 3 4 7
PhD Degrees
PhD in Applied Sciences 0 0 0 0 8
PhD in Engineering 0 0 0 0 6
School of Global Affairs and Public Policy
Gender and Women's Studies 3 13 25 26 25
International Human Rights Law 37 47 46 62 66
Law 57 52 39 34 37
Journalism and Mass Communication 83 78 64 70 67
Middle East Studies 62 73 66 64 60
Migration and Refugee Studies 0 0 13 29 31
Public Administration 32 11 4 1 5
Public Policy 0 0 0 0 1
Public Policy and Administration 6 17 46 96 103
Television and Digital Journalism 0 0 13 18 19
Graduate School of Education
International and Comparative
Education 0 0 0 0 27
Office of Institutional Research Page 16
UNDERGRADUATE STUDENT ENROLLMENT TRENDS
Table E.8 Undergraduate Students Enrollment by School (2006 – 2010)
Fall 2006 Fall 2007 Fall 2008 Fall 2009** Fall 2010
School of Business 1,147 28.5% 1,198 28.3% 1,240 27.4% 728 14.4% 691 14.52%
School of Global Affairs and Public Policy - 0.0% - 0.0% - 0.0% 555 11.0% 525 11.03%
School of Humanities and Social Science 499 12.4% 525 12.4% 537 11.9% 650 12.9% 578 12.14%
School of Sciences and Engineering 1,111 27.6% 1,112 26.3% 1,258 27.8% 1,492 29.5% 1,510 31.72%
Undeclared (includes English Language
Institute) 1,266 31.5% 1,394 33.0% 1,495 33.0% 1,630 32.2% 1,456 30.59%
Undergraduate Degree Totals 4,023 4,229 4,530 5,055 4,760
*Until Fall 08, it was School of Business, Economics and Communications,
**In Fall 09, School of Global Affairs and Public Policy was inaugurated. Some of the majors previously under School of Business, Economics and Communications, and School of Humanities ans Social Scineces became part of the new school.
Office of Institutional Research Page 17 Table E.9: Undergraduate Students Enrollment by Gender and Nationality Fall 2010
School Department Gender Egyptian Non-Egyptian Total
School of Business (SOB)
Accounting Male 65 6 71
Female 54 2 56
Total 119 8 127
Business Administration Male 83 3 86
Female 275 10 285
Total 358 13 371
Economics Male 82 8 90
Female 100 3 103
Total 182 11 193
Total Male 230 17 247
Female 429 15 444
Total 659 32 691
School of Global Affairs and Public Policy
Communication and Media Arts Male 59 1 60
Female 147 12 159
Total 206 13 219
Integrated Marketing Communication
Male 27 1 28
Female 160 8 168
Total 187 9 196
Journalism Male 16 0 16
Female 55 8 63
Total 71 8 79
Journalism & Mass Communications
Male 2 1 3
Female 15 2 17
Total 17 3 20
Middle East Studies Male 0 3 3
Female 4 4 8
Total 4 7 11
Total Male 104 6 110
Female 381 34 415
Total 485 40 525
School of Humanities and Social Sciences (HUSS)
Anthropology Male 1 0 1
Female 7 3 10
Total 8 3 11
Arabic Studies Male 0 0 0
Female 0 2 2
Total 0 2 2
Arabic and Islamic Civilization Male 0 1 1
Female 0 1 1
Total 0 2 2
Art Male 3 0 3
Female 35 5 40
Total 38 5 43
Egyptology Male 1 3 4
Female 3 2 5
Office of Institutional Research Page 18
Total 4 5 9
English & Comparative Literature
Male 2 0 2
Female 16 4 20
Total 18 4 22
History Male 30 1 31
Female 22 1 23
Total 52 2 54
Modern History Male 0 1 1
Female 1 0 1
Total 1 1 2
Philosophy Male 5 2 7
Female 7 2 9
Total 12 4 16
Political Science Male 121 12 133
Female 154 12 166
Total 275 24 299
Honorary Program in Political Science
Male
Female 4 1 5
Total 4 1 5
Psychology Male 3 2 5
Female 68 3 71
Total 71 5 76
Sociology Male 2 1 3
Female 12 1 13
Total 14 2 16
Theatre Male 8 2 10
Female 9 2 11
Total 17 4 21
Total Male 176 25 201
Female 338 39 377
Total 514 64 578
School of Sciences and Engineering (SSE)
Actuarial Science Male 16 0 16
Female 32 3 35
Total 48 3 51
Architectural Engineering Male 58 1 59
Female 146 5 151
Total 204 6 210
Biology Male 19 6 25
Female 37 8 45
Total 56 14 70
Chemistry Male 8 2 10
Female 14 0 14
Total 22 2 24
Computer Engineering Male 45 3 48
Female 30 2 32
Total 75 5 80
Office of Institutional Research Page 19
Computer Science Male 63 5 68
Female 25 1 26
Total 88 6 94
Construction Engineering Male 211 11 222
Female 60 2 62
Total 271 13 284
Electronics Engineering Male 109 6 115
Female 47 0 47
Total 156 6 162
Mathematics Male 11 1 12
Female 3 1 4
Total 14 2 16
Mechanical Engineering Male 286 13 299
Female 37 0 37
Total 323 13 336
Petroleum and Energy Engineering
Male 128 2 130
Female 19 0 19
Total 147 2 149
Physics Male 24 2 26
Female 8 0 8
Total 32 2 34
Total Male 978 52 1,030
Female 458 22 480
Total 1,436 74 1,510
Undeclared Male 675 61 736
Female 667 53 720
Total 1,342 114 1,456
Grand Total Male 2,163 (45.4%) 161 (3.4%) 2,324 (48.8%)
Female 2,273 (47.8%) 163 (3.4%) 2,436 (51.2%)
Total 4,436 (93.2%) 324 (6.8%) 4,760
Office of Institutional Research Page 20 Table E.10 Student Retention Rates Trends (2004-2009)
The retention rate is the percentage of first-time, degree-seeking freshman who enrolled in the Fall and returned the following Fall.
Fall 2004 Fall 2005 Fall 2006 Fall 2007 Fall 2008 Fall 2009
92% 93% 93% 93% 94% 94%
Table E.11 School of Business Undergraduate Enrollment (2006-2010)
Major Fall 2006 Fall 2007 Fall 2008 Fall 2009 Fall 2010
Accounting 113 118 129 130 127
Business Administration 413 466 453 400 371
Economics 157 143 180 198 193
Total 683 (17.0%) 727 (17.2%) 762 (16.8%) 728 (14.4%) 691 (14.5%)
Office of Institutional Research Page 21 E.12 School of Global Affairs and Public Policy Undergraduate Enrollment (2006–2010)
Major Fall 2006 Fall 2007 Fall 2008 Fall 2009 Fall 2010
Communications and Media Arts NA NA 10 207 219
Integrated Marketing and Communications NA NA 22 175 196
Journalism NA NA 11 56 79
Journalism and Mass Communications 464 471 435 104 20
Middle East Studies 5 13 14 13 11
Total 469 (11.6%) 484 (11.4%) 492 (10.9%) 555 (11.0%) 525 (11.0%)
Office of Institutional Research Page 22 E.13 School of Humanities and Social Sciences Undergraduate Enrollment (2006–2010)
Major Fall 2006 Fall 2007 Fall 2008 Fall 2009 Fall 2010
Anthropology 13 13 12 13 11
Arabic Studies 1 4 5 3 2
Arabic and Islamic Civilization NA NA NA 1 2
Art 59 60 56 49 43
Egyptology 10 12 10 10 9
English & Comparative Literature 21 25 25 31 22
History NA NA 16 45 54
Modern History 28 30 11 5 2
Philosophy 13 13 10 19 16
Political Science 245 261 300 367 299
Honorary Program in Political Science NA NA NA NA 5
Psychology 65 58 49 70 7
Sociology 20 18 10 14 16
Theatre 19 18 19 23 21
Total 494 (12.3%) 512 (12.1%) 523 (11.5%) 650 (12.8%) 578 (12.1%)
Office of Institutional Research Page 23 E.14 School of Sciences and Engineering Undergraduate Enrollment (2006-2010)
Major Fall 2006 Fall 2007 Fall 2008 Fall 2009 Fall 2010
Actuarial Science 25 21 34 45 51
Architectural Engineering NA 37 74 141 210
Biology 61 48 63 68 70
Chemistry 23 25 24 302 24
Computer Engineering NA 25 61 32 80
Computer Science 225 179 136 81 94
Construction Engineering 226 236 259 113 284
Electronics Engineering 204 203 207 201 162
Engineering (Specialty undeclared) 2 19 18 NA NA
Mathematics 10 11 10 9 16
Mechanical Engineering 317 286 313 341 336
Petroleum and Energy Engineering NA 3 37 125 149
Physics 18 19 22 34 34
Total 1,111
(27.6%)
1,112 (26.3%)
1,258 (27.8%)
1,492 (29.5%)
1,510 (31.7%)
Office of Institutional Research Page 24
GRADUATE STUDENT ENROLLMENT TRENDS
Table E.14 Graduate Students Enrollment by School (2006 – 2010) Graduate Degree
Programs Fall 2006 Fall 2007 Fall 2008 Fall 2009** Fall 2010
Graduate School of
Education NA NA NA NA NA NA NA NA 27 2.2%
School of Business* 428 40.8% 395 36.1% 349 33.3% 212 18.5% 227 18.5%
School of Global Affairs
and Public Policy NA NA NA NA NA NA 377 32.8% 392 32.0%
School of Humanities and
Social Sciences 447 42.6% 501 45.8% 476 45.5% 318 27.7% 303 24.8%
School of Sciences and
Engineering 174 16.6% 197 18.0% 222 21.2% 241 21.0% 275 22.5%
Totals 1,049 1,093 1,047 1,148 1,224
*Until Fall 08, it was School of Business, Economics and Communications,
**In Fall 09, School of Global Affairs and Public Policy was inaugurated. Some of the majors previously under School of Business, Economics and Communications, and School of Humanities and Social Scineces became part of the new school.
Office of Institutional Research Page 25 Table E.15 Graduate Students Enrollment by Gender and Nationality Fall 10
School Program Gender Egyptian Non-Egyptian Total
Graduate School of Education
International and Comparative Education
Male 4 2 6
Female 20 1 21
Total 24 3 27
Total Male 4 2 6
Female 20 1 21
Total 24 3 27
School of Business Business Administration
Male 103 1 104
Female 46 2 48
Total 149 3 152
Economics Male 8 2 10
Female 25 0 25
Total 33 2 35
Economics in International Development
Male 10 4 14
Female 23 3 26
Total 33 7 40
Total Male 121 7 128
Female 94 5 99
Total 215 12 227
School of Global Affairs and Public Policy
Gender and Women’s Studies
Male 0 0 0
Female 12 9 21
Total 12 9 21
International Human Rights Law
Male 0 17 17
Female 18 27 45
Total 18 44 62
Law Male 20 2 22
Female 11 4 15
Total 31 6 37
Middle East Studies
Male 5 22 27
Female 8 20 28
Total 13 42 55
Migration and Refugee Studies
Male 1 2 3
Female 2 21 23
Total 3 23 26
Journalism & Mass Communication
Male 6 3 9
Female 53 4 57
Total 59 7 66
Public Administration
Male 0 1 1
Female 4 0 4
Total 4 1 5
Public Policy Male 1 0 1
Female 0 0 0
Total 1 0 1
Public Policy and Administration
Male 25 7 32
Female 60 9 69
Total 85 16 101
Office of Institutional Research Page 26 Television &
Digital Journalism
Male 2 0 2
Female 13 3 16
Total 15 3 18
Total Male 60 54 114
Female 181 97 278
Total 241 151 392
School of Humanities and Social Sciences
Arabic Studies Male 9 16 25
Female 21 7 28
Total 30 23 53
Community Psychology
Male 1 1 2
Female 5 2 7
Total 6 3 9
English &
Comparative Literature
Male 2 1 3
Female 18 2 20
Total 20 3 23
Family and Couples Counseling
Male 0 0 0
Female 1 0 1
Total 1 0 1
Family and Child Counseling
Male 0 0 0
Female 21 2 23
Total 21 2 23
Political Science Male 21 13 34
Female 39 11 50
Total 60 24 84
Sociology and Anthropology
Male 1 4 5
Female 12 10 22
Total 13 14 27
Teaching Arabic as a Foreign Language
Male 16 2 18
Female 23 1 24
Total 39 3 42
Teaching English as a Foreign Language
Male 5 4 9
Female 24 8 32
Total 29 12 41
Total Male 55 41 96
Female 164 43 207
Total 219 84 303
School of Sciences and Engineering
Master’s Degree
Biotechnology Male 17 1 18
Female 40 0 40
Total 57 1 58
Chemistry Male 7 0 7
Female 11 0 11
Total 18 0 18
Computer Science Male 24 1 25
Female 22 1 23
Total 46 2 48
Computing Male 5 0 5
Female 0 0 0
Total 5 0 5
Office of Institutional Research Page 27 Construction
Engineering
Male 30 0 30
Female 14 1 15
Total 44 1 45
Electronics Engineering
Male 5 1 6
Female 7 0 7
Total 12 1 13
Environmental Engineering
Male 8 0 8
Female 4 1 5
Total 12 1 13
Environmental Systems Design
Male 1 0 1
Female 1 0 1
Total 2 0 2
Mechanical Engineering
Male 17 2 19
Female 12 0 12
Total 29 2 31
Nanotechnology Male 4 0 4
Female 5 0 5
Total 9 0 9
Physics Male 7 1 8
Female 4 0 4
Total 11 1 12
Product Development &
Systems Management
Male 6 0 6
Female 1 0 1
Total 7 0 7
Total Male 131 6 137
Female 121 3 124
Total 252 9 261
PhD Degrees PhD in Applied Science
Male 3 0 3
Female 5 0 5
Total 8 0 8
PhD in Engineering Male 3 0 3
Female 3 0 3
Total 6 0 6
Total Male 6 0 6
Female 8 0 8
Total 14 0 14
Grand Total Male 377 (77.4%) 110 (22.6%) 487
Female 588 (79.8%) 149 (20.2%) 737
Total 965 (78.8%) 259 (21.2%) 1,224
Office of Institutional Research Page 28 Table E.16 School of Business Graduate Enrollment Trends (2006–2010)
Major Fall 2006 Fall 2007 Fall 2008 Fall 2009 Fall 2010
Business Administration 211 200 152 145 152
Economics 51 41 30 26 35
Economics/International Development 45 48 42 41 40
Total 307 (29.3%) 289 (26.5%) 224 (21.4%) 212 (18.5%) 227 (18.5%)
Office of Institutional Research Page 29 Table E.17 School of Global Affairs and Public Policy Graduate Enrollment Trends (2006–2010)
Major Fall 2006 Fall 2007 Fall 2008 Fall 2009 Fall 2010
Gender and Women’s Studies 3 13 24 24 21
International Human Rights Law 35 47 45 59 62
Law (LL.M.) 57 52 39 33 37
Middle East Studies 60 72 62 59 55
Migration and Refugee Studies NA NA 11 22 26
Journalism & Mass Communication 83 78 62 67 66
Public Administration 32 11 4 1 5
Public Policy NA NA NA NA 1
Public Policy and Administration 6 17 46 95 101
Television and Digital Journalism NA NA 13 17 18
Total 276 (26.3%) 290 (26.5%) 306 (29.2%) 377 (32.8%) 392 (32.0%)
Office of Institutional Research Page 30 Table E.18 School of Humanities and Social Sciences Graduate Enrollment (2006–2010)
Major Fall 2006 Fall 2007 Fall 2008 Fall 2009 Fall 2010
Arabic Studies 34 47 42 45 53
Community Psychology NA NA NA 3 9
English & Comparative Literature 14 15 21 22 23
Family and Couples Counseling NA NA NA 1 1
Family and Child Counseling NA NA NA 26 23
Political Science 101 125 114 104 84
Sociology and Anthropology 38 36 27 33 27
Teaching Arabic as a Foreign Language 46 47 48 42 42
Teaching English as a Foreign Language 59 47 43 42 41
Total 292 (27.8%) 317 (29.0%) 295 (28.2%) 318 (27.7%) 303 (24.8%)
Office of Institutional Research Page 31 Table E.19 School of Sciences and Engineering Graduate Enrollment (2006–2010)
Degree Program Fall 2006 Fall 2007 Fall 2008 Fall 2009 Fall 2010
Master’s Degrees
Biotechnology NA 19 41 54 59
Chemistry NA NA NA 10 18
Computer Science 81 79 85 61 48
Computing NA NA 2 11 5
Construction Engineering NA 29 38 42 45
Electronics Engineering NA NA NA NA 13
Engineering (Specialty undeclared) 73 21 9 7 NA
Environmental Engineering NA 8 5 8 13
Environmental Systems Design NA NA NA NA 2
Mechanical Engineering NA 23 24 29 31
Nanotechnology NA NA NA NA 9
Physics 20 18 16 15 12
Product Development and Systems Management NA NA 3 4 7
PhD Degrees
PhD in Applied Sciences NA NA NA NA 8
PhD in Engineering NA NA NA NA 6
Total 174 (16.6%) 197 (18.0%) 222 (21.2%) 241 (21.0%) 275 (22.53%)
Office of Institutional Research Page 32
School of Continuing Education
The School of Continuing Education (SCE) provides certificate programs, noncredit semester-long, courses and customized courses of variable length to fulfill the continuing educational needs of individuals and
organizations in Egypt and the Middle East. SCE’s regularly scheduled courses and certificate programs are offered at AUC Downtown, Heliopolis, Zamalek and El Gouna. Courses and certificate programs have been developed to be offered at AUC New Cairo, and customized courses may be conducted on site at the
organization’s facilities. Ten laboratories allow for state-of-the-art computer and English-language training at AUC Downtown. Special summer youth programs provide academic enrichment and skill development for children.
Table C.1 School of Continuing Education Enrollment Trend (Fiscal years 2006-2007 to 2009-2010)
2005-2006 2006-2007 2007-2008 2008-2009 2009-2010
Arabic and Translation 1,867 2,219 2,419 2,498 2,343
Business Studies 3,593 3,215 3,832 3,319 3,167
Computer and IT Studies 4,419 4,224 2,298 1,391 894
Graduate School of Education (continuing
education) NA NA 140 227 186
English Studies 26,897 31,705 31,106 27,812 22,772
International Human Rights Law Outreach
Program NA 190 287 293 NA
Youth and Special Studies 5,497 3,330 2,097 2,176 2,654
SCE Total 42,243 44,883 42,179 37,716 32,016
Table C.2 School of Continuing Education Enrollment Percent by Gender and Nationality (Fiscal years 2006-2007 to 2009-2010)
Fiscal Year Gender Nationality Total
Male Female Egyptian Other
2005-2006 62.3% 37.7% 95.4% 4.6% 42,243
2006-2007 62.2% 37.8% 95.5% 4.5% 44,883
2007-2008 60.9% 39.1% 95.5% 4.5% 42,179
2008-2009 59.9% 40.1% 96.2% 3.8% 37,716
2009-2010 58.5% 41.5% 96.1% 3.9% 32,016
Office of Institutional Research Page 33
Students – Graduation
ANNUAL GRADUATION PATTERNS
Table G.1 Annual Graduation Patterns (1991-2010)
Count Percent
Year Undergraduate Students
Graduate Students
Annual Totals
Undergraduate Students %
Graduate Students %
1991 383 136 519 73.8% 26.2%
1992 516 113 629 82.0% 18.0%
1993 607 95 702 86.5% 13.5%
1994 626 149 775 80.8% 19.2%
1995 541 129 670 80.7% 19.3%
1996 655 137 792 82.7% 17.3%
1997 698 159 857 81.4% 18.6%
1998 713 174 887 80.4% 19.6%
1999 692 149 841 82.3% 17.7%
2000 759 153 912 83.2% 16.8%
2001 635 161 796 79.8% 20.2%
2002 688 196 884 77.8% 22.2%
2003 762 157 919 82.9% 17.1%
2004 876 186 1062 82.5% 17.5%
2005 889 209 1098 81.0% 19.0%
2006 769 249 1018 75.5% 24.5%
2007 833 249 1082 77.0% 23.0%
2008 688 274 962 71.5% 28.5%
2009 778 257 1035 75.2% 24.8%
2010 860 294 1154 74.5% 25.5%
Office of Institutional Research Page 34 UNDERGRADUATEGRADUATIONATTRIBUTESTRENDS
Table G.2 Student Completion Rates (1997 – 2004)
The completion rate is the percentage of degree seeking freshman (not including transfers and readmits) who were enrolled for the first time in the fall and completed requirements and graduated within 6 years period.
Fall 1997 Fall 1998 Fall 1999 Fall 2000 Fall 2001 Fall 2002 Fall 2003 Fall 2004
80% 82% 85% 85% 83% 80% 82% 80%
Office of Institutional Research Page 35 Table G.3 Undergraduate Graduation Patterns by Major (2008-2010)
SSE Feb 2008 June 2008 Feb 2009 June 2009 Feb 2010 June 2010
Actuarial Science 1 1 1 3 5 4
Biology 3 5 2 5 2 7
Chemistry 1 5 2 1 4 7
Computer Engineering 0 0 0 0 1 3
Computer Science 27 15 19 14 16 12
Construction Engineering 12 12 17 17 15 35
Electronic Engineering 18 27 9 30 6 33
Mathematics 2 1 1 0 0 1
Mechanical Engineering 34 21 23 31 31 34
Physics 2 1 0 3 0 4
Total 100 88 74 104 80 140
HUSS Anthropology 3 0 3 1 5 2
Arabic Studies 1 0 0 0 2 0
Art 5 12 11 11 9 14
Egyptology 2 1 1 2 0 2
English & Comparative Literature 3 2 6 2 3 5
History 2 0 0 1 2 3
Modern History 1 1 2 0 0 0
Philosophy 1 0 0 1 3 1
Political Science 39 39 40 37 37 40
Psychology 11 9 8 9 16 8
Sociology 5 3 2 2 3 0
Theatre 2 2 0 4 7 1
Total 75 70 73 74 87 76
SoB Accounting 12 11 14 21 21 19
Business Administration 59 83 71 118 80 82
Economics 20 21 30 35 50 40
Total 91 115 115 174 151 141
GAPP Communication & Media Arts 0 0 2 6 31 27
Integrated Marketing Communication 0 0 0 12 27 40
Journalism 0 0 0 1 3 6
Journalism & Mass Communication 60 89 68 75 31 17
Middle East Studies 0 1 0 4 1 2
Total 60 89 70 94 93 92
Grand Total 326 362 332 446 411 449
Office of Institutional Research Page 36 Table G.4 Undergraduate Graduation Patterns by Citizenship
Graduation Dates
Count Percentage
Egyptian Other
Arab U.S. Others Total Egyptian Other
Arab U.S. Others
Feb 2000 309 39 2 15 365 84.7% 10.7% 0.5% 4.1%
June 2000 341 37 7 9 394 86.5% 9.4% 1.8% 2.3%
Feb 2001 275 27 3 13 318 86.5% 8.5% 0.9% 4.1%
June 2001 278 25 4 10 317 87.7% 7.9% 1.3% 3.2%
Feb 2002 272 20 1 9 302 90.1% 6.6% 0.3% 3.0%
June 2002 345 23 4 14 386 89.4% 6.0% 1.0% 3.6%
Feb 2003 372 17 4 17 410 90.7% 4.1% 1.0% 4.1%
June 2003 302 25 10 15 352 85.8% 7.1% 2.8% 4.3%
Feb 2004 408 28 2 9 447 91.3% 6.3% 0.4% 2.0%
June 2004 395 22 6 6 429 92.1% 5.1% 1.4% 1.4%
Feb 2005 429 27 7 4 467 91.9% 5.8% 1.5% 0.9%
June 2005 388 21 4 9 422 91.9% 5.0% 0.9% 2.1%
Feb 2006 395 14 5 8 422 93.6% 3.3% 1.2% 1.9%
June 2006 315 19 6 7 347 90.8% 5.5% 1.7% 2.0%
Feb 2007 404 25 6 13 448 90.2% 5.6% 1.3% 2.9%
June 2007 350 25 3 7 385 90.9% 6.5% 0.8% 1.8%
Feb 2008 287 26 5 8 326 88.0% 8.0% 1.5% 2.5%
June 2008 329 21 3 9 362 90.9% 5.8% 0.8% 2.5%
Feb 2009 306 11 3 12 332 92.2% 3.3% 0.9% 3.6%
June 2009 410 12 8 16 446 91.9% 2.7% 1.8% 3.6%
Feb 2010 371 20 9 11 411 90.3% 4.9% 2.2% 2.7%
June 2010 418 13 10 8 449 93.1% 2.9% 2.2% 1.8%
Office of Institutional Research Page 37 Table G.5 Undergraduate Graduation Patterns by Gender
Count Percent
Graduation Dates Male Female Total Male% Female%
Feb 2000 177 188 365 48.5% 51.5%
June 2000 172 222 394 43.7% 56.3%
Feb 2001 175 143 318 55.0% 45.0%
June 2001 138 179 317 43.5% 56.5%
Feb 2002 125 177 302 41.4% 58.6%
June 2002 152 234 386 39.4% 60.6%
Feb 2003 181 229 410 44.1% 55.9%
June 2003 152 200 352 43.2% 56.8%
Feb 2004 188 259 447 42.1% 57.9%
June 2004 165 264 429 38.5% 61.5%
Feb 2005 210 257 467 45.0% 55.0%
June 2005 178 244 422 46.5% 53.5%
Feb 2006 196 226 422 42.4% 57.6%
June 2006 167 180 347 48.1% 51.9%
Feb 2007 192 256 448 42.9% 57.1%
June 2007 169 216 385 43.9% 56.1%
Feb 2008 156 170 326 47.9% 52.1%
June 2008 145 217 362 40.1% 59.9%
Feb 2009 155 177 332 46.7% 53.3%
June 2009 177 269 446 39.7% 60.3%
Feb 2010 170 241 411 41.4% 58.6%
June 2010 202 247 449 45.0% 55.0%
Office of Institutional Research Page 38
GRADUATE GRADUATION ATTRIBUTES TRENDS
Table G.6 Annual Graduate Graduation Patterns by Major (2008-2010)
Feb 2008 June 2008 Feb 2009 June 2009 Feb 2010 June 2010
SSE
Biotechnology 0 0 0 1 2 1
Construction Engineering 4 4 5 3 4 5
Computer Science 6 1 8 2 6 1
Computing 0 0 3 13 14 8
Engineering 3 0 0 0 0 0
Environmental Engineering 0 1 1 0 2 0
Mechanical Engineering 3 5 2 1 6 3
Physics 0 3 2 2 0 1
Product Development and System
Management 0 0 2 0 2 1
Total 16 14 23 22 36 20
HUSS
Arabic Studies 4 5 6 3 5 3
English & Comparative Lit. 1 1 0 2 1 1
Political Science 10 17 9 13 6 11
Sociology and Anthropology 6 4 4 2 5 4
Teaching Arabic as a Foreign
Language 4 8 1 4 9 6
Teaching English as a Foreign
Language 4 12 6 13 3 10
Total 29 47 26 37 29 35
SoB
Business Administration 51 31 45 21 35 32
Economics 7 6 11 5 6 3
Economics – International
Development 8 6 10 6 7 5
Total 66 43 66 32 48 40
GAPP
Gender and Women's Studies 0 0 0 1 5 1
International and Comparative Law 7 7 6 4 8 4
International and Human Rights Law 5 10 6 5 9 5
Journalism and Mass Communication 3 11 2 3 7 5
Middle East Studies 4 9 8 10 1 11
Center of Migration and Refugee
Studies 0 0 1 0 5 2
Public Administration 2 0 0 1 0 0
Public Policy and Administration 1 0 3 3 12 3
Television and Digital Journalism 0 0 0 0 0 8
Total 22 37 26 27 47 39
Grand Total 133 141 141 118 160 134
Office of Institutional Research Page 39 Table G. 7 Graduate Graduation Patterns by Citizenship
Count Percentage
Graduation Dates
Egyptian Other Arab
U.S. Others Total Egyptian Other
Arab
U.S. Others
Feb 2006 92 5 7 8 112 82.1% 4.5% 6.3% 7.1%
June 2006 108 5 17 7 137 78.8% 3.7% 12.4% 5.1%
Feb 2007 103 5 11 6 125 82.4% 4.0% 8.8% 4.8%
June 2007 103 2 11 9 125 82.4% 1.6% 8.8% 7.2%
Feb 2008 111 4 13 5 133 83.5% 3.0% 9.8% 3.7%
June 2008 107 2 21 11 141 75.9% 1.4% 14.9% 7.8%
Feb 2009 116 3 13 9 141 82.3% 2.1% 9.2% 6.4%
June 2009 88 2 21 5 116 75.9% 1.7% 18.1% 4.3%
Feb 2010 123 10 16 11 160 76.9% 6.2% 10.0% 6.9%
June 2010 106 8 12 8 134 79.0% 6.0% 9.0% 60.%
Office of Institutional Research Page 40 Table G.8 Graduate Graduation Patterns by Gender
Count Percent
Graduation Dates
Male Female Total Male% Female%
Feb 2006 42 70 112 37.5% 62.5%
June 2006 54 83 137 39.4% 60.6%
Feb 2007 57 68 125 45.6% 54.4%
June 2007 51 74 125 40.8% 59.2%
Feb 2008 66 67 133 49.6% 50.4%
June 2008 50 91 141 35.5% 64.5%
Feb 2009 65 76 141 46.1% 53.9%
June 2009 46 70 116 39.7% 60.3%
Feb 2010 87 73 160 54.4% 45.6%
June 2010 62 72 134 46.3% 53.7%
Office of Institutional Research Page 41
Faculty
FULL-TIME FACULTY (Fall 2010)
Table F.1 Full-Time Faculty by Citizenship (Fall 2010)
Nationality 2010
Egyptian 264 58.0%
US 134 29.5%
Other Nationalities 57 12.5%
Total 455
Table F.2 Full-Time Faculty by Terminal Degree (Fall 2010)
Terminal Degree 2010
PhD 333 73.2%
Master 121 26.6%
Bachelor 1 0.2%
Total 455
Table F.3 Full-Time Faculty by Rank (Fall 2010)
Table F.4 Full-Time Faculty by Gender (Fall 2010)
Gender 2010 2010
Male 245 54%
Female 210 46%
Total 455
Fall 2010 faculty to student ratio is 1 to 11.5.
Rank 2010
Full Professor 109 24.0%
Associate Professor 71 15.6%
Assistant Professor 131 28.8%
Instructor 109 24%
Administrators with Faculty Position 8 1.8%
Others with Faculty Position 27 5.9%
Total 455