See discussions, stats, and author profiles for this publication at: https://www.researchgate.net/publication/292378071
Social Determinants of Health in Arab Countries
Presentation · March 2013
DOI: 10.13140/RG.2.1.3913.5763
CITATIONS
0
READS
132 1 author:
Some of the authors of this publication are also working on these related projects:
Disease prevention and health promotion in developing countriesView project
Action on Social Determinants of Health in order to reduce health inequityView project Abdesslam Boutayeb
Université Mohammed Premier 167PUBLICATIONS 3,358CITATIONS
SEE PROFILE
All content following this page was uploaded by Abdesslam Boutayeb on 31 January 2016.
The user has requested enhancement of the downloaded file.
Social Determinants of Health in Arab Countries
Boutayeb Abdesslam Faculty of Sciences
University Mohammed Ier Oujda, Morocco
In(equity) in Arab countries
1. Introduction
2. Measurements of inequity
3. Inequity within Arab countries 3.1 Description
3.2 Analysis
4. Health equity, education and poverty trap
5. Conclusion
1. Introduction: SDH and Health equity
Social Determinants generating health
differences and variations
Differences generated by
Sex Age Genetic
……..
Differences
generated by social conditions
(Economic, Political, Social or Cultural )
Differences generated Randomly,
By Chaos (unavoidable)
Definition of Health Equity in ISEqH’s constitution, 2000
“The absence of systematic and
potentially remediable differences in one or more aspects of health across
populations or population groups defined
socially, economically, demographically,
or geographically”
Definition of Health Equity by WHO Commission on Social Determinants of Health, 2008
“Where systematic differences in health are
judged to be avoidable by reasonable action they are, quite simply, unfair. It is this that we label
health inequity. Putting right theses inequalities -the huge and remediable differences in health
between and within countries- is a matter of social justice. Reducing health inequities is an ethical imperative. Social injustice is killing people on grand scale”
Health inequity: A multidimensional, multi-scale and multi-criteria problem
Multidimensional (Geographical disparities, Gender inequity, Ethnic differences, Socioeconomic inequalities)
Multi-scale (International, Regional, National, Provincial, Local,…).
Multi-criteria (Self assessment, richest-poorest, whole gradient, time- dependence, absolute-relative values, quantitative, qualitative)
=> Different strategies: levelling up, levelling down, levelling up and down, targeting approach, narrowing the gap between the most and least advantaged, reducing inequalities through the whole gradient, etc….
Health inequity: a worldwide problem
•
“Our children have dramatically different life chances depending on where they were born. In Japan, Sweden or Germany they can
expect to live more than 80 years; in Brazil, 72 years; India, 63
years; and in one of several African countries, fewer than 50 years.
And within countries, the differences in life chances are dramatic and seen worldwide. The poorest of the poor have high levels of illness and premature mortality. But poor health is not confined to those worst off. In countries at all levels of income, health and illness follow a social gradient: the lower the socioeconomic position, the worse the health”. (Commission on Social Determinants of
Health, 2008)
•
“It is unacceptable that a child born in some parts of Africa can live up to 50 years less than a child born in Japan; and it is unacceptable within the UK there are up to 28 years differences depending on
where you live” (Marmot, 2008).
Example1: High HDI with health inequity:
Norway HDI=0.938; rank 1(2010)
Example2. Household income in Britain (Whitehead 2009)
Example3: On a journey on the London Underground, just 8 stops, life expectancy for men drops by one year per stop
2.
Measurements of inequityInequity can be described and/or measured by:
-Multidimensional data analysis (Discriminant analysis, Classification, Regression,…)
-Ratio most advantaged/least advantaged (usually poorest quintile(20%)/richest quintile(20%))
-Odds Ratio
-Concentration Index -Gini Index
-Relative index of inequality
Inequities: overlapping and cumulative effect:
literacy rate (Morocco,1999), A:advantaged; D:disadvantaged
Evolution of illiteracy rates in Algeria (MICS3,2000)
Absolute gap reduced but relatively, inequity increased
Gender inequity: Evolution of illiteracy rate in Algeria
62
48.2
30.7 23.6
58.1
43.6
31.9 85.4
74.3
56.6
40.2 74.6
0 20 40 60 80 100
1 2 3 4
1966 1977 1987 1998
Percentage Men
Algeria Women
The same dataset may lead to opposite conclusions quantitatively and qualitatively
1966(%) 1998(%)
Women men - or / Women Men - or /
Absolute differences: 85.4 – 62 = 23.4 40.2 – 23.6 = 16.6 =>Reduction
Relative differences: 85.4 / 62 = 1.37 40.2 / 23.6 = 1.7 =>Increase 1966(%) 1998(%)
Women 85.4 / 40.2 = 2.1 Men 62.0 / 23.6 = 2.7 Women Men
(85.4 – 23.4) /32 = 1.4 (62 – 23.6) /32 = 1.2
Gini Index
Gini index
0 0,2 0,4 0,6 0,8 1
cumulated income groups
cumulated income
perfect equity inequity
inequity
exacerbated
Gini Index illustrating inequality in different distributions
Gini Inde x of # dis tributions
0 10 20 30 40 50 60
1 2 3 4
GI1=0.22 GI2=0.34 GI3=0.41 GI4=0.41
Poorest quintile 2d quintile
3d quintile 4th quintile Richest quintile
Ratio Richest / Poorest
Income/consumption in North Africa(UNDP,2009)
2,8 7 26,8
42,6
3,7 8,6
29,5 43,6
2,66,5 30,9
46,6
2,3 6 31,5
47,3
0 10 20 30 40 50
Algeria(1995) Egypt(99-00) Morocco(98-99) Tunisia(2000)
Poorest 10%
Poorest 20%
Richest 10%
Richest 20%
Trends in Gini Index for 13 Arab countries
35.3 (1995) Algeria
64.3 (2004) Comoros
32.1 (2004) 30.1 (1995)
Egypt
37.7 (2006) 36.4 (1997)
Jordan
36.0 (1999) 34.7 (1987)
Kuwait
36.0 (2004) Lebanon
39.0 (2000) 37.3 (1995)
Mauritania
40.9 (2007) 39.5 (1998)
Morocco
39.9 (2000) Oman
37.4 (2004) 33.7 (1997)
Syria
37.7 (2005) 41.7 (1995)
Tunisia
38.3 (2007) UAE
37.7 (2005) 33.4 (1998)
Yemen
3.1 Description and illustration of disparities, discrepancies and inequalities
In many cases, health strategies have significantly improved health indicators globally (in average)
but disparities urban-rural, discrepancies between regions and inequalities among
socioeconomic groups of the same Arab country have persisted or even increased. Illustration is given by a multitude of examples: 1) Between provinces; 2) Rural-Urban; 3)By wealth quintile;
4) Milieu of residence + Education + wealth
Percentage of deliveries without medical assistance Tunisia (PAPCHILD 1994, PAPFAM 2001 and MICS3 2006)
IMR and U5MR in Soudan(MICS2, 2000)
HDI in Moroccan regions (UNDP, 2003)
Number of inhabitants per physician 4587
836
0 500 1000 1500 2000 2500 3000 3500 4000 4500 5000
1 3 5 7 9 11 13 15
16 regions of Morocco
Number
Inhabitants per physician
Under five Mortality in Egypt (DHS 2008)
Under five Mortality in Lebanon (MICS2 2001)
Under five mortality by governorates
0 10 20 30 40 50 60
1 U5MR
Rate per 1000 live births
Beirut
Mount Lebanon South
North Bekaa
Delivery in Public and private health facilities in Jordan (MICS3 2007)
Delivery in health facilities in Jordan, 2007
0 20 40 60 80 100
1 3 5 7 9 11
12 governorates
percentage Total
Public health facility
Private health sector
Assisted delivery in Yemen (MICS3 2006)
Differences in access to health care, Yemen (MICS3, 2006)
17.4 61.7
40.3 26
0 10 20 30 40 50 60 70
1 2
Skilled personnel Delivery in health facility
Percentage
Urban Rural
Antenatal and delivery in Morocco (DHS 2003-04)
28,7 70,5
39,5 85,3
61,6
16,4
0 10 20 30 40 50 60 70 80 90
Antenatal visits
Assisted delivery
Home delivery
Rural Urban
Assisted delivery in Djibouti (MICS3,2006)
De live ry in Djibouti (MICS3,2006)
94.7 89.2
40.3 36.5
0 20 40 60 80 100
1 2
Ski l l e d pe rsonne l In he al th faci l i ty
Percentage Urban
Rural
Assistance during delivery, Syria (MICS3, 2006)
Assistance durant delivery , Sy ria (M ICS3, 2006)
97.6
75.3 88.4
65.5
0 20 40 60 80 100 120
1 2
Skilled p ersonnel In health facility
Percentage Urban
Rural
Delivery in public and private health facilities in Jordan (MICS3, 2007)
De live ry in he alth facilitie s in Jordan, 2007
60.2
82.2
38.5
16.2
0 20 40 60 80 100 120
1 2
Urban Rural
Percentage Total
Public Private
Child health indicators in Egypt(DHS2003)
0 20 40 60 80 100 120
Low Quintile
2d Quintile
3d Quintile
4th Quintile
high Quintile
IMR U5MR St unt ing
Underw eight
Births attended by skilled personnel in Arab countries: poorest quintile vs richest quintile
Births attended by skilled personnel
0 20 40 60 80 100
1 2
Poorest quintile vs richest quintile
Percentage
Comoros Egypt Jordan Mauritania Morocco Syria Yemen
Delivery in public and private health facility by wealth quintile in Jordan (MICS3, 2007)
De live ry in he alth facility by we alth quintile in Jordan, 2007
0 20 40 60 80 100 120
1 2 3 4 5
Quintliles from poorest to richest
Percentage Public facility
Private sector Total
Infant Mortality in Mauritania (MICS3 2007)
Under five Mortality in Syria(MICS3, 2006)
3.2 Equity analysis
Except for Syria and Jordan, inequity was
apparently illustrated by all the other examples considered. This conclusion can be checked by equity analysis, going beyond description and using different tools.
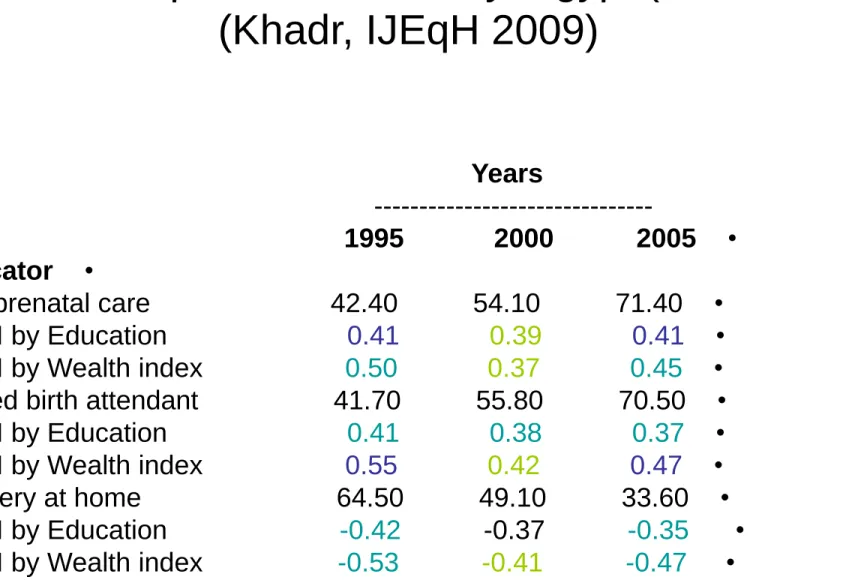
Inequity in Egypt
Analyzing Egyptian data provided over a ten-year period by the Demographic Health Surveys (EDHS1995,
EDHS2000 and EDHS2005), Khadr (2009) has shown that, although, almost all maternal health indicators have globally improved, improvements were not equally
enjoyed by all population groups. For instance,
considering the percentages of prenatal care, skilled birth attendant and delivery at home, the study showed persistence of inequities among women of different
levels of wealth and education as indicated by the concentration index in Table1 below
Table 1: Disparities in delivery, Egypt (1995-2005) (Khadr, IJEqH 2009)
Years
---
• 1995 2000 2005
• Indicator
• Any prenatal care 42.40 54.10 71.40
• CI by Education 0.41 0.39 0.41
• CI by Wealth index 0.50 0.37 0.45 Skilled birth attendant 41.70 55.80 70.50 •
• CI by Education 0.41 0.38 0.37
• CI by Wealth index 0.55 0.42 0.47
• Delivery at home 64.50 49.10 33.60
• CI by Education -0.42 -0.37 -0.35
• CI by Wealth index -0.53 -0.41 -0.47
Health equity in Tunisia (PAPCHILD 1994, PAPFAM 2001, MICS2-2002 and MICS3-2006)
According to data provided in Tunisia by four surveys spanning more than a decade period, health indicators related to women and children have improved
substantially in global terms. However, large gaps remain essentially according to wealth's group and milieu of residence (rural-urban and between
governorates).
This result was particularly confirmed by a logistic regression model in MICS2, showing that antenatal
care, postnatal care, births assisted and health facilities use, vaccination, child malnutrition all exhibit significant correlation with milieu and mother's education level.
Inequity in Tunisia
Percentage of deliveries without medical assistance
National improvement, Rural-Urban persistent, Provincial inequity increasing
2006 2001
1994
11 20.8
30.6 Rural
2 3.2
5.3 Urban
5.5 6.5
5.8 Ratio R/U
29.4 32.5
34.3 Gasrine
0.6 1.5
3.3 G-Tunis
49 22
10.5 Ratio
5.4 9.7
15.8 National
decrease decrease
trend
1.8 1.6
Health equity in Lebanon: a microeconomic analysis N. Salti, J. Chaaban and F. Raad(IJEqH, 2010)
• Analysis of the effect of insurance, out of pocket expenditures and the share of spending on
health, indicated the vulnerability of the lowest quintile of expenditures per adult equivalent. The uninsured spend both less money on health and a larger proportion of their expenditures on
health.
The authors have also used descriptive methods and logistic regression for comparison between provinces.
“
Fifty years of human development in Morocco and perspectives 2025” (Morocco, 2006)0 1 2 3 4
Q1 Q2 Q3 Q4 Q5
IMR 1992 IMR 2003 U5MR 1992 U5MR 2003
0 2 4 6 8 10 12 14
Q1 Q2 Q3 Q4 Q5
Delivery home 92
Delivery home 03
Important achievements in average but inequity is still there (Boutayeb, 2009)
The percentage of deliveries at home has been reduced from 71·6% in 1992 to 38·5% in 2003. On average, the country has achieved important progress by nearly
halving the percentage of women giving birth at home.
However, the ratio between poorest and richest quintiles has increased from 3·3 to 11·8 in a decade or so.
About 95% of richest women are using public and private centres for delivery whereas 70% of the poorest women are still delivering at home.
A poor child is threefold likely to die before his or her fifth birthday than a rich child. Moreover, the ratio gap has
increased from 2·85 in 1992 to 2·98 in 2003
Necessity of a deeper analysis of equity in Jordan
Data from MICS3 in Jordan shows a high association between mother’s level of education and the place of birth and also a high negative correlation between household wealth and delivery in the public health sector
Public health facility Private health sector Delivery at Home Mother’s education
No education 84.9 8.6 6.3
Elementary 83.3 12.8 3.8 Preparatory 76.2 22.0 1.8
Secondary 64.8 33.9 1.1 Higher 50.6 49.0 0.3
Wealth quintile
Lowest 83.9 13.2 2.7
Second 77.0 21.3 1.6 Third 63.4 36.0 0.5
Fourth 47.9 51.7 0.4 Higher 20.7 79.2 0.1
4. Education, health equity, and poverty trap
In almost all Arab countries, the efforts devoted to enroll the maximum of children at age 6 are not accompanied during the whole education cycle.
Consequently, many countries have high rates of dropping out at different levels and obviously, the children living in disadvantaged households are more likely to leave school prematurely than their counterparts from
advantaged households (poverty, work, proximity, parents education….)
• In morocco, the educative system efficiency is very low (57.5 for primary school and 35.4 for secondary level). The lost is due to high levels of
dropping out and failure. Analysis of data in the poorest 404 rural districts identified by the National Initiative for Human Development (NIDH) revealed that socioeconomic conditions and proximity of school are the main factors explaining dropping out (Conseil Superieur de l Enseignement, 2008)
• In Egypt 1/5 of children live in poverty and 1 in 4 are deprived of one or more dimensions of welfare(education, health, shelter, food,etc...)
• In Tunisia, a multivariate analysis of data from MICS3 showed that the proportion of children reaching the fifth level of primary school was principally correlated with milieu and children work.
• According to data from MICS3, in Djibouti, the rate of secondary school attendance drops seriously to 13.4 for disadvantaged children compared to 62.4 for advantaged ones.
The poverty trap
Less access to Education-health
Early marriage Low socioeconomic
Less influence Disadvantaged
Households
Poverty-health- education
(WHO Director-General, WHO report 2003)
• While a baby girl born in Japan today can expect to live for about 85 years, a girl born at the same moment in Sierra Leone has a life expectancy of 36 years. The Japanese child will receive vaccinations, adequate nutrition and good schooling. If she becomes a mother she will benefit from high-quality maternity care. Growing older, she may eventually develop chronic
diseases, but excellent treatment and rehabilitation services will be
available; she can expect to receive, on average, medications worth about US$ 550 per year and much more if needed.
• Meanwhile, the girl in Sierra Leone has little chance of receiving immunizations and high probability of being underweight throughout
childhood. She will probably marry in adolescence and go on to give birth to six or more children without assistance of a trained birth attendant. One or more of her babies will die in infancy, and she herself will be at high risk of death in childbirth. If she falls ill, she can expect, on average, medicines worth about US$3 per year. If she survives middle age she, too, will develop chronic diseases but, without access to adequate treatment, she will die prematurely.
5. Conclusion
Health inequity remains a major problem in Arab countries.
Need to collect appropriate data for equity analysis Need to go beyond average numbers :(HDI, MDG, IMR, MMR,GDP p.c, …)
Hope that Arab decision makers opt for equitable strategies
No development can be sustainable unless inequities, disparities and discrepancies are reduced.
Thank you for your attention
View publication stats View publication stats