REVENUE AUTONOMY AND REGIONAL GROWTH:
AN ANALYSIS FOR THE 25 YEAR-PROCESS OF FISCAL DECENTRALISATION IN SPAIN
RAMIRO GIL-SERRATE JULIO LÓPEZ-LABORDA
JESÚS MUR
FUNDACIÓN DE LAS CAJAS DE AHORROS DOCUMENTO DE TRABAJO
Nº 609/2011
De conformidad con la base quinta de la convocatoria del Programa de Estímulo a la Investigación, este trabajo ha sido sometido a eva- luación externa anónima de especialistas cualificados a fin de con- trastar su nivel técnico.
ISSN: 1988-8767
La serie DOCUMENTOS DE TRABAJO incluye avances y resultados de investigaciones dentro de los pro- gramas de la Fundación de las Cajas de Ahorros.
Las opiniones son responsabilidad de los autores.
1
REVENUE AUTONOMY AND REGIONAL GROWTH: AN ANALYSIS FORTHE 25 YEAR-PROCESS OF FISCAL DECENTRALISATION IN SPAIN
Ramiro Gil-Serrate*
Julio López-Laborda**
Jesús Mur***
ABSTRACT:
This paper discusses the existing research on the relationship between fiscal decentralisation and economic growth and proposes some changes on the analyzing approach with regard to the measure of fiscal decentralisation and the estimation of the relationship compared with previous works. These proposals are implemented in the case of the Spanish decentralisation process (1984-2008). As a result a group of revenue autonomy indicators, specific to the Spanish case, is presented and a group of VAR models is estimated for the relationship between revenue autonomy of Spanish regional governments and regional growth. The results of the analysis point to a possible slightly positive effect of revenue autonomy of Spanish regional governments on regional growth. On the other hand, revenue autonomy appears to be not determined by growth but only by political decisions.
Keywords: revenue autonomy; regional growth; fiscal decentralisation; Spanish regions JEL classification: C31; H71; H 77; R11
*
London School of Economics. Department of Geography and Environment. Houghton Street, London WC2A 2AE, UK.**
Universidad de Zaragoza. Departamento de Economía Pública. Gran Vía 2, Zaragoza 50005, España.***
Universidad de Zaragoza. Departamento de Análisis Económico. Gran Vía 2, Zaragoza 50005, España.2
1. INTRODUCTIONTraditionally, arguments in favour of fiscal decentralisation, based on the seminal works of Tiebout (1956), Stiegler (1957), Musgrave (1959), Oates (1972) and Brennan and Buchanan (1980), claimed it stimulated government efficiency in delivering services, generated greater transparency and accountability in government action and controlled government size. These results were a consequence of proximity and information advantages of local governments, population mobility across local communities and competition among local governments in the provision of public goods. More recently, Oates (1993) transposed the essence of the proposition concerning the promotion of economic efficiency by a decentralisation process to the dynamic sphere of economic growth, thought without formal analysis. Later, several works developed a theoretical framework reflecting the relationship between fiscal decentralisation and economic growth. Different theoretical proposals can be seen in Xie et al (1999), Zhang and Zou (2001) and Gong and Zou (2003), where optimal levels of fiscal decentralisation (maximisers of economic growth) are identified in excess of which the effects of decentralisation upon growth become negative; Brueckner (2006) showed that economic growth can be promoted when public goods are tailored to young and old individuals under fiscal federalism and Gil-Serrate and López-Laborda (2009) obtained the optimal level of tax decentralisation and its determinants in a two-tier framework of local and federal government.
Nevertheless, from an empirical point of view, the literature is not conclusive
about the statistical significance and sign of the effect of fiscal decentralization on
growth. Xie et al (1999) found no statistically significant relationship between
expenditure decentralisation and income growth in the US during almost the second half
of the 20
thcentury, however, Akai and Sakata (2002) found that the ratios of
expenditure and revenue decentralisation from state to local governments had a positive
and significant impact on state GDP in the first half of the 90s. Zhang and Zou (1998)
reported a negative relation between expenditure decentralisation and income growth in
Chinese provinces, although, Lin and Liu (2000), when considering a similar period of
study, found that the marginal retention rate of national budget revenues collected at the
provincial level had a positive and statistically significant impact on Chinese provincial
3 growth. Desai et al (2003) found a positive effect of the retention rate of national budget revenues collected at the Russian regions upon the recovery of regional industrial production in the late 90s. When the analysis is undertaken for groups of countries, Davoodi and Zou (1998) reported no relationship between expenditure decentralisation and economic growth in developing and developed countries during the 70s and the 80s, and this is also the case in Fukasaku and de Mello (1998) when considering revenue decentralisation in a group of developed and developing countries from the beginning of the 70s to the beginning of the 90s, in Woller and Phillips (1998) for expenditure and revenue decentralisation and economic growth in less developed countries from 1974 to 1991, and in Thornton (2007) for economic growth in 19 OECD member countries over the 80s and the 90s when considering fiscal autonomy of sub-national governments in 1995. At the same time, Yilmaz (2000) found that expenditure decentralisation had a positive and statistically significant impact on economic growth in 17 unitary states from 1971 to 1990, Iimi (2005) reported a significant and positive effect of expenditure decentralization on per capita GDP growth for a group of developed and developing countries from 1997 to 2001, and Thießen (2003) reported, for the period 1973-1998, a positive relation between expenditure decentralization and growth for a group of OECD economies when decentralisation is increasing from low levels. Finally, Rodríguez-Pose and Kroijer (2009) analysed the case of 16 Central and Eastern European countries and reported a negative relationship between the two magnitudes over the 1990-2004 period.
Several reasons can explain these differences in results, apart from the differing economic or time scenarios analysed in each case. On the one hand, the different levels of economic development and fiscal decentralisation among the countries considered.
According to Bahl and Linn (1992) there is the necessity of exceeding a certain
threshold of development in order for fiscal decentralisation to provide positive effects
upon economic growth. The different levels of fiscal decentralisation achieved might be
also an explanation, in accordance with some of the theoretical proposals mentioned
above and with Thießen (2003) where it is argued that as decentralisation increases its
positive relationship with economic growth eventually turns negative. On the other hand
the different results can also be explained by the different fiscal decentralisation
indicators employed. Specifically, the fiscal decentralisation indicators which are
normally utilised are the sub-central/total government ratios of expenditure and revenue,
4 compiled using data from the Government Financial Statistics (GFS) of the International Monetary Fund (IMF) or national statistical offices. These indicators, although highly operative, in many cases do not provide adequate information regarding the degree of sub-central government’s autonomy with respect to central control.
As stated in Thornton (2007, p. 65) “A serious problem with much of the literature on the macroeconomic impact of fiscal decentralization is that it fails to make an appropriate distinction between ‘administrative’ and ‘substantive’ decentralization by not recognizing that high sub-national revenue and spending shares do not necessarily indicate high local autonomy”. That is to say, in line with Rodden (2004), the indicators usually employed do not reflect the basis of the majority of the theoretical arguments which refer to the advantages produced by a process of fiscal decentralisation. In response to this situation, several studies have been published (Ebel and Yilmaz, 2002;
Meloche et al, 2004; Stegarescu, 2005; Thornton, 2007) which, without abandoning the quantitative nature of the indicators, have proposed a more diligent employment of the data available for a series of countries. The essential idea is that it is important to take into account not only the volume of decentralised resources, but also the degree of control that sub-central governments exert over them; consequently, an important element of the theory of fiscal federalism would be captured and, as a result, the empirical analysis of decentralisation processes would become more accurate.
Another reason that could explain the differences in results in the empirical
analysis of the relationship between fiscal decentralisation and economic growth is the
methodology used in the analysis. The most common approach is to estimate a growth
equation according to the different theories of economic growth using cross-section, see
for example Iimi (2005) and Thorton (2007), time series, as in Xie et al (1999) or, most
of the times, panel techniques, see among others Zhang and Zou (1998) and Rodríguez-
Pose and Kroijer (2009). This approach in some occasions could present problems
regarding the specification of the equation and the possible presence of endogeneity in
the estimation that would affect the results obtained. With regard to the specification of
the equation, the omission of relevant control variables or the manner in which fiscal
decentralisation is considered in the equation may lead to a biased result regarding the
relationship between this variable and economic growth. In addition, failing to consider
the presence of endogeneity and reverse causation may hamper the conclusions obtained
5 from the analysis in case all the right-hand side variables are not exogenous. However, the question of endogeneity is rarely tackled in the specific literature, an exception is Desai et al (2003), due to the fact that it is difficult to select appropriate instruments for the variable of fiscal decentralisation for which continuous data are available. In order to overcome these methodological problems we consider that a Vector Autoregressive Regressions (VAR) analysis is more appropriate in the study of the relationship between fiscal decentralisation and economic growth since this approach allows us to consider the possible existence of mutual interactions in a relevant framework where additional hypothesis do not need to be included, resulting this in a more objective and clear estimation of the relationship
1.
Taking into account these caveats regarding the measurement of fiscal decentralisation and the methodology used, this paper analyses the effect that fiscal decentralisation had on economic growth in the Spanish regions from the beginning of the decentralisation process in democratic Spain to present. Using a data sample of the 17 Spanish regions we test over the time period 1984-2008 the relationship between revenue autonomy and economic growth rate at regional level
2. Specifically, three different categories of revenue autonomy are considered and defined according to the specific characteristics of the process of fiscal decentralisation in Spain and the economic classification of Spanish public accounts. The economic growth of the regions is measured through the rate of growth of regional GDP at constant prices.
The Spanish case is particularly interesting for the analysis of the macroeconomic impact of fiscal decentralisation because, after Franco’s dictatorship ended in the 70s, the country embarked in a transition from a highly centralized administrative system to a federal structure system with 17 regions where a strong decentralisation process has taken place in a relatively short period of time. This process has included ‘own-source’ revenues for sub-central governments and important tax sharing agreements among the different regions and the central government which left the formers with power to influence the revenues accruing to them individually through
1 The effect of economic growth on fiscal decentralisation is also analysed in the literature. A significant and positive effect is identified, which is explained considering fiscal decentralisation a superior good, see among others Panizza (1999) and Letelier (2005).
2 The new Spanish constitution was approved at the end of 1978, however, the set up of the named
“Autonomic State” was finished in 1983.
6 some degree of control over tax rates. These characteristics of the Spanish fiscal decentralisation process, together with the profusion and high quality of the existing data with regard to the fiscal relations among the different levels of governments, result in a very relevant case of analysis which experience can be of high interest for countries that are at present implementing fiscal decentralisation reforms.
The main results of the analysis point out that revenue autonomy in Spanish regional governments has had a slightly positive impact on regional growth throughout the 25 years of fiscal decentralisation experienced in Spain. On the other hand, the relevant growth experienced by the Spanish regional economies along this period has not had any effect on the progress on regulatory powers that regional governments have over their revenues which it seems that is basically determined by political decisions.
The paper is structured as follows. In the next section we describe the process of fiscal decentralisation that has taken place in Spain from 1984 to 2008. In the third section, we propose a set of indicators of revenue autonomy of the Spanish regional governments which take into account the different degree of control that exert over their
‘own-source’ and tax-shared revenue. The following section describes the data and
methodology that we use to test the relationship between fiscal decentralisation and
economic growth in Spanish regions according to the indicators proposed previously
and includes a discussion and interpretation of the principal results obtained. The final
section presents the main conclusions reached.
7
1. 25 YEARS OF FISCAL DECENTRALISATION IN SPAIN: 1984 - 2008The Spanish Constitution of 1978 marked the beginning of democracy in Spain after almost 40 years of dictatorship. In it was recognised the right to regional self- government. The development of this right resulted in what has been called the
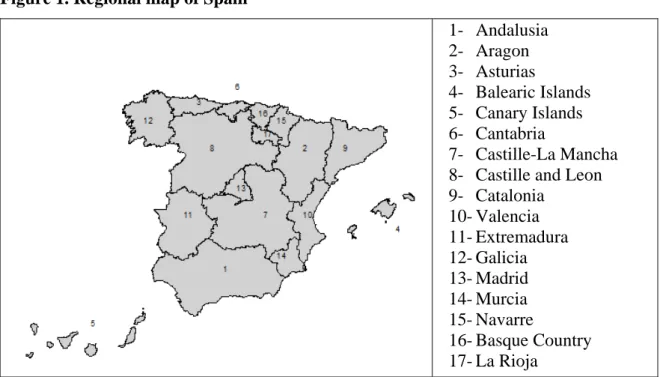
“Autonomic State” which is formed by 17 “Autonomous Communities” (regions, see Figure 1) and 2 “Autonomous Cities”
3. The Spanish regions are very diverse in terms of population, per capita income and size. Table 1 presents a summary of these features of Spanish regions together with the number of local jurisdictions (provinces and municipalities) included in each territory
4, the year each “Autonomous Community”
was founded, the level of devolution achieved at that moment and the type of financing system applied to its devolution process.
Figure 1. Regional map of Spain
1- Andalusia 2- Aragon 3- Asturias
4- Balearic Islands 5- Canary Islands 6- Cantabria
7- Castille-La Mancha 8- Castille and Leon 9- Catalonia
10- Valencia 11- Extremadura 12- Galicia 13- Madrid 14- Murcia 15- Navarre
16- Basque Country 17- La Rioja
3 These are Ceuta and Melilla, both of them in North Africa.
4 The Spanish province is a tier of local government which groups a number of municipalities within certain geographical boundaries. It´s main purpose is to assist these municipalities with the performance of their functions. There are seven Spanish regions consisting of a single province, in these cases, the provincial administration, budgeting included, is integrated into the regional administration.
8 Table 1. Main geo-economic and devolution features of Spanish regions
POPULATION (2008)
PER CAPITA GDP (2008)
AREA
Provinces Municipalities
Foundation of the Autonomous
Community
Level of devolution
at foundation
Type of financing
system Population % € Index
Average=100
Km2 %
Andalusia 8,202,220 17.77 14,580 77.34 87,598 17.31 8 770 1981 High Common
Aragon 1,326,918 2.87 20,481 108.64 47,720 9.43 3 731 1982 Low Common
Asturias 1,080,138 2.34 17,654 93.65 10,604 2.10 1 78 1981 Low Common
Balearic Islands 1,072,844 2.32 20,505 108.77 4,992 0.99 1 67 1983 Low Common
Canary Islands 2,075,968 4.50 17,312 91.83 7,447 1.47 2 88 1982 High Common
Cantabria 582,138 1.26 19,328 102.52 5,321 1.05 1 102 1981 Low Common
Castile and Leon 2,557,330 5.54 18,281 96.97 94,225 18.62 9 2,248 1983 Low Common Castile-La Mancha 2,043,100 4.43 14,363 76.19 79,462 15.70 5 919 1982 Low Common
Catalonia 7,364,078 15.95 21,614 114.65 32,113 6.35 4 946 1979 High Common
Valencia 5,029,601 10.90 16,860 89.43 23,255 4.60 3 542 1982 High Common
Extremadura 1,097,744 2.38 13,492 71.57 41,635 8.23 2 383 1983 Low Common
Galicia 2,784,169 6.03 16,087 85.33 29,574 5.84 4 315 1981 High Common
Madrid 6,271,638 13.59 24,694 130.99 8,028 1.59 1 179 1983 Low Common
Murcia 1,426,109 3.09 15,475 82.09 11,313 2.24 1 45 1982 Low Common
Navarre 620,377 1.34 24,042 127.53 10,390 2.05 1 272 1982 High Charter
Basque Country 2,157,112 4.67 25,338 134.40 7,235 1.43 3 251 1979 High Charter
La Rioja 317,501 0.69 20,115 106.70 5,045 1.00 1 174 1982 Low Common
SPAIN 46,157,822 100.00 18,852 100.00 505,990 100.00 50 8,112 - - -
Source: Instituto Nacional de Estadística (Spain), Ministerio de Política Territorial (Spain) and López-Laborda and Monasterio (2007).
9 The distribution of power between the regions and the central government is established by the constitution, which nevertheless sets out only general principles in the matter of revenue assignment. The central government has exclusive power over those areas related with economic stabilisation, defence, foreign policy and trade, basic social security legislation and funding and the provision of national public goods and services, such as national public works, infrastructure and transport. With regard to the regions, they have responsibility for the provision of a wide range of regional public goods and services which specifically impact the well-being of people living within their territory.
These include town and country planning, housing, regional public works, infrastructure and transport, farming, environment, culture, tourism and sports, as well as health and education, the two basic public services provided by the Welfare State. At first, due to historical reasons, only a small group of regions were granted powers in the areas of education and health, these resulted in two different levels of devolution, high and low, see Table 1. However, later on these two responsibilities were also transferred to the rest of the regions, education between 1995 and 1999 and health in 2002. As a result it may fairly be said that since then, although certain minor differences persisted
5, the Spanish regions had practically the same responsibilities. It should be made clear that the regions do not exercise their powers within a framework of complete freedom. While they have exclusive responsibility in some areas without the intervention from any other level of government, this is the case, for example, of regional public works, infrastructure and transport, their actions in others are subject to certain restrictions, as happen in the areas of education and health where the central government establishes basic legislation
6.
Currently, in order to carry out with their responsibilities, regional governments are responsible for more than 35 percent of total public expenditure and for more than 50 percent of general government employment. The constitution establishes two different systems for the funding of regional expenditure, as shows Table 1, the named
“common” system applicable to all of the regions with the exception of the Basque Country and Navarre, and the named “charter” system applicable to the latter based on
5 For example, Catalonia, Navarre and the Basque Country share policing responsibilities with the central government in their territories.
6 In these areas, this is intended to ensure that the conditions of the service remain substantially the same nationwide.
10 their historical charters on fiscal and economic matters. The “common” system has been progressively modified as regional governments have taken on more responsibilities.
The most significant reviews of the system took place in 1986, 1992, 1996, 2001 and 2009
7. Initially, the devolved responsibilities to regional governments were financed by way of lump-sum general grants. However, this type of funding thwarted the effective action of two main criteria for fiscal decentralisation: the principle of financial autonomy, which requires each jurisdiction to be in a position to decide the level and structure of its revenues and spending; and the principle of accountability, which establishes that the cost of providing regional and public goods and services should be directly borne by the beneficiaries. Consequently, the funding based exclusively on general purpose grants was soon abandoned and replaced with a mix of grants and transferred taxes, more in line with fiscal federalism theoretical arguments and the experience of other decentralised countries.
The transferred taxes are regulated at the central level, which assigns certain control over them to the regional governments. Until 1997 this control comprised only collection and administration of the tax. The regions were not given any powers to determine the rate or the base of the transferred taxes, and the system should therefore properly be described as a tax sharing arrangement rather than own taxes. However, since the review of the system in 1996, the regional governments were allowed to set the tax rate and establish tax credits and allowances for some taxes. From then onward some transferred taxes may be defined as own regional taxes, as long as the regional governments have discretion, at least, to set the tax rate (Bird, 1993). Table 2 shows the taxes transferred and the powers that regional governments had over them from 1997 to the end of 2008. The last column of the table classifies the taxes between own taxes and tax sharing arrangements, according to the literature. Central government retains all powers over the collection, administration and regulation of corporate income tax, the tax on insurance premiums, carbon tax, payroll taxes, import duties and non-resident taxes. Regarding the personal income tax, in principle, each region receives 33 percent of the total tax take in its territory, however, since the regional government may increase or reduce the rate, as well as establishing their own tax credits, the take may be higher or lower than 33 percent.
7 These resulted from periodical official negotiations between the regions and the central level of government.
11
Table 2. Taxes transferred to the regional level under the “common” financing systemTAX SHARING OF
COLLECTION
ADMINISTRATION BY REGIONAL GOVERNMENT
REGULATION BY REGIONAL GOVERNMENT
CLASSIFICATION
Personal Income Tax
33% NO Tax schedule and
tax credits
Own tax
Tax on Net Wealth
100% YES Threshold, tax
schedule and tax credits
Own tax
Inheritance and Gift Tax
100% YES Allowances, tax
schedule, tax credits, administration and collection
Own tax
Capital Transfer Tax,
Tax on the Raising of Capital, and Stamp Duties
100% YES Tax rates, tax
credits, administration and collection
Own tax
Gaming Tax 100% YES Allowances,
taxable base, tax rates, administration,
collection and inspection
Own tax
Vehicles excise (at registration)
100% YES Tax rates Own tax
Hydrocarbons Retail Sale
Tax
100% YES Tax rates,
administration, collection and
inspection
Own tax
Value Added Tax (VAT)
35% NO NO Tax sharing
Alcoholic beverages, tobacco and petrol excise
duties
40% NO NO Tax sharing
Electricity Tax
100% NO NO Tax sharing
Source: López-Laborda and Monasterio (2007).
In addition, the Spanish regional governments are allowed to establish genuine
regional taxes and surcharges over which they have full powers of collection,
administration and regulation. However, there are strict limits to this power in order to
prevent the regions from trespassing on the terrain already occupied by other levels of
government. This limitation explains why there have been established so few regional
taxes in Spain, basically in the areas of environment and gaming, and with a very small
yield.
12 Finally, the grants received by the Spanish regional governments under the
“common” system are of two different types, general purpose equalisation grants and specific purpose grants, the latter are intended to reduce differences in income and wealth among regions mainly through public investment, as is the case of the revenues obtained from the European Regional Development Fund (ERDF). In year 2008 grants received by regional governments under the “common” system of funding represented 42.68 percent of their total non financial revenues (general grants accounted for 22.54 percent and specific grants for 20.14 percent), tax sharing revenues rose to 20.51 percent and own revenues represented the remaining 36.81 percent.
On the other hand, the “charter” financing system applies to Navarre and the
Basque Country. Unlike the “common” system, this system is not based on the
assignment of specific revenues to fund regional expenditure needs, but on the provision
of direct fiscal autonomy to the two regions concerned. Both regions have the capacity
to establish and regulate their own fiscal system provided that free movement of
persons, capital, goods and services is ensured. Their expenditure is financed
exclusively through what is called “agreed” taxes between the central and regional
governments, over which the recognised powers of the regions are considerably greater
than in the case of the “common” system. Table 3 details the taxes concerned using the
same structure as Table 2. The only taxes currently outside of the “charter” system are
import duties and payroll taxes. As can be seen in Table 3, the two regions under this
system of funding have full powers over all personal and corporate income taxes and
also have an extensive control of the VAT and other excise duties, but without
regulatory powers, in this case due to the restrictions established by European rules
governing the harmonisation of indirect taxes. The regulatory powers over personal and
corporate income taxes have been widely used by the two regional governments,
generally to reduce the tax burden. That is to say, in these regions, tax rates in general
are lower than in the regions under the “common” system of funding resulting in a
problem of asymmetric tax competition.
13
Table 3. Taxes assigned to the regional level under the “charter” financing systemTAX SHARING OF
COLLECTION
ADMINISTRATION BY REGIONAL GOVERNMENT
REGULATION BY REGIONAL GOVERNMENT
CLASSIFICATION
Personal Income Tax
100% YES Complete Own tax
Tax on Net Wealth
100% YES Complete Own tax
Inheritance and Gift Tax
100% YES Complete Own tax
Corporate Income Tax
100% YES Complete Own tax
Non-Resident Tax
100% YES Complete (for
permanent establishments)
Own tax
Capital Transfer Tax,
Tax on the Raising of Capital, and Stamp Duties
100% YES Complete (with
some exceptions)
Own tax
Gaming Tax 100% YES Complete (with
some exceptions)
Own tax
Vehicles excise (at registration)
100% YES Tax rates,
declaration and payment form and
periods
Own tax
Hydrocarbons Retail Sale
Tax
100% YES Tax rates,
declaration and payment form and
periods
Own tax
Value Added Tax (VAT)
100% YES Tax declaration
and payment form and periods
Tax sharing
Alcoholic beverages, tobacco and petrol excise
duties
100% YES Tax declaration
and payment form and periods
Tax sharing
Electricity Tax
100% YES Tax declaration
and payment form and periods
Tax sharing
Carbon Tax 100% YES Tax declaration
and payment form and periods
Tax sharing
Tax on Insurance Premiums
100% YES Tax declaration
and payment form and periods
Tax sharing
Source: López-Laborda and Monasterio (2007).
Thanks to their favourable system of funding and high levels of income, see
Table 1, the Basque Country and Navarre do not require additional grants to finance
their expenditures. In fact, these two regional governments, due to their full powers over
most of the taxes, have to negotiate with the central government a single payment
14 transfer as a contribution of the cost of providing federal services. Therefore, the degree of fiscal autonomy provided by the “charter” financing system is quite unique in the international experience and even greater than that existing in the world´s most fiscally decentralised countries such as the United States, Switzerland or Canada.
3. REVENUE AUTONOMY OF THE SPANISH REGIONAL GOVERNMENTS: INDICATORS
Considering the characteristics of the process of fiscal decentralisation experienced in Spain in the last 25 years described in the previous section, we propose a set of revenue autonomy indicators for the Spanish regional governments, on the basis of accrual revenue of such governments and according to the economic classification of Spanish public accounts. The economic classification of Spanish public accounts establishes seven different types of government non-financial revenue: direct taxes (section 1), indirect taxes (section 2), administrative fees, user charges and other revenue (section 3), running expense grants (section 4), income from business operations and property (section 5), divestment of property investments (section 6) and capital grants (section 7).The proposed indicators are the following:
1. Low revenue autonomy indicator (LOW): revenues which the regional tier receives, at least, under the formula of participation (that is to say, grants are excluded) as a proportion of total recognised non-financial revenues. In the Spanish case, such revenues correspond to sections 1, 2, 3, 5 and 6. Thus, in order to construct this indicator, for all the regions, the totality of the revenues listed in those five sections must be considered from the beginning of the process of fiscal decentralisation.
2. Medium revenue autonomy indicator (MED): revenues over which the regional tier enjoys, at least, the power to determine the sum or level of such revenues
8, as a proportion of total regional non-financial revenues. Currently, in the case of Spanish regional governments, these revenues correspond to sections 3, 5 and 6 and part of sections 1 and 2. Nevertheless, should be
8 In the case of taxes and following from among many authors Bird (1993), the power to determine, at least, the tax rate.
15 taken into account that it was not until 1997 that regional governments under the “common” financing system acquired regulatory authority over direct transferred taxes (these were the Personal Income Tax, Tax on Net Wealth and Inheritance and Gift Tax) and some indirect transferred taxes (these were, mainly, the Capital Transfer Tax and Stamp Duties). However, Navarre and the Basque Country, which are under the “charter” system of funding, have possessed wide-ranging regulatory authority over the above- mentioned direct and indirect taxes since the beginning of the process of fiscal decentralisation. Thus, for the construction of this indicator, as far as the regions under the “common” financing system are concerned, sections 3, 5 and 6 must be included since the beginning of such process and, from 1997 onwards, so must all of section 1 and the Capital Transfer Tax and Stamp Duties of section 2. While for Navarre and the Basque Country, this same inclusion, referring to sections 1 and 2, must be performed from the beginning, together with sections 3, 5 and 6.
3. Full revenue autonomy indicator (FULL): revenues over which the regional governments may exercise their powers without restrictions, as a proportion of total regional non-financial revenues. Such revenues, in the case of Spanish regional governments, correspond to sections 3, 5 and 6.
These indicators will be our variables of interest in the analysis we shall
subsequently perform of the possible existence of a relationship between the process of
fiscal decentralisation and economic growth in the Spanish regions. They clearly reflect
the different degree of control which regional governments exert over their ‘own-
source’ and tax-shared revenue and, consequently, the basis of the majority of the
theoretical arguments which refer to the advantages produced by a process of fiscal
decentralisation, according to Rodden (2004). Table 4 summarizes how the proposed
indicators are constructed.
16
Table 4. Revenue autonomy of the Spanish regional governments: indicatorsREVENUE AUTONOMY
LOW MEDIUM FULL
DESCRIPTION
LOW: Revenues of the regions in sections 1, 2, 3, 5 and 6 as a proportion of total regional non-financial revenues, in accordance with the economic classification.
MED: Revenues of the regions in sections 3, 5 and 6 and in sections 1 and 2 (only Capital Transfer Tax and Stamp Duties), from 1997 onwards, for regions with the “common”
system of financing and for the complete period for those under the
“charter” system, as a proportion of total regional non-financial revenues, in accordance with the economic classification.
FULL: Revenues of the regions in sections 3, 5 and 6, as a proportion of total regional non- financial revenues, in accordance with the economic classification.
4. EMPIRICAL ANALYSIS: REVENUE AUTONOMY AND REGIONAL GROWTH IN SPAIN
In this section we will examine if there has been any relationship between fiscal decentralisation and economic growth in the Spanish regions during the last 25 years (1984-2008). To do this we will use the three different indicators of revenue autonomy presented in section 3, which overcome the problems associated with the measurement of fiscal decentralisation existing in some of the previous literature. Also, we will use a VAR approach, since we consider that the usual procedure of estimating a traditional growth equation where fiscal decentralisation is included in an ad-hoc manner might present severe problems regarding the correct specification of the equation and the possible existence of endogeneity. In addition, the sampling information is appropriate for a VAR analysis since presents a relatively low number of cross-section observations in relation to a relatively high number of time observations.
The indicators of revenue autonomy are constructed on the basis of the
information provided by the Subcentral Funding Statistics of the Spanish Treasury. The
rate of economic growth of the Spanish regions is constructed using the regional GDP,
at constant 2001 prices, provided by the Regional Accounts of the Spanish Statistics
Office which are in accordance with the methodology established in the European
17 System of National and Regional Accounts (ESA-1995). It is clear from Table 1 and Figure 1 that the sampling units of the analysis, the Spanish regions, are very different both in size and shape. Regarding the possible existence of spatial dependence among the units of analysis we shall perform a preliminary visual analysis in addition to the subsequent statistical analysis. This visual analysis is carried out in Figure 2, where Figures 2a to 2c present the variation of each of the three revenue autonomy indicators between years 1984 and 2008 and Figure 2d presents the variation of regional GDP for the same period. The median variation is in the second quantile and low and high variations correspond to the first and the third quantile respectively. The main result of this preliminary analysis is the possible existence of a spatial pattern.
Figure 2. Variation of revenue autonomy indicators and regional GDP (1984- 2008). Quantiles distribution
Figure 2a: Low revenue autonomy Figure 2b: Medium revenue autonomy
Figure 2c: Full revenue autonomy Figure 2d: Regional GDP
According to section 3, revenue autonomy indicators are constructed as a
proportion of total non-financial revenues of the region in a 0-100 scale. These are
18 binomial, B (n, p), variables with parameters n=100 and p equal to the level of revenue autonomy. However, the variation of regional GDP is unrestricted. This imbalance might affect the analysis of the relationship between the two variables. In order to avoid potential problems resulting from this situation, we use the following logistic transformation for the three revenue autonomy indicators:
* ln x / (100 x x x(100 x)
(1)
where x refers to the indicator and x* is the transformed one. This is a monotonous transformation which preserves all the existing information regarding the original indicator and which helps to solve the imbalance between the two variables.
Table 5 shows the results of a series of unit root tests with regard to the first differences of the variables, the three indicators of revenue autonomy and the regional GDP, that all of them seem to be stationary
9. The LLC,
t, W
tbar, P
MWand Z
statistics belong to the so-called ‘first generation’ panel unit root test in the sense that they assume independence among the individuals. If the hypothesis of independence is not fulfilled, this type of tests may be very unstable, O’Connel (1998). The ‘second generation’ tests, like the CADF, Z
c, and the S
Ntests are robust to cross-sectional dependence. In general, all these tests are quite different in construction, foundation and scope. Among them the null hypothesis is different, LLC and t
statistics test for a unit root process common to all individuals in the sample, on the contrary, Hadri’s Z
statistic tests for stationarity in the whole sample, the other tests allow for individual unit root processes.
9 The variables in levels are non-stationary, we do not include these results for the sake of brevity.
19
Table 5. Unit root testsINTEGRATION TEST GDP LOW* MED* FULL*
LLC
Null: Common unit root process
0.1034
(
0.5412)0.7993
(
0.2120)-7.1227
(
0.0023)-5.6758
(
0.0000) tNull: Common unit root process
-5.0640
(
0.0000)-5.4088
(
0.0000)-6.2378
(
0.0002)-3.1594
(
0.0008)Wtbar
Null: Individual unit root process
-3.7837
(
0.0001)-9.8702
(
0.0000)-10.4700
(
0.0000)-10.610
(
0.0000)PMW
Null: Individual unit root process
64.4848
(
0.0012)158.384
(
0.0000)169.557
(
0.0000)172.251
(
0.0000)Z
Null: Common no unit root process
0.1338
(
0.4468)2.95874
(
0.0015)0.8109
(
0.2087)5.0572
(
0.0000)CADF (robust to cross-dependence) Null: Individual unit root process
3.4467
(
0.0000)-3.3033
(
0.0000)-3.5641
(
0.0000)-3.8894
(
0.0000)Zc(robust to cross-dependence) Null: Individual unit root process
1.5502
(
0.0755)5.5513
(
0.0000)4.0578
(
0.0000)3.4062
(
0.0000)SN(robust to cross-dependence) Null: Individual unit root process
-7.3356
(
0.0000)-14.8717
(
0.0000)-15.0338
(
0.0000)-15.3339
(
0.0000)Notes: LLC: Levin, Lin and Chu (2002) statistic;
t: Breitung and Meyer (1994) statistic; W
tbar: Im, Pesaran and Shin (2003) statistic; P
MW: Maddala and Wu’s (1999) statistic; Z
: Hadri’s (2000) statistic; CADF: Pesaran (2003) CADF statistic; Z
c: Bai and Ng (2004) factor common statistic; S
N: Chang (2002) test. In all the cases, the assumed data generating process contains a constant; p-value in parenthesis.
The results of the tests are not uniform. They present minor contradictions that maybe caused by the heterogeneity of the tests considered and intrinsic limitations to the sampling information. Nevertheless, the results clearly point to the assumption that the annual variation of the indicators of revenue autonomy (LOW*,
MED* andFULL*) and the annual growth of GDP (GDP) are stationary.
Furthermore, Table 5 shows no differences between ‘first’ and ‘second
generation’ tests results, a clear symptom of the weakness of the existing spatial effects
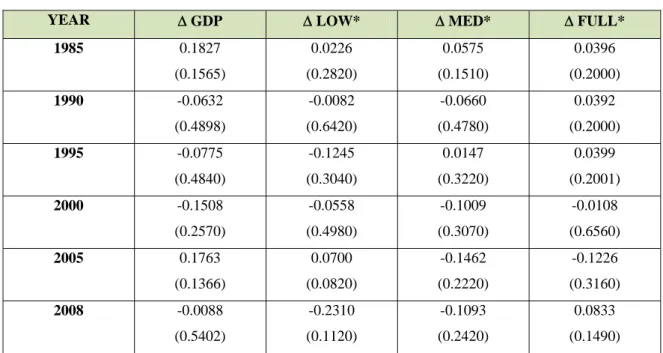
in the sample. In addition, we have performed the Moran’s I test of spatial dependence,
see Cliff and Ord (1981), for the variation of the three indicators of revenue autonomy
20 and regional GDP growth. The results of this test for a set of representative years of the time period covered are presented in Table 6 and point out that cross-sectional dependence is not significant in spite of the appearance of the maps in Figure 2, where spatial regularities seem to emerge. This contradiction between the visual and the statistical analysis is probably due to the small number of cross-sectional observations in addition to the fact that regional data result from considerable aggregation which produces similar final data.
Table 6. Spatial dependence measures (Moran’s I)
YEAR GDP LOW* MED* FULL*
1985 0.1827
(0.1565)
0.0226 (0.2820)
0.0575 (0.1510)
0.0396 (0.2000)
1990 -0.0632
(0.4898)
-0.0082 (0.6420)
-0.0660 (0.4780)
0.0392 (0.2000)
1995 -0.0775
(0.4840)
-0.1245 (0.3040)
0.0147 (0.3220)
0.0399 (0.2001)
2000 -0.1508
(0.2570)
-0.0558 (0.4980)
-0.1009 (0.3070)
-0.0108 (0.6560)
2005 0.1763
(0.1366)
0.0700 (0.0820)
-0.1462 (0.2220)
-0.1226 (0.3160)
2008 -0.0088
(0.5402)
-0.2310 (0.1120)
-0.1093 (0.2420)
0.0833 (0.1490)
Notes: A first order row-standardized contiguity matrix has been used; randomized p- value after 999 bootstraps in parenthesis.
Table 7 shows the results of the tests of homogeneity of the means performed to determine the possible existence of a panel structure in the data. We can see that, in spite of the apparent heterogeneity of the spatial units, as shown in Table 1, the impact of the individual unobserved effects on the final data is not significant
10. This absence of a panel structure in the data might be again a result of the considerable level of aggregation existing in regional data.
10 Wilks’ lambda tests for differences between the means of groups of individuals on a variable. It takes values between 0 and 1, values close to zero indicate that the means are very different and the opposite in the case of values near to one.
21
Table 7. Impact of the individual effects: tests of homogeneity of the meansGDP LOW* MED* FULL*
TSS 3061.17 1122.16 2004.11 2183.17
BSS 132.66 25.26 32.03 38.55
WSS 2928.51 1096.90 1972.08 2144.62
LR 8.1763
(0.9434)
4.0344 (0.9988)
2.8551 (0.9999)
3.1571 (0.9998)
Wilks’ lambda 0.9617 (0.4867)
0.9999 (0.9988)
0.9939 (0.9999)
0.9823 (0.9715)
Notes: TSS: Total Sum of Squares; BSS: Between Sum of Squares; WSS: Within Sum of Squares. LR: LR statistic; p-value in parenthesis.
The situation of stationarity, no correlation and homogeneity among the individuals allows us to specify formal Granger causality tests in the usual way. The results of this test are presented in Table 8. As we can see, there is a bidirectional causality relationship between low revenue autonomy and regional GDP growth and a unidirectional causality between the other two indicators of revenue autonomy and regional GDP growth. That is, medium and full revenue autonomy have an effect on the growth of the regional economy but it cannot be rejected the opposite null hypothesis that regional growth does not cause medium and full revenue autonomy.
Table 8. Granger causality test
HYPOTHESIS OF CAUSALITY F STATISTIC P-VALUE
LOW* does not Granger cause GDP 4.1128 0.0426
GDP does not Granger cause LOW* 6.2279 0.0126
MED* does not Granger cause GDP 21.0031 0.0000
GDP does not Granger cause MED* 1.7508 0.4167
FULL* does not Granger cause GDP 12.2934 0.0021
GDP does not Granger cause FULL* 0.3726 0.8300
The causality tests result from the estimated VAR equations shown in Table 9.
The lag length criteria selects a VAR (1) model in the case of low revenue autonomy
and a VAR (2) model in the case of the other two indicators. A simple deterministic
structure made of a constant term and a linear trend, common to all regions, has been
considered in all the models together with a set of dummy variables. The latter have
been included to moderate the impact of a series of outliers present in the data. There
are not problems of heteroskedasticity nor of serial correlation in the estimated models
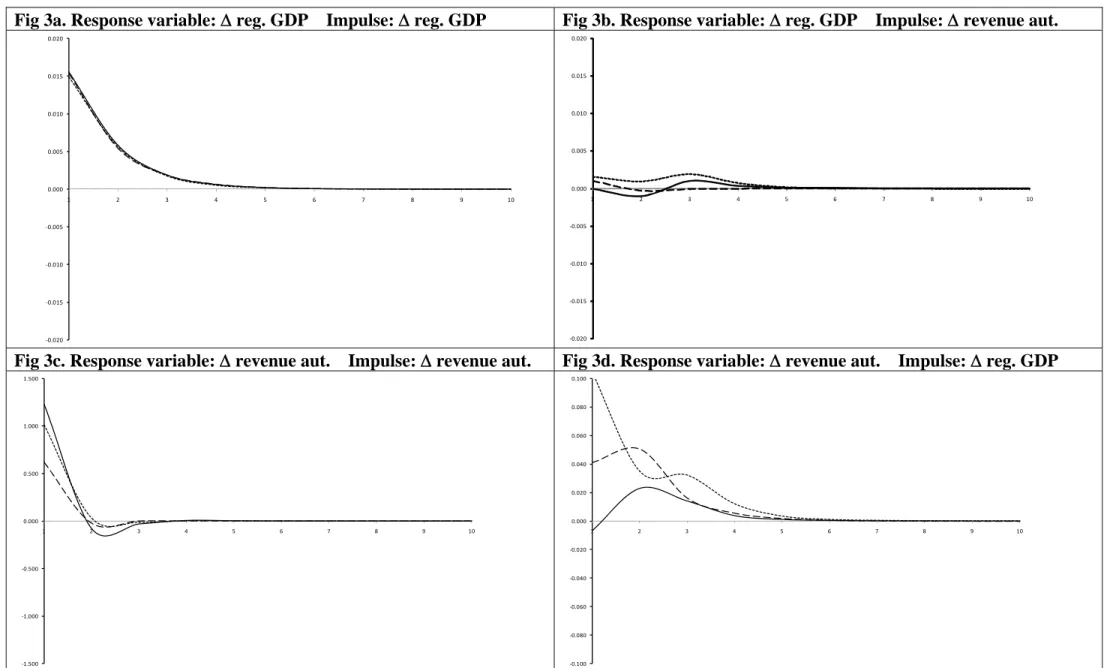
22 and the adjustment is reasonably good. In addition, Figure 3 shows the impulse- response functions of the estimated VAR models, following the Pesaran and Shin (1998) approach. As can be seen, the impact of changes of revenue autonomy on regional growth is small but still present four years after the consideration of a shock in the indicator (Figure 3b). With regard to the response of revenue autonomy to a shock in regional GDP, this is more elastic and maintains activity even six years after the impulse (Figure 3d). In the latter case, the impacts are positive and the time sequence is depressing in general terms, although with different profiles according to the indicator.
In the case of the LOW and FULL indicators exists a time lag of 2 years between the regional GDP shock and the point of maximum incidence, while in the case of the MED indicator that time lag is only of 1 year
11.
Table 9. Estimated VAR models
GDP LOW* GDP MED* GDP FULL*
GDP(-1) 0.3965 3.2184 GDP(-1) 0.4031 2.2006 GDP(-1) 0.4121 3.0957 t-ratio (12.439) (2.496) t-ratio (11.433) (0.911) t-ratio (11.377) (1.070)
GDP(-2) -0.0092 0.7152 GDP(-2) -0.0041 -0.0017 t-ratio (-0.276) (0.312) t-ratio (-0.120) (-0.001)
LOW*(-1) -0.0001 -0.0452 MED*(-1) 0.0008 0.0285 FULL*(-1) -0.0001 -0.0677 t-ratio (-2.028) (-2.427) t-ratio (1.706) (0.915) t-ratio (-1.315) (-1.830)
MED*(-2) 0.0016 -0.0169 FULL*(-2) 0.0014 -0.0296 t-ratio (4.674) (0.726) t-ratio (2.797) (-1.023) constant 0.0241 -0.3187 constant -0.0853 -45.25 constant 0.0219 -0.2782 t-ratio (11.349) (-3.701) t-ratio (-0.346) (-2.685) t-ratio (9.147) (-1.449) time trend -0.0003 0.0142 time trend 0.0001 0.0225 time trend 0.0002 -0.0299 t-ratio (-0.221) (2.918) t-ratio (0.436) (2.676) t-ratio (0.211) (-2.787)
ˆ
0.0153 0.6169 ˆ
0.0147 1.0101 ˆ
0.0153 1.2277R2 0.6211 0.5628 R2 0.6291 0.6324 R2 0.5973 0.4737
LM (p=2) pvalue
8.756 (0.067)
LM (p=3) pvalue
4.7526 (0.3136)
LM (p=3) pvalue
8.8755 (0.064) White
pvalue
36.212 (0.111)
White pvalue
54.604 (0.131)
White pvalue
48.232 (0.306)
Notes: LM: Lagrange Multiplier test for residual serial correlation up to the specified order (Johansen, 1995); White: White test of no heteroskedasticity (Davidson, 2000).
These results point out that revenue autonomy may have had a slightly positive effect on regional growth throughout the 25 years of fiscal decentralisation in Spain. As can be seen in Table 9, medium and full revenue autonomy indicators, which refer to
11It should be taken into account that when analyzing the impulse-response functions of the estimated VAR models the significance of the relationship between the variables is not considered.
23 those revenue sources over which regional governments exert regulatory powers, present significant and positive coefficients with regard to their effect on regional GDP, particularly after two periods. On the contrary, the low revenue autonomy indicator which refer to all revenue sources that regional governments have, with the exception of grants from the central government, presents a very low, significant and negative coefficient. Since the latter indicator collects, at the same time, revenue sources over which regional governments have, and do not have, regulatory powers is not possible to conclude a clear statement from its coefficient with regard to the impact of revenue autonomy on regional growth. On the other hand, the low revenue autonomy indicator is clearly and positively determined by the rate of regional growth. This result shows that regional economic growth stimulates the relative volume of decentralised regional revenue sources, fact that can be explained because regional economic activity makes these sources growing faster than grants coming from the central government. In addition, from table 8 and 9 can be concluded that the effect of regional economic growth on the medium and high revenue autonomy indicators is not relevant indicating that the evolution of revenue sources over which regional governments have regulatory powers is mainly determined by political decisions.
Finally, two additional comments have to be made with regard to these results.
First, the estimated coefficients for the effect of revenue autonomy on regional
economic growth are so low probably due to the fact that regional governments have
not made an extensive use of their regulatory powers so far. Spanish regional
governments have not had a clear willingness to use their discretion over their revenue
sources and on doing so to turn revenue sharing into own taxes. In fact, they have opted
to a greater extent to bargain with the central government for a higher sharing level of
the ceded taxes than to change the tax rates when additional revenue needs have
emerged. This behaviour has affected regional government efficiency, transparency and
accountability. Consequently, only if there are appropriate incentives for an accountable
fiscal behaviour of Spanish regional governments, an effective progress in the level of
their revenue autonomy, that is less grants and tax sharing and more regulatory powers
and own taxes, will clearly have the expected effects according to the theory. Second,
we should take into account that along the period analysed, 1984-2008, the Spanish
economy experienced high growth rates and a process of increasing fiscal effort directed
to converge with other developed countries, which allowed an increasing provision of
24 public goods and services to the population and the development of the different levels of Spanish government. The extension to which this expansion scenario conditions the results obtained in this paper will be determined once data for following years under a situation of economic crisis will be available.
5. CONCLUSIONS
In this paper we have analysed the relationship between revenue autonomy of Spanish regional governments and regional growth along the process of fiscal decentralisation experienced in Spain from 1984 to 2008. This analysis is part of a broader line of research which studies the relationship between fiscal decentralisation and economic growth and which has not been conclusive about the existence and the sign of the relationship so far. A group of three indicators of revenue autonomy for the specific case of fiscal decentralisation in Spain has been proposed in order to overcome possible measurement problems existing in previous analyses, and a VAR approach is used to estimate the relationship between the two variables. This methodology is unusual among previous papers although it seems to be more appropriate since avoids some severe problems generally associated to the most common approach of estimating a growth equation.
The results presented in the previous section show that our data are stationary,
do not present spatial dependence, and are homogeneous among the individuals, and,
when a Granger causality test is done, point out to a slightly positive effect of revenue
autonomy of Spanish regional governments on regional growth. Also may be deduced
from our analysis that progress on revenue autonomy of Spanish regional governments
has not been caused by regional economic growth but mainly determined by political
decisions.
25 Figure 3. Impulse-Response functions. Pesaran and Shin (1998) approach
Fig 3a. Response variable: reg. GDP Impulse: reg. GDP Fig 3b. Response variable: reg. GDP Impulse: revenue aut.
‐0.020
‐0.015
‐0.010
‐0.005 0.000 0.005 0.010 0.015 0.020
1 2 3 4 5 6 7 8 9 10
‐0.020
‐0.015
‐0.010
‐0.005 0.000 0.005 0.010 0.015 0.020
1 2 3 4 5 6 7 8 9 10
Fig 3c. Response variable: revenue aut. Impulse: revenue aut. Fig 3d. Response variable: revenue aut. Impulse: reg. GDP
‐1.500
‐1.000
‐0.500 0.000 0.500 1.000 1.500
1 2 3 4 5 6 7 8 9 10
‐0.100
‐0.080
‐0.060
‐0.040
‐0.020 0.000 0.020 0.040 0.060 0.080 0.100
1 2 3 4 5 6 7 8 9 10
: Estimated in the equations of LOW*; : Estimated in the equations of MED*; : Estimated in the equations of FULL*;
26
REFERENCESAkai N, Sakata M, 2002, “Fiscal decentralization contributes to economic growth: evidence from state-level cross-section data for the United States” Journal of Urban Economics 52 93-108
Bahl R, Linn J, 1992 Urban Public Finance in Developing Countries (Oxford University Press, Oxford) Bai J, Ng S, 2004, “A PANIC attack on unit roots and cointegration” Econometrica 72 1127-1178
Bird R, 1993, “Threading the fiscal labyrinth: some issues in fiscal decentralization” National Tax Journal
46 207-227Breitung J, Meyer W, 1994, “Testing for unit roots in panel data: are wages on different bargaining levels cointegrated?” Applied Economics 26 353-361
Brennan G, Buchanan J, 1980 The Power to Tax: Analytical Foundations of a Fiscal Constitution (Cambridge University Press, Cambridge)
Brueckner J, 2006, “Fiscal federalism and economic growth” Journal of Public Economics 90 2107-2120 Chang Y, 2002, “Nonlinear IV unit root tests in panels with cross-sectional dependency” Journal of Econometrics 110 261-292
Cliff D, Ord A, 1981 Spatial Processes. Methods and Applications (Pion, London) Davidson J, 2000 Econometric Theory (Blackwell, Oxford)
Davoodi H, Zou H, 1998, “Fiscal decentralization and economic growth: a cross-country study” Journal of Urban Economics 43 244-257
Desai R, Freinkman L, Goldberg I, 2003, “Fiscal federalism and regional growth, evidence from the Russian Federation in the 1990s” World Bank Policy Research Working Paper 3138, The World Bank, 1818 H Street NW, Washington, DC
Ebel R, Yilmaz S, 2002, “On the measurement and impact of fiscal decentralization” World Bank Policy Research Working Paper 2809, The World Bank, 1818 H Street NW, Washington, DC
Fukasaku K, de Mello L, 1998 “Fiscal decentralisation and macroeconomic stability: the experience of large developing and transition countries”, in Democracy, Decentralization and Deficit in Latin America Eds K Fukasaku, R Hausmann (OECD, Paris)
Gil-Serrate R, López-Laborda J, 2009, “Tax decentralisation, the flypaper effect, and growth” Urban Public Economics Review 10 52-71
Gong L, Zou H, 2003, “Fiscal federalism, public capital formation and endogenous growth” Annals of Economics and Finance 4 471-490
Hadri K, 2000, “Testing for unit roots in heterogeneous panel data” Econometrics Journal 3 148-161
Harris R, Tzavalis E, 1999, “Inference for unit roots in dynamic panels where the time dimension is fixed”
Journal of Econometrics 91 201-226
27 Iimi A, 2005, “Decentralization and economic growth revisited: an empirical note” Journal of Urban Economics 57 449-461
Im K, Pesaran H, Shin Y, 2003, “Testing for unit roots in heterogeneous panels” Journal of Econometrics
115 53-74Johansen S, 1995 Likelihood Based Inference in Cointegrated Vector Autoregressive Models (Oxford University Press, Oxford)
Letelier L, 2005, “Explaining fiscal decentralization” Public Finance Review 33 155-183
Levin A, Lin C, Chu C, 2002, “Unit root test in panel data: asymptotic and finite sample properties” Journal of Econometrics 108 1-24
Lin J, Liu Z, 2000, “Fiscal decentralization and economic growth in China” Economic Development and Cultural Change 49 1–22
López-Laborda J, Monasterio C, 2007, “Regional governments: vertical imbalances and revenue assignments”, in Fiscal Reform in Spain. Accomplishments and Challenges Eds J Martínez-Vázquez, J Sanz- Sanz (Edward Elgar, Cheltenham)
Maddala G, Wu S, 1999, “A comparative study of unit root tests with panel data and a new simple test”
Oxford Bulletin of Economics and Statistics 61 631-652
Meloche J, Vaillancourt F, Yilmaz S, 2004, “Decentralization or fiscal autonomy? What does really matter?
Effects on growth and public sector size in European transition countries” World Bank Policy Research Working Paper 3254, The World Bank, 1818 H Street NW, Washington, DC
Musgrave R, 1959 The Theory of Public Finance (McGraw-Hill, Nueva York) Oates W, 1972 Fiscal Federalism (Harcourt Brace Jovanovich, Nueva York)
Oates W, 1993, “Fiscal decentralization and economic development” National Tax Journal 46 237-243 O’Connell P, 1998, “The overvaluation of purchasing power parity” Journal of International Economics 44 1-19
Panizza U, 1999, “On the determinants of fiscal centralization: theory and evidence” Journal of Public Economics 74 97-139
Pesaran H, 2003, “A simple panel unit root test in the presence of cross section dependence”, mimeo, University of Southern California, Los Angeles
Pesaran H, Shin M, 1998, “Impulse response analysis in linear multivariate models” Economics Letters 58 17-29
Rodden J, 2004, “Comparative federalism and decentralization. On meaning and measurement”
Comparative Politics 36 481-500
Rodríguez-Pose A, Krøijer A, 2009, “Fiscal decentralization and economic growth in Central and Eastern
Europe” Growth and Change 40 387–417
28 Stegarescu D, 2005, “Public sector decentralization: measurement concepts and recent international trends”
Fiscal Studies 26 301-333
Stigler G, 1957, “The tenable range of functions of local government”, in Federal expenditure policy for economic growth and stability, Joint Economic Committee, Subcommittee on Fiscal Policy, Washington, DC, 213-219
Thiessen U, 2003, “Fiscal decentralisation and economic growth in high-income OCDE countries” Fiscal Studies 24 237-274
Thornton J, 2007, “Fiscal decentralization and economic growth reconsidered” Journal of Urban Economics
61 64-70Tiebout C, 1956, “A pure theory of local expenditures” Journal of Political Economy 64 416-424
Woller G, Phillips K, 1998, “Fiscal decentralization and LDC economic growth: an empirical investigation”
Journal of Development Studies 34 139-148
Xie D, Zou H, Davoodi H, 1999, “Fiscal decentralization and economic growth in the United States”
Journal of Urban Economics 45 228-239
Yilmaz S, 2000, “The impact of fiscal decentralization on macroeconomic performance”, in Proccedings of the 92
ndAnnual Conference on Taxation, The National Tax Association, 251-260
Zhang T, Zou H, 1998, “Fiscal decentralization, public spending and economic growth in China” Journal of Public Economics 67 221-240
Zhang T, Zou H, 2001, “The growth impact of intersectoral and intergovernmental allocation of public
expenditure: with applications to China and India” China Economic Review 12 58-81
F
UNDACIÓN DE LASC
AJAS DEA
HORROS DOCUMENTOS DE TRABAJOÚltimos números publicados
159/2000 Participación privada en la construcción y explotación de carreteras de peaje Ginés de Rus, Manuel Romero y Lourdes Trujillo
160/2000 Errores y posibles soluciones en la aplicación del Value at Risk Mariano González Sánchez
161/2000 Tax neutrality on saving assets. The spahish case before and after the tax reform Cristina Ruza y de Paz-Curbera
162/2000 Private rates of return to human capital in Spain: new evidence F. Barceinas, J. Oliver-Alonso, J.L. Raymond y J.L. Roig-Sabaté 163/2000 El control interno del riesgo. Una propuesta de sistema de límites
riesgo neutral
Mariano González Sánchez
164/2001 La evolución de las políticas de gasto de las Administraciones Públicas en los años 90 Alfonso Utrilla de la Hoz y Carmen Pérez Esparrells
165/2001 Bank cost efficiency and output specification Emili Tortosa-Ausina
166/2001 Recent trends in Spanish income distribution: A robust picture of falling income inequality Josep Oliver-Alonso, Xavier Ramos y José Luis Raymond-Bara
167/2001 Efectos redistributivos y sobre el bienestar social del tratamiento de las cargas familiares en el nuevo IRPF
Nuria Badenes Plá, Julio López Laborda, Jorge Onrubia Fernández
168/2001 The Effects of Bank Debt on Financial Structure of Small and Medium Firms in some Euro- pean Countries
Mónica Melle-Hernández
169/2001 La política de cohesión de la UE ampliada: la perspectiva de España Ismael Sanz Labrador
170/2002 Riesgo de liquidez de Mercado Mariano González Sánchez
171/2002 Los costes de administración para el afiliado en los sistemas de pensiones basados en cuentas de capitalización individual: medida y comparación internacional.
José Enrique Devesa Carpio, Rosa Rodríguez Barrera, Carlos Vidal Meliá
172/2002 La encuesta continua de presupuestos familiares (1985-1996): descripción, representatividad y propuestas de metodología para la explotación de la información de los ingresos y el gasto.
Llorenc Pou, Joaquín Alegre
173/2002 Modelos paramétricos y no paramétricos en problemas de concesión de tarjetas de credito.
Rosa Puertas, María Bonilla, Ignacio Olmeda
174/2002 Mercado único, comercio intra-industrial y costes de ajuste en las manufacturas españolas.
José Vicente Blanes Cristóbal
175/2003 La Administración tributaria en España. Un análisis de la gestión a través de los ingresos y de los gastos.
Juan de Dios Jiménez Aguilera, Pedro Enrique Barrilao González 176/2003 The Falling Share of Cash Payments in Spain.
Santiago Carbó Valverde, Rafael López del Paso, David B. Humphrey Publicado en “Moneda y Crédito” nº 217, pags. 167-189.
177/2003 Effects of ATMs and Electronic Payments on Banking Costs: The Spanish Case.
Santiago Carbó Valverde, Rafael López del Paso, David B. Humphrey
178/2003 Factors explaining the interest margin in the banking sectors of the European Union.
Joaquín Maudos y Juan Fernández Guevara
179/2003 Los planes de stock options para directivos y consejeros y su valoración por el mercado de valores en España.
Mónica Melle Hernández
180/2003 Ownership and Performance in Europe and US Banking – A comparison of Commercial, Co- operative & Savings Banks.
Yener Altunbas, Santiago Carbó y Phil Molyneux
181/2003 The Euro effect on the integration of the European stock markets.
Mónica Melle Hernández
182/2004 In search of complementarity in the innovation strategy: international R&D and external knowledge acquisition.
Bruno Cassiman, Reinhilde Veugelers
183/2004 Fijación de precios en el sector público: una aplicación para el servicio municipal de sumi- nistro de agua.
Mª Ángeles García Valiñas
184/2004 Estimación de la economía sumergida es España: un modelo estructural de variables latentes.
Ángel Alañón Pardo, Miguel Gómez de Antonio
185/2004 Causas políticas y consecuencias sociales de la corrupción.
Joan Oriol Prats Cabrera
186/2004 Loan bankers’ decisions and sensitivity to the audit report using the belief revision model.
Andrés Guiral Contreras and José A. Gonzalo Angulo
187/2004 El modelo de Black, Derman y Toy en la práctica. Aplicación al mercado español.
Marta Tolentino García-Abadillo y Antonio Díaz Pérez 188/2004 Does market competition make banks perform well?.
Mónica Melle
189/2004 Efficiency differences among banks: external, technical, internal, and managerial Santiago Carbó Valverde, David B. Humphrey y Rafael López del Paso
190/2004 Una aproximación al análisis de los costes de la esquizofrenia en españa: los modelos jerár- quicos bayesianos
F. J. Vázquez-Polo, M. A. Negrín, J. M. Cavasés, E. Sánchez y grupo RIRAG 191/2004 Environmental proactivity and business performance: an empirical analysis
Javier González-Benito y Óscar González-Benito
192/2004 Economic risk to beneficiaries in notional defined contribution accounts (NDCs) Carlos Vidal-Meliá, Inmaculada Domínguez-Fabian y José Enrique Devesa-Carpio
193/2004 Sources of efficiency gains in port reform: non parametric malmquist decomposition tfp in- dex for Mexico
Antonio Estache, Beatriz Tovar de la Fé y Lourdes Trujillo 194/2004 Persistencia de resultados en los fondos de inversión españoles
Alfredo Ciriaco Fernández y Rafael Santamaría Aquilué
195/2005 El modelo de revisión de creencias como apro