AN ANALYTICAL REGIONS PROPOSAL FOR THE STUDY OF LABOUR MARKETS:
AN EVALUATION FOR THE SPANISH TERRITORY
ANA VIÑUELA JIMÉNEZ FERNANDO RUBIERA MOROLLÓN
FUNDACIÓN DE LAS CAJAS DE AHORROS DOCUMENTO DE TRABAJO
Nº 582/2011
De conformidad con la base quinta de la convocatoria del Programa de Estímulo a la Investigación, este trabajo ha sido sometido a eva- luación externa anónima de especialistas cualificados a fin de con- trastar su nivel técnico.
ISSN: 1988-8767
La serie DOCUMENTOS DE TRABAJOincluye avances y resultados de investigaciones dentro de los pro- gramas de la Fundación de las Cajas de Ahorros.
Las opiniones son responsabilidad de los autores.
An Analytical Regions Proposal for the Study of Labour Markets: An Evaluation for the Spanish
Territory
Ana Viñuela Jiménez
(*)Fernando Rubiera Morollón
(*)Abstract :
Internal homogeneity and also heterogeneity between the regions are both desirable properties for a better understanding of the local labor markets and for increasing the efficiency of any industrial policy applied at local level.
However, studies of the labor markets that include a spatial dimension are commonly limited to administrative rather than appropriately-defined functional regions. Using micro data from the latest Census available, the Spanish territory can be divided into functional regions that emphasize the importance of location and agglomeration economies (size). The objective of this paper is to prove that, when studying labor economic issues, such classification based on economic criteria results on more convenient regions than the administrative ones commonly used (NUTS regions). Based on this simple idea, the results from this study suggest that, subject to the availability of data, this alternative spatial division should be considered when carrying out labor economics studies at a sub-national level.
Keywords:
regions, urban and regional economy; cluster validation, local employment and Spain.
JEL Classification:
R23 and R12.
Corresponding author: Ana Viñuela, Applied Economics Deparment, Faculty of Economy and Business, University of Oviedo, Oviedo (33006), Spain. E-mail:
(*) Applied Economics Department, Faculty of Economy and Business, University of Oviedo.
1. Introduction.
Economic data is usually spatially disaggregated according to the administrative or normative division of the territory. Unless having access to the original micro databases, it implies that any spatial analysis will be limited to the use of those administrative regions. However, such regions do not necessarily make economic sense as they are or were constructed in terms of some sort of political, administrative or historical criteria.
Using normative regions is the common practise, but in many cases statistical inference based on this division may be strongly affected by aggregation problems such as the ecological fallacy (Robinson, 1959)
1or the modifiable areal unit problem (Openshaw 1984)
2. In other words, the area or region created is not necessarily homogeneous, which is also referred to as aggregation bias in the literature
3.
Overall, instead of considering alternative spatial divisions, regional scientists have been devoted to formulating statistical models or estimation procedures to reduce the aggregation bias
4. If having access to micro databases, researchers can carry out their own regionalization procedure in order to create analytical or functional areas that are conveniently related to the phenomena under examination optimizing a particular aggregation criterion
5.
In case of dealing with labour market issues, internal homogeneity and also heterogeneity between the regions created would be both desirable properties for a better understanding of the local labor markets (Fischer, 1980) as well as for increasing the efficiency of any industrial policy applied at local level (Coombes et al. 1986). Nonetheless, the existence of agglomeration economies should not either be forgotten. As well as they determine location decisions and specialization patterns for companies, they should also explain the same for workers.
1EF was first introduced by Robinson (1950) and has been studied by many other authors since then. See, for example, Richardson et al. (1987), Piantadosi et al. (1988), Greenland and Morganstern (1989) and Richardson (1992).
2See also Openshaw and Taylor (1981) and Arbia (1989).
3 See Fotheringham and Wong (1991), Amrhein and Flowerdew (1992), Paelink and Klaassen (1979) or Paelink (2000).
4Gotway and Young (2002) provide a detailed overview of several statistical solutions that have been proposed to deal with this problem.
5See Duque et al. (2007) for a review of supervised regionalization methods.
The purpose of this study is not carry out a regionalization exercise to generate internally homogeneous or well differentiated labour markets according to one or several variables, but to prove that a functional classification based on the existence of agglomeration economies and the importance of location results on more convenient regions for the study of labour markets issues than the administrative ones commonly used (NUTS regions). Evenmore, this economic criterion not only creates compact and well differentiated labour markets, but also allows the segmentation of the whole territory
6.
The rest of the paper is organized as follows: in the next section we discuss the meaning of regions and describe the aggregation criteria used for creating regions with economic sense based on agglomeration economies and the importance of location. Applied to the Spanish case using data for the latest Census available, Section 3 deals with the evaluation of these functional regions versus the administrative ones commonly used for studying the spatial dimension of the labour markets. Internal homogeneity within the regions and heterogeneity between them when dealing with the distribution patterns of employment are evaluated by gender, industry and level of qualification. In the light of the results of such evaluation, in the last section we summarize the main conclusions of this study.
2. Surpassing the administrative regions: an analytical proposal for the analysis of the labour markets in Spain.
What is region? From an economic point of view, a region is a unit in which capital and labour move freely and goods and services are totally open to trade with other regions without any frontiers or limitations
7. The openness and the interaction with other regions are their main characteristics.
From this basic idea, a particular territory can be divided into parts or regions using different criteria. However, three elements must be taken into account (Behrens and Thisse, 2007). First, a Region is part of a set in which each comprising element has some specificities which make it different from the rest.
6 To date, in Spain no exercise to identify well defined functional regions to study labour market issues has been carried out. There are either studies focused on exclusively one administrative region (Comunidad Valenciana in Casado-Diaz, 2000) or studies at national level dealing only with the metropolitan areas (Boix and Veneri, 2009).
7See Polèse (2010) for a discussion.
Secondly, a set of regions always involves a partition of some geographical space that contains a large number of places, with a place serving as the elementary spatial unit that we use. Thirdly, a well-known result in set theory is that there is one-to-one correspondence between the family of partitions in a set and the family of equivalence relations of the same set
8. Based on these three basic criteria, many possible sets of regions may be defined, and as a result, depending on the point of view selected, many types of concepts of region can be constructed.
In labour economics, data constraints have led to a situation where any research dealing with the regional or spatial dimension of the labour markets is usually based on administrative regions such as NUTS regions in the European case
9. Some attempts have been made to use another spatial aggregation of the data reflecting functional relationships between workers and jobs. In those cases, the basic principle for setting the boundaries of the local labour markets (LLMs) is demand-side and supply-side self-containment, which in practical terms means maximizing (minimizing) commuting flows within (between) them
10. The regionalization procedure commonly used consists on a multi-stage aggregation process based on an algorithm originally developed by Coombes et al (1986), and since then applied to many countries, including Great Britain (where the Department of Employment defines the so-called Travel-To-Work- Areas or TTWAs), Italy (Sforzi et al., 1997), for Spain (Casado-Diaz, 2000; due to the lack of data local labor markets for only one comunidad autonoma are computed), New Zealand (Papps and Newell, 2002), Denmark (Andersen, 2002) and Australia (Watts, 2003).
8An equivalence relation in a set is a (i) reflexive, (ii) symmetric and (iii) transitive relation: these imply that (i) an object is always similar to itself; (ii) if one object is similar to another the latter is similar to the former and (iii) two objects similar to a third one are themselves similar.
9 Nomenclature des Unites Territoriales Statistiques (NUTS) is the geographical system established by the Eurostat for the production of regional statistics within the European Union.
According to Eurostat, these “normative regions are the expression of a political will; their limits are fixed according to the task allocated to the territorial communities, to the sizes of population necessary to carry out these task efficiently and economically, or according to historical, cultural and other factors” (Eurostat, 2006).
10In practice, that means setting a threshold of residents working in the area and workers living in the area (from 75% to 70% depending on population size) and also a minimum number or working population (commonly 3,500). See Ball (1980) and Coombes and Openshaw (1982) for more details about LLMs definition.
However, from a pure Regional and Urban Economics perspective (see Fujita et al. 1999), when defining a region a small number of attributes should be highlighted, namely: (i) location matters, because industries (and therefore economic activity and employment) are always drawn to places best suited for commerce and interaction with markets; and (ii) size matters, because dynamic industries, or the most advanced in each epoch, are naturally drawn to large cities and places within easy reach. A corollary could be deduced from (i) and (ii), namely (iii) proximity to size also matters
11. The existence of agglomeration economies (size) and the location are the key factors of this definition.
Taking these ideas into consideration, Coffey and Polèse (1988), Polèse and Champagne (1999) and Shearmur and Polèse (2004) suggest a functional classification which, though originally thought for explaining the location of economic activity and economic growth, could also be very useful for labour market analysis. As well as agglomeration economies and location determine location decisions and specialization patterns for companies, they should explain the same for workers (employment). In practical terms, with the functional classification the spatial statistical units (either census divisions, counties, municipalities, länders, etc) that constitute the national economic space are aggregated based on the population size and distance to the metropolis. Thus, these new analytical regions created are groupings of analogous statistical units, classified by size and by distance (to the nearest metropolitan area).
Figure 1 presents a schematic representation for an idealized national space economy. The reader will undoubtedly note the resemblance with the classic idealized economic landscapes of Christaller, Lösch, and Von Thünen, all of which posit one metropolis or marketplace at the centre. Thus, Figure 1 represents one big metropolis at the centre, but also four smaller “central” urban areas of different population sizes around it, as well as other “central” rural areas (these areas, either urban or rural, are close to the metropolis). Another four analogous size classes represent the “peripheral” urban areas, which are located at some distance from the metropolis and surrounded by their
11Another basic idea of regional economics is that (iv) cost matters, because without adequate size or a propitious location, places will grow if they have a clear labour cost advantage or, alternatively, an exceptional resource endowment (Polèse, 2010).
corresponding rural areas. It is implicitly assumed that urban areas are distributed in accordance with the rank-size rule
12.
Figure 0. Schematic Representation of the Classification of Spatial Units.
Key
Metropolitan Area Central Urban Central Rural
Peripheral Urban Peripheral Rural Source: Own elaboration based on Polèseet al. (2007).
12 This was proposed by George Zipf (Zipf, 1949) and consists of identifying a statistical relationship between the size of cities and their position in the city ranking. The rule has been tested for several countries and time periods, with prominent empirical studies including Gabaix (1999) and Ades and Glaeser (1995).
Metropolitan Area
CENTRE
PERIPHERY
Following this classification, in relation to size there are three main types of areas:
Metropolitan areas: metropolitan areas of more than five hundred thousand inhabitants. These metropolitan areas include the city and its surrounding area of influence. They are ad hoc specifications.
Urban areas: urban agglomeration areas with more than ten thousand inhabitants.
Rural areas: less than ten thousand inhabitants, including all areas that are not urban but which may contain towns.
A parallel distinction, based on proximity to major metropolitan areas, is applied to all non-metropolitan urban areas:
Central areas: all areas within approximately one hour’s drive of a metropolitan area.
Peripheral areas: all areas situated more than one hour’s drive from metropolitan areas.
The one hour’s drive criterion takes into account several factors such as road conditions (e.g., highway or not), the spatial limits of metropolitan areas, and the distinctive characteristics of the area being classified. Thus, as illustrated on Figure 1, central areas do not necessarily form perfect rings around metropolitan areas. The one-hour threshold, also used in other applications, has been found to be very robust and a good indicator of the range within which spatial interaction with the metropolis remains fairly easy, especially for face-to- face relationships related to the consumption of high-order services.
Applied to the Spanish territory in Polèse et al. (2007) to explain the location of economic activity and in Viñuela et al. (2010) to explain employability patterns, in reality this classification based on economic criteria results on a picture quite similar to Figure 1, but with two big metropolitan areas (see Map 1).
Spain is divided into seventeen Autonomous Communities (NUTS II regions), some of which include several provinces (NUTS III) for a national total number of 50 provinces
13. Each province is in turn divided into several municipalities,
13Ceuta and Melilla are excluded from the study.
ranging from 34 (Las Palmas) to 371 (Burgos). Furthermore, the seventeen Autonomous Communities are also aggregated into seven administrative regions (NUTS I regions), which have no real internal meaning and are only used for comparative purposes with some other European member-states. In 2001 Spain had 8,106 municipalities. The Spanish Census gives population and employment figures (by age, gender, industry and level of qualification and occupation) for each municipality.
In the presence of agglomeration economies, economic activity and therefore employment tend to be unevenly spatially distributed, instead exhibiting positive spatial dependence. These disparities and spatial dependence can be observed at regional level either using the NUTS I, NUTS II or NUTS III regions.
For example, in the year 2001 the Spanish employment rates14 for the NUTS I regions ranged from 50.67% (South) to 62.72% (Madrid). At the NUTS II regional level, the figures ranged from 49.44% (Andalucía) to 63.65%
(Cataluña), while for the NUTS III regions, the province with the lowest employment rate was Cádiz (43.45%) and the one with the highest was Girona, with 65.98% employment rate. To get a better idea of the magnitude of these disparities, Table 1 and 2 show the average and the standard deviation for NUTS I, NUTS II and NUTS III regional employment rates.
Table 0. NUTS I regional average employment rates.
NUTS I. Average Employment Rates
Below Average Above Average
Average Standard
Deviation Average Standard
Deviation
South 50.67% 0.0985 North-East 60.54% 0.0743
North-West 55.03% 0.0663 East 61.93% 0.0668
Centre 55.29% 0.1004 Madrid 62.72% 0.0515
Canary Islands 56.33% 0.0671
TOTAL Average 57.77% Standard Deviation 0.099
Source:Authors’ calculations based on 2001 Spanish Census (INE, 2007).
14 Although EUROSTAT provides figures for employment rates for the NUTS I, NUTS II and NUTS III regions, for comparison purposes with the analytical regions under evaluation these figures have been calculated from the corresponding aggregation of the municipal data.
Moreover, when using the 2001 Census from the Spanish National Institute of Statistics (INE), employment rates can only be estimated with the potential active population, i.e., all the population aged 16 to 64, either active or non active.
The wide disparities observed at NUTS I, NUTS II and NUTS III level reflect little or no consideration for the meaningfulness of these administrative or normative regions, which are the ones commonly used when studying labour market topics. If data at more disaggregated levels were available, alternative types of regions (i.e., analytical regions) could be used and the aggregation method chosen (regionalization procedure) should be of major interest to researchers and policy makers.
When grouping data, lots of very well-known regionalization algorithms for spatial aggregation can be used.15 The purpose of these regionalization algorithms is basically to generate regions that are internally coherent but clearly different from each other. These algorithms minimize the objective function value in such a way that the intraregional heterogeneity is as low as possible. The methods assume certain prior knowledge about the relevant variable (or variables) for aggregation, the number of regions to be designed or the existence of contiguity constraints, so in this sense they are supervised.
15For a review of the literature on regionalization methods, see Fischer (1980), Murtagh (1985), Gordon (1996; 1999) and Duqueet al.(2006).
Table 2. NUTS II and NUTS III regional average employment rates.
NUTS II (CC.AA.) Average Employment Rates
Below Average Above Average
Average Standard
Deviation Average Standard
Deviation
Andalusia 49.44% 0.0987 Murcia 58.27% 0.0428
Extremadura 50.00% 0.0998 Basque Country 58.90% 0.0612
Asturias 52.33% 0.0667 C. Valenciana 59.18% 0.0680
Cantabria 55.78% 0.0535 Aragón 61.81% 0.0787
Galicia 55.95% 0.0693 Balearic Islands 62.60% 0.0468
Canary Islands 56.33% 0.0671 Rioja 62.66% 0.0792
Castilla-Mancha 56.56% 0.0891 Madrid 62.72% 0.0515
Castilla-Leon 56.65% 0.0949 Navarra 63.18% 0.0642
Cataluña 63.65% 0.0538
Total Average= 57.77% Standard Deviation= 0.099
NUTS III (Provinces) Average Employment Rates
Below Average Above Average
Average Standard
Deviation Average Standard
Deviation
Cádiz 43.55% 0.0635 Alicante 57.87% 0.0796
Badajoz 47.40% 0.0747 Murcia 58.27% 0.0428
Granada 48.38% 0.1063 Toledo 58.94% 0.0570
Jaén 48.73% 0.0975 Valencia 58.95% 0.0493
Huelva 48.90% 0.0712 Lugo 58.98% 0.0611
Sevilla 49.04% 0.0732 Almería 60.91% 0.0885
Córdoba 49.67% 0.0787 Burgos 61.29% 0.0832
Málaga 51.38% 0.1061 Teruel 61.40% 0.1027
Asturias 52.33% 0.0667 Guadalajara 61.47% 0.1077
Ciudad Real 52.83% 0.0586 Zaragoza 61.49% 0.0653
Ourense 53.36% 0.0690 Álava 61.88% 0.0603
León 53.88% 0.0847 Segovia 61.91% 0.0769
Salamanca 54.23% 0.0718 Guipúzcoa 62.06% 0.0513
Cáceres 54.26% 0.0920 Tarragona 62.32% 0.0510
Zamora 54.32% 0.0769 Balearic Islands 62.60% 0.0468
Albacete 55.12% 0.0640 Rioja 62.66% 0.0792
Coruña 55.42% 0.0494 Madrid 62.72% 0.0515
Sta. Cruz Tenerife 55.65% 0.0567 Navarra 63.18% 0.0642
Valladolid 55.77% 0.0598 Barcelona 63.38% 0.0469
Cantabria 55.78% 0.0535 Huesca 63.48% 0.0616
Vizcaya 56.23% 0.0568 Castellón 64.22% 0.0647
Palencia 56.27% 0.0681 Soria 65.79% 0.0965
Ávila 56.36% 0.0721 Lleida 65.96% 0.0530
Pontevedra 56.39% 0.0655 Girona 65.98% 0.0579
Palmas 56.93% 0.0696
Cuenca 57.35% 0.0803
Total Average 57.77% Standard Deviation 0.099
Source:Authors’ calculations based on 2001 Spanish Census (INE, 2007).
Applying the original classification to the particular characteristics of the Spanish case,16 the classification would be as follows:
Metropolitan areas (MA): The same 500,000 threshold in other countries is used in the Spanish case to define metropolitan areas. However, given the special demographics of Spanish cities, metropolitan areas are subdivided into two classes. The first, MA1, includes metropolitan areas with more than two and a half million inhabitants. The second, MA2, refers to metropolitan areas with a population of between 500,000 and 2,500,000 inhabitants.
Urban areas (UA1 and UA2): The urban agglomerations with more than ten thousand inhabitants are grouped into two classes. The first, UA1, includes all areas with more than 100,000 inhabitants and less than 500,000; the second, UA2, all urban areas with populations between 10,000 and 100,000 inhabitants.
Rural areas (RA): all areas that are not urban, which may contain towns, but with less than ten thousand inhabitants in 2001.
The hour’s drive criterion also holds in the Spanish case:
Central areas (CA): all areas within approximately one hour’s drive of a metropolitan area (either MA1 or MA2).
Peripheral areas (PA): all areas situated more than one hour’s drive from metropolitan areas (either MA1 or MA2).
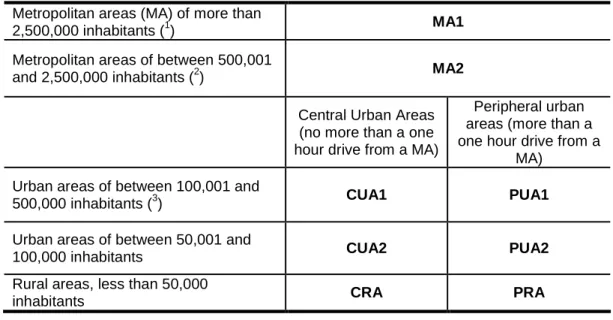
Thus, taking into account the particular demographic structure and city size characteristics, in the Spanish case eight types of regions were created. Table 3 presents a summary of the eight types of regions based on the size and distance criteria into which the 8,106 Spanish municipalities are aggregated.
In line with this classification, in Map 1 we can see the resulting division of Spanish territory, an unfamiliar and novel landscape where these “types of regions” do not necessarily share borders (there is no contiguity constraint) or
16 A strict application of the original definition of “metropolitan area” (areas with more than 500,000 inhabitants) in the Spanish case generates two clear sub-groups: Madrid and Barcelona Metropolitan Areas (which both concentrate more than 4 million inhabitants), and the rest of the Spanish metropolitan areas (with populations less than 1.5 million in all cases).
Similarly, two categories of urban regions are created (less than or more than 100,000 inhabitants). For more details, see Appendix I.
belong to the same politico-administrative region, i.e. a NUTS III region (province) or NUTS II region (Autonomous Community)
17.
Table 3. Territorial classification by size and position.
Application to the Spanish case.
Metropolitan areas (MA) of more than
2,500,000 inhabitants (1) MA1
Metropolitan areas of between 500,001
and 2,500,000 inhabitants (2) MA2
Central Urban Areas (no more than a one hour drive from a MA)
Peripheral urban areas (more than a one hour drive from a
MA) Urban areas of between 100,001 and
500,000 inhabitants (3) CUA1 PUA1
Urban areas of between 50,001 and
100,000 inhabitants CUA2 PUA2
Rural areas, less than 50,000
inhabitants CRA PRA
Notes:
(1) Metropolitan Areas of Madrid and Barcelona.
(2) Metropolitan Areas of Alicante, Bilbao, Cadiz Bay, the Central Urban Area of Asturias, Malaga, Murcia and Cartagena Conurbation, Seville, Valencia and Zaragoza.
(3) There are more than 200 municipalities that can be classified as “urban” and
“central”, with the most important ones being Castellon, Girona, Huelva, Malaga, San Sebastian, Santander-Torrelavega, Tarragona, Vitoria and some of their surrounding municipalities.
Source:Polèseet al.(2007).
17 As Fischer (1980) points out, “The main distinguishing characteristic between regions and regional types is the spatial contiguity of the spatial basic units.”
Map 1: Spanish Territory into the Eight Analytical Types of Regions
Source: Own elaboration based on Polèseet al. (2007) and Viñuelaet al.(2010).
Although this paper does not deal directly with the labour economics literature on local labour markets, i.e., the analytical areas were not constructed using any sort of commuting criteria, it can be easily proved that the travel-to-work commuting patterns of these functional regions generated under the size and proximity criteria also fit into the definition of a local labour market area. This is an additional positive feature of the analytical regions as it is agreed that the LLMAs are the ideal geographical areas for the implementation of any regional industrial policy or for reporting disaggregated labour figures (Ball, 1980).
Table 4 shows commuting patterns for the eight types of regions under analysis.
The metropolitan areas and the regions that include the bigger municipalities (cities with more than 100,000 inhabitants and their surrounding areas or influence)
18would also strictly fulfil the 75% threshold for commuting patterns
18As suggested by Papps et al. (2002), “The metropolitan area system is not designed to deal with rural areas” (p. 6).
Central Urban Area of Asturias, MA2
Zaragoza MA2 Bilbao MA2
Sevilla MA2 Madrid MA1
Málaga MA2
Barcelona MA1
Alicante MA2 Valencia MA2
Cádiz Bay MA2
Murcia and Cartagena MA2
Map Legend MA1 MA2 CUA1 CUA2 CRA PUA1 PUA2 PRA
set in the labour economics literature, i.e., they are self-contained local labour markets -or travel-to-work areas- from both the demand and the supply side.
Table 4: Commuting patterns between the Analytical Regions.
Analytical Regions MA1 MA2 CUA1 CUA2 CRA PUA1 PUA2 PRA Percentage of people working in
the residence region 91.2 89.5 84.3 69.6 59.3 87.7 77.7 65.8 Percentage of people living in the
working region 88.1 84.6 75.4 69.2 68.6 76.2 79.5 83.9
Source: Authors’ calculations based on 2001 Spanish Census (INE, 2007).
Besides the accomplishment of the commuting criteria, in theory an optimal region should fulfill at least one of two principles (Fischer, 1980): internal homogeneity, whereby individual regions should be as homogeneous in the attribute space as possible, and external separation, whereby different regions should be as far apart in the attribute space as possible. Pursuing both principles, on the next section we will evaluate the robustness of the functional regions suggested versus the administrative ones commonly used (NUTs at different levels) for the study of the Spanish labour markets.
3. Evaluation of the analytical classification.
3.1. Evaluation criteria.
Although no statistical algorithm or method has been used for the definition of the analytical regions, when evaluating them versus the traditional administrative division, same criteria proposed for clustering evaluation and selection of an optimal clustering scheme applies: (i) Compactness, i.e., the members of each region should be as close to each other as possible; and (ii) Separation, i.e., the regions themselves should be widely spaced
19.
Applied to local labour markets, the first criteria (internal homogeneity) imply the existence of very well defined labour markets where the municipalities included
19 There are different approaches to measuring the distance between two regions: distance between the closest members of the regions (single linkage), between the most distant members (complete-linkage) or between the centers of the clusters (comparisons of centroids).
See Berry and Linoff (1996).
share common characteristics, problems and diagnosis. This compactness is a desirable feature for any active labour policy designed to be implemented at local level. As for the second criteria (dissimilarity between regions), the existence of differences between regions in practical terms implies the spatial customization of policies, i.e., policymakers should be very aware of the economic characteristics of each region in order to try to identify its particular problems. In other words, the success of a policy in a certain region does not guarantee its immediate success in another.
3.2. Hypotheses.
To evaluate the relative performance of the analytical ones designed under economic criteria versus the traditional administrative regions (NUTS I, NUTS II and NUTS III regions), we will test the following hypothesis:
H1: given the existence of agglomeration economies and the importance of location, the analytical regions are better for describing the employment distribution patterns, either total or by gender, in the Spanish territory than any of the administrative divisions.
H2: the analytical regions capture the patterns of distribution of employment by industry better than the administrative regions commonly used.
H3: the spatial distribution of employment by type of job performed and level of qualification can be better explained on bases of the analytical regions than any of the administrative divisions commonly used.
3.3. Evaluation indexes: Theil inequality index and Davies-Bouldin Validity Index.
To test the three hypothesis we will use the well-known Theil inequality index (Theil 1967), commonly applied to the distribution of income and wealth. The index can be decomposed as the sum of the between and a within component
20. Its within component will be useful to quantify the intraregional homogeneity of the regions when dealing with the spatial distribution of
20For more details about the calculation of the Theil index, see Appendix II.
employment. Given the characteristics of Theil’s index, if the internal homogeneity of the regions increases (a decrease of the within component), that necessarily implies that the heterogeneity between regions increases (a rise of the between component). Nowadays, in reality this is not necessarily the case; a given region may be very well defined internally but exhibit no particular differences from another (the reverse also applies).
In order to include both criteria simultaneously –compactness and separation-, we have to use techniques specifically designed for clustering validation. Thus, it seems necessary to test also the three hypotheses with the Davies-Bouldin Validity Index (Davies and Bouldin, 1979)
21. Given the characteristics of our database and the administrative and analytical classifications of the regions (non-hierarchical crisp clusters with different numbers of regions), the Davis- Bouldin index is the most appropriate clustering validation technique as it exhibits no trends with respect to the number of regions
22. This index estimates the average similarity between each region and the most similar one to it, so small values of the index are indicative of the presence of compact and also well-separated regions.
3.4. Evaluation results.
The first hypothesis under scrutiny is related to the use of the functional regions or the administrative ones for the study of the spatial distribution of employment and the distribution of employment by gender.
Table 2 shows the within component of the Theil’s index and the Davis-Bouldin index (total and by gender) when the 8,106 Spanish municipalities are aggregated into administrative regions –NUTS I (7 regions), NUTS I (17 Comunidades Autónomas), NUTS III (50 Provinces)- and into the analytical regions suggested (8 regions).
21For more details about the calculation of the Davies-Bouldin index, see Appendix III.
22For a good review of the main clustering validation techniques, see Halkidi et al, 2001).
Table 2: Analytical versus administrative regions. Theil’s index and Davis-Bouldin index (Employment, total and by gender).
Analytical Regions
Administrative Regions
MA1 to PRA
NUTS III
(PROV) NUTS II (CCAA) NUTS I (8 Regions) (50 Regions) (17 Regions) (7 Regions)
Theil's Index Within Within Within Within
Total 24.33 11.83 18.10 19.44 21.93
Male 23.11 11.17 17.15 18.47 20.81
Female 26.43 12.98 19.72 21.10 23.86
Davis-Bouldin Index
Total 36.33 579.96 3,313.01 57.70
Male 33.22 232.58 518.72 40.33
Female 20.36 525.03 189.63 1,914.03
Source: Authors’ calculations based on 2001 Spanish Census (INE. 2007)
Despite of the scale effect, i.e., everything else equal, intraregional inequality drops with the number of regions, the within component for the eight analytical regions is clearly lower than for any of the NUTS regions. In other words, the classification proposed shows a higher degree of internal homogeneity in the distribution of employment so that the local labor markets generated under the size and distance criteria are more integrated or coherent (even by gender) than any other political-administrative division of the territory.
The Davies-Bouldin index also shows better results (lower value of the index) for the analytical regions than for any other type of normative division.
Surprisingly enough, when taking into account internal homogeneity and also heterogeneity between regions (the main advantage of the DB index), NUTS I regions show better results than the NUTS II or NUTS III regions. This proves that despite being made up of Comunidades Autonomas with a higher degree of internal heterogeneity, the NUTS I division “artificially created” for comparison purposes within the European Union at least manages to divide the Spanish territory into seven large areas which are clearly differentiated and pretty homogeneous: North-West, East, North-East, Madrid, Centre, South and Canary Islands. In any case, however, the results for the eight analytical regions are better.
As expected, we can talk about one labor market for men and another one for
women. These are two different labor markets –also at regional level-, that
show a higher level of homogeneity – and heterogeneity between them - when studied separately.
The second hypothesis under scrutiny is related to the spatial patterns of distribution of employment by industry. The 2001 Spanish Census offers employment figures for sixteen (16) types of industries
23. Results for the Theil index (total and decomposed) and the Davis-Bouldin index according to the industrial classification used in the Census (Table 3) show a higher internal homogeneity within and also heterogeneity between the analytical regions for all industries except “Agriculture, hunting and forestry activities and fishing” and
“Extractive Industries”. One simple explanation is that these particular activities are necessarily linked to the physical location of the natural resources at hand - land, forests, rivers or mines- and therefore the chances to choose the geographical location of employment or for employment to move freely are very limited. In other words, the distribution of these activities does not depend on agglomeration economies but on the location of the natural resources.
23 “Agriculture, Hunting and Forestry Activities” and “Fishing” have been aggregated, therefore results only show 15 types of industries.
Table 3a: Analytical versus administrative regions. Theil’s index and Davis-Bouldin index (Employment by industry).
Analytical Regions Administrative Regions MA1 to PRA
NUTS III (PROV)
NUTS II
(CCAA) NUTS I (8 Regions) (50 Regions) (17 Regions) (7 Regions)
Theil's Index Within Within Within Within
Agriculture. hunting and forestry activities and fishing
12.98 0.84 0.75 0.81 0.90
Extractive Industries
30.81 24.36 17.42 21.80 24.07
Manufacturing
23.36 10.96 16.91 18.86 19.69
Production and Distribution of Energy
26.99 14.68 20.60 21.95 22.68
Construction
20.30 0.99 14.55 15.68 16.29
Minorsalers; Repairs
25.60 12.18 19.14 20.52 21.08
Hotels and Restaurants
25.41 13.18 17.94 19.19 19.99
Transportation, Storage and Communications
29.78 14.77 21.41 22.98 23.56
Financial Intermediation
34.33 17.64 25.75 27.23 27.74
Real State, Rental and Business Services
34.33 16.87 25.12 26.88 27.44
Public Administration and Defense
27.99 14.76 21.80 22.86 23.34
Education
29.18 14.83 23.00 24.30 24.93
Health and Veterinary Activities
30.35 15.35 24.26 25.64 26.19
Other social activies and servicies for households
29.10 14.32 21.37 22.87 23.43
Household's Activities
33.30 17.63 24.12 25.70 26.37
Table 3b: Analytical versus administrative regions. Theil’s index and Davis-Bouldin index (Employment by industry).
Analytical Regions Administrative Regions MA1 to PRA
NUTS III (PROV)
NUTS II
(CCAA) NUTS I (8 Regions) (50 Regions) (17 Regions) (7 Regions) Davis-Bouldin Index
Agriculture. hunting and forestry activities and fishing
123.23 88.29 105.12 42.08
Extractive Industries
98.12 361.34 59.34 53.41
Manufacturing
547.64 390.49 100.55 25.60
Production and Distribution of Energy
44.44 383.65 420.25 54.29
Construction
15.21 245.92 131.27 23.29
Minorsalers; Repairs
23.55 328.13 2140.30 69.43
Hotels and Restaurants
20.90 450.71 527.21 188.20
Transportation, Storage and Communications
23.47 340.48 159.81 116.33
Financial Intermediation
10.92 857.83 839.29 60.31
Real State, Rental and Business Services
9.81 375.78 107.10 33.13
Public Administration and Defense
29.09 866.40 101.17 20.18
Education
25.13 789.15 117.58 34.01
Health and Veterinary Activities
29.68 433.19 29.45 37.13
Other social activities and services for households
13.76 520.02 437.47 158.37
Household's Activities
12.67 497.93 354.12 29.10
Source: Authors’ calculations based on 2001 Spanish Census (INE. 2007)
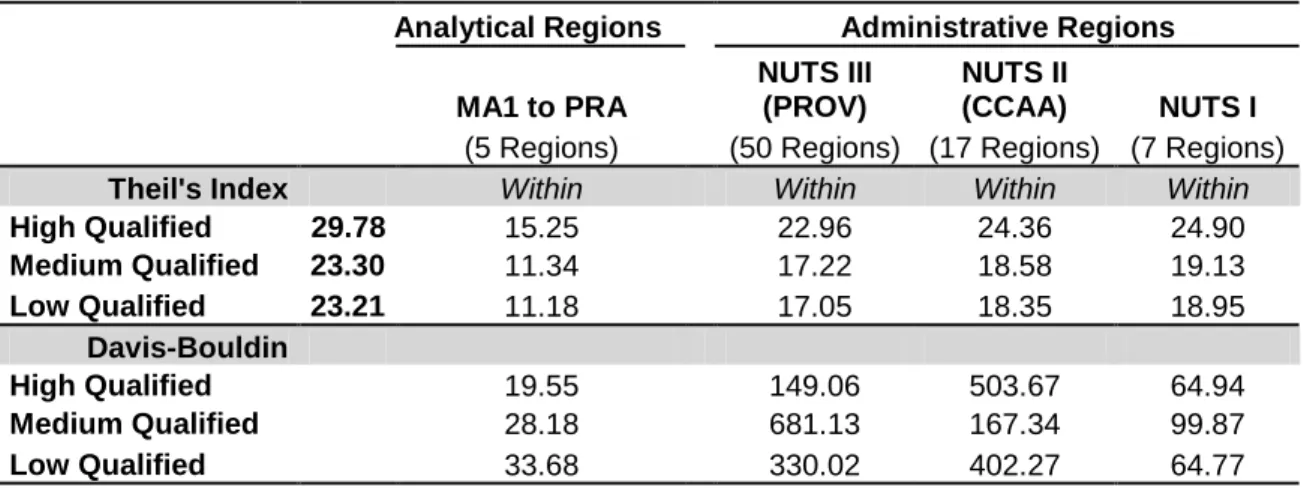
For testing the third hypothesis, i.e., the analytical regions are a better option -
more compact and differentiated-, when dealing with spatial analysis of labor
markets by different levels of qualification, the classification available at the
2001 Census describes 9 groups aggregated by type of work and level of
qualification. In this special classification, qualification is understood as the
capacity to carry out the tasks which comprise any given job. Therefore, it
includes two different facets: level of qualification and specialization within this
level qualification. In order to work with a more standard classification, we aggregate those 9 groups into “High-Qualified Occupations”, “Medium-Qualified Occupations” and “Low-Qualified Occupations”
24. The results of the Theil and Davis-Bouldin index by level of qualification are shown in the following table (Table 4)
25.
Table 4: Analytical versus administrative regions. Theil’s index and Davis-Bouldin index (Employment by occupation).
Analytical Regions Administrative Regions MA1 to PRA
NUTS III (PROV)
NUTS II
(CCAA) NUTS I (5 Regions) (50 Regions) (17 Regions) (7 Regions)
Theil's Index Within Within Within Within
High Qualified 29.78 15.25 22.96 24.36 24.90
Medium Qualified 23.30 11.34 17.22 18.58 19.13
Low Qualified 23.21 11.18 17.05 18.35 18.95
Davis-Bouldin
High Qualified 19.55 149.06 503.67 64.94
Medium Qualified 28.18 681.13 167.34 99.87
Low Qualified 33.68 330.02 402.27 64.77
Source: Authors’ calculations based on 2001 Spanish Census (INE, 2007).
For all levels of qualification, the within component is clearly lower than any other administrative division. The differences are slightly more pronounced for the high qualified jobs, where agglomeration economies might play a more effective role.
For the third hypothesis tested, namely the suitability of the analytical regions for the study of the spatial patterns of distribution of employment by level of qualification and occupation, the Davis-Bouldin index confirms those from the Theil index. The analytical regions are also a better option when dealing with local labor market issues by level of qualification or occupation.
24For details about the nine categories and their aggregation, see Appendix IV.
25See Appendix V for Theil’s Index results for the nine categories.
4. Conclusions.
To date, analysis of the spatial dimension of Spanish labor market has been limited to administrative, rather than appropriately-defined functional, geographic units. Alternative divisions of the territory based on the existence of agglomeration economies and the importance of geography have been used in the literature to understand the location of economic activity (Polèse et al., 2007) or explain the employability patterns (Viñuela et al., 2010). However, their robustness against the administrative ones commonly used has –to date- not been evaluated. The objective of this paper is to prove those functional regions defined under such economic criterion provide better defined regions –more compactness and separation- than the administrative ones commonly used to carry out labour market studies at sub-national level.
Using micro data from the last Spanish Census available, the functional and administrative regions are evaluated using the Theil index and the Davis- Bouldin Validation index. Applied to employment (by gender, industry and level of qualification and occupation), both indexes show better results for the analytical regions than for any of the ordinary administrative ones (NUTS I, II or III regions). The analytical classification generates areas where the distribution of employment is more homogeneous within and more heterogeneous between the regions. Agglomeration economies and distance (to the metropolis) seem to be relevant for understanding the patterns of distribution of employment, either by gender, by industry or by level of qualification and occupation. In practice this means a clearer way for identifying local labour markets and explaining their differences and similarities.
In the light of these results, this paper suggests that, subject to the availability of
data, this alternative classification could be considered when carrying out labor
economics studies that include a spatial dimension. The use of this
classification can offer a better understanding of the job opportunities, location
of industries, concentration of unemployment, occupations and so many other
labour related topics. Surpassing the administrative division of the territory, this
classification manages to have explanatory power in spatial labour economics
topics while including geoeconomic characteristics as relevant as location and
agglomeration economies.
6. References.
Andersen, A. K. (2002): “Are Commuting Areas Relevant for the Delimitation of Administrative Regions in Denmark?”, Regional Studies, 36 (8), pp 833 – 844.
Arbia, G. (1989): Spatial data configuration in statistical analysis of regional economic and related problems. Dordrecht, Netherlands: Kluwer.
Amrhein, C. G. and R. Flowerdew (1992): “The effect of data aggregation on a Poisson regression model of Canadian migration”. Environment and Planning A, 24, pp. 1381–1391.
Ball, R.M. (1980): “The use and definition of Travel-to-Work Areas in Great Britain: Some problems”. Regional Studies, 14 (2), pp. 125-139.
Behrens, K. and J.F. Thisse (2007): “Regional economics: A new economic geography perspective”, Regional Science and Urban Economics, 37, pp.
457-465.
Berry M.J. and G. Linoff (1997): “Data Mining Techniques for Marketing, Sales and Customer Support, John Wiley and Sons.
Boix, R and P. Veneri (2009): “Metropolitan Areas in Spain and Italy”, IERMB Working Paper in Economics, nº 09.01.
Casado-Diaz, J.M. (2000): “Local Labor Market Areas in Spain: A Case Study”, Regional Studies, 34 (9), pp. 843-856.
Coffey W.J. and M. Polese, (1988): “Locational Shifts in Canadian Employment, 1971-1981: Decentralization v. Decongestion”. Canadian Geographer, 32 (3), pp 248-256.
Coombes, M.G.; A.E. Green and S. Openshaw (1986): “An Efficient Algorithm to Generate Official Statistical Reporting Areas: The Case of the 1984 Travel-to-Work Areas Revision in Britain”, Journal of the Operational Research Society, 37 (10), pp. 943-53.
Coombes, M.G. and S. Openshaw (1982): “The Use and Definition of Travel-to- Work Areas in Great Britain: Some Comments”, Regional Studies, 16 (2), pp. 141-9.
Davies, D.L. and D.W. Bouldin, (1979): “A cluster separation measure”. IEEE Transactions on Pattern Analysis and Machine Intelligence, 1, pp. 224–
227.
Duque, J. C.; R. Ramos and J. Suriñach (2007): “Supervised Regionalization Methods: A Survey”, International Regional Science Review, 30 (3), pp.
195-220.
Eurostat (2006) Nomenclature of territorial units for statistics—NUTS. Statistical regions of Europe.
http://europa.eu.int/comm/eurostat/ramon/nuts/home_regions_en.html
(06/19/2006)
Fischer, M.M. (1980): “Regional taxonomy: A comparison of some hierarchic and non-hierarchic strategies”, Regional Science and Urban Economics, 10, pp. 503-537.
Fotheringham, A. S., and D. W. S. Wong (.1991): “The modifiable areal unit problem in multivariate statistical-analysis”. Environment and Planning A, 23, pp. 1025-1044.
Fujita, M., P. Krugman, A.J. Venables, (1999): The Spatial Economy. Cities, Regions and International Trade, MIT Press, Cambridge, MA.
Gotway C.A., L.J. Young (2002): “Combining incompatible spatial data”. Journal American Statistics Association, 97, pp. 632–648.
Greenland S., and H. Morganstern (1989): “Ecological bias, confounding, and effect modification”. International Journal Epidemiology, 18, pp. 269–274.
Halkidi, M.; Y. Batistakis and M. Vazirgiannis, (2001): “On Clustering Validation Techniques”, Journal of Intelligent Information Systems, 17 (2/3), pp. 107- 145.
INE (2007): Censo de Población y Viviendas, 2001, Instituto Nacional de Estadística, Madrid (available online at
www.ine.es).Openshaw S. (1984): “The modifiable areal unit problem. Concepts and techniques in modern geography”, 38. GeoBooks, Norwich.
Openshaw, S., and P. J. Taylor (1981): “The modifiable areal unit problem”. In Quantitative geography, edited by N. Wrigley and R. J. Bennett, pages 60–
70. London: Routledge.
Paelinck, J. H. P (2000): “On aggregation in spatial econometric modeling”.
Journal of Geographical Systems 2, pp. 157–165.
Paelinck, J. H. P., and L. H. Klaassen (1979): Spatial econometric.
Farnborough, UK: Saxon House.
Papps, K.L. and J.O. Newell, (2002): “Identifying Functional Labor Market Areas in New Zealand: A Reconnaissance Study Using Travel-to-Work Data”, IZA Discussion Paper 443.
Piantadosi S., D.P. Byar and S.B. Green (1988): “The ecological fallacy”, American Journal of Epidemiology, 127, pp. 893–904.
Poland M. and D. Maré (2005): “Defining Geographic Communities”. MOTU Working Paper 05-09. Motu Economic and Public Policy Research.
Polèse, M (2010): The Wealth and Poverty of Regions. Why cities matter. The University of Chicago Press.
Polèse, M. and E. Champagne, (1999): “Location Matters: Comparing the Distribution of Economic Activity in the Canadian and Mexican Urban Systems”, International Regional Science Review, 22 (1), pp. 102-132.
Polèse, M., and F. Rubiera, (2009): Economía Urbana y Regional: Introducción a la Geografía Económica. Thomson-Civitas. Madrid.
Polèse, M., F. Rubiera, and R. Shearmur, (2007): “Observing regularities in
location patterns: an analysis of the spatial distribution of economic activity
in Spain”, European Urban & Regional Studies, 14 (2), pp. 157-180.
Richardson S. (1992): “Statistical methods for geographical correlation studies”.
In: Elliot P, Cuzick J., English D., Stern R. (eds) Geographical and environmental epidemiology: methods for small area studies. Oxford University Press, New York, pp. 181–204.
Richardson S., L. Stucker and D. Hemon (1987): “Comparison of relative risks obtained in ecological and individual studies: some methodological considerations”. International Journal of Epidemiology, 16, pp.111–120.
Robinson W.S. (1950): “Ecological correlations and the behaviour of individuals”, American. Sociological Review, 15, pp. 351-357.
Sforzi F., S. Openshaw and C. Wymer (1997) Le procedura di identificazione dei sistemi locali del lavoro [The procedure to identify local labour market area], in Sforzi F. (Ed.) I sistemi locali del lavoro 1991, pp. 235–242.
ISTAT, Rome.
Shearmur R. and M. Polèse, (2004): “Diversity and employment growth in Canada, 1971-2001: can diversification policies succeed?”, INRS-Internal document, Montreal.
Theil, H. (1967): Economics and information theory, North-Holland, Amsterdam.
Viñuela, A., F. Rubiera, and B. Cueto (2010): “An Analysis of Urban Size and Territorial Location Effects on Employment Probabilities: The Spanish Case”. Growth and Change, 41 (4), pp. 495-519.
Watts, M. (2002): “Local Labor Markets and Job Proximity: Conceptual and
Measurement Issues”, Workshop 2002 Papers, Centre of Full Employment
and Equity, University of Newcastle, Newcastle, Australia.
APPENDIX I: Total Population of the Spanish Metropolitan Areas and the rest of analytical regions.
Analytical Region Total Population Number of municipalities MA1
Madrid MA 4,866,821 30
Barcelona MA 4,372,091 162
MA2
Valencia MA 1,389,585 47
Sevilla MA 1,237,066 27
Vizcaya MA 895,086 34
Central Urban Area of Asturias 832,843 18
Málaga MA 776,744 15
Murcia and Cartagena MA 766,222 14
Zaragoza MA 679,721 28
Alicante MA 592,230 13
Cádiz Bay MA 577,756 6
CUA1 2,163,392 74
CUA2 3,669,212 171
CRA 3,014,919 1,694
PUA1 5,587,002 259
PUA2 3,970,633 193
PRA 5,318,132 5,321
Total 40,709,455 8,106
APPENDIX II: Decomposition of the Theil’s inequality index.
Applying the Theil inequality index (Theil 1967) to employment, the formula is computed as follows:
n
PopEmp PopEmp
PopEmp PopEmp
T municip Esp
n
m Esp
municip
/ 1 log /
1
where n is the number of municipalities considered (8,106), PopEmp
municipis the population employed in municipality m, and PopEmp
Esprepresents the Spanish working population.
The Theil index can be completely and perfectly decomposed into a between- group component (Tg) and a within-group component (Tw). Intraregional homogeneity can be therefore quantified by the within-group component. Thus:
T = Tg + Tw
with
n n
PopEmp PopEmp
PopEmp PopEmp Tg
r
Esp r
R
r Esp
r
/ log /
1
r
r municip
n
m r
municip R
r Esp
r
n
PopEmp PopEmp
PopEmp PopEmp PopEmp
PopEmp
Tw log 1/
1 1
where r indexes regions, with
nrrepresenting the number of municipalities in region r and PopEmp
rthe population employed in the region r to which the municipality belongs.
As the within component quantifies the heterogeneity between the individuals of
a region, small values indicate the existence of a high degree of internal
homogeneity.
APPENDIX III: The Davies-Bouldin Validation Index.
This index (Davies and Bouldin, 1979) is a function of the ratio of the sum of within-region scatter to between-region separation, and it is defined as:
m
i i
m R
DB m
1
1
where
Ri maxj1,...,mjiRij,i1,....,mand m is the number of regions in which the Spanish territory is divided for each classification.
Then, the similarity index
Rijbetween region
i (Ri)and region
j (Rj)is defined as:
ij j i
ij d
S R S
where S
iis a measure of dispersion of
Riand
d(Ci,Cj)dijthe dissimilarity between two regions. The index
Rijsatisfies the following:
1.
Ri j≥02.
Ri j=Rji3. if
Si= 0 andS j= 0 thenRi j= 04. if
S j >S kand di j=dikthenRi j > Rik5. if
S j=Skand di j < dikthenRi j < Rik.The dissimilarity between region
Riand region
Rj, in a l-dimensional space isdefined as:
l
k
jk ik
j i
ij EmpPop EmpPop EmpPop EmpPop d
1
2
and the dispersion of a region
Riis defined as:
1 2
Ri
x
i i
i EmpPop EmpPop S n
As
DBmis the average similarity between each region and its most similar one,
small values of
DBare indicative of the presence of compact and well-
separated regions. The
DBmindex exhibits no trends with respect to the
number of regions.
APPENDIX IV: Type of job and level of qualification according to the 2001 Census classification and broad aggregation.
CN01 CLASSIFICATION
(2001 Spanish Census) AGGREGATION
1 -Business and public administration management/managers
2 - Technical staff and scientific and intellectual professionals
Highly-skilled personnel: directors, highly-qualified professionals and skilled technical staff
3 - Technical and professional support staff 4 - Administrative staff
6 - Skilled workers in agriculture and fisheries 7 - Artisans and qualified workers in
manufacturing, construction and mining excluding machine operators and installation workers
Medium-skilled personnel: technical staff and administrative support staff
5 - Hostelry, security and retail sales workers 8 - Machine operators, installation workers and fitters.
9- Unskilled workers
Low-skilled personnel: tertiary workers and industrial, artisanal and agricultural operators/laborers