DISCUSSION PAPER SERIES
ABCD
www.cepr.org
Available online at: www.cepr.org/pubs/dps/DP4590.asp www.ssrn.com/xxx/xxx/xxx
No. 4590
BILATERAL MARKET POWER AND VERTICAL INTEGRATION IN THE SPANISH ELECTRICITY
SPOT MARKET
Kai-Uwe Kühn and Matilde Machado
INDUSTRIAL ORGANIZATION
BILATERAL MARKET POWER AND VERTICAL INTEGRATION IN THE SPANISH ELECTRICITY
SPOT MARKET
Kai-Uwe Kühn, University of Michigan and CEPR Matilde Machado, Universidad Carlos III de Madrid
Discussion Paper No. 4590 September 2004
Centre for Economic Policy Research 90–98 Goswell Rd, London EC1V 7RR, UK Tel: (44 20) 7878 2900, Fax: (44 20) 7878 2999
Email: [email protected], Website: www.cepr.org
This Discussion Paper is issued under the auspices of the Centre’s research programme in INDUSTRIAL ORGANIZATION. Any opinions expressed here are those of the author(s) and not those of the Centre for Economic Policy Research. Research disseminated by CEPR may include views on policy, but the Centre itself takes no institutional policy positions.
The Centre for Economic Policy Research was established in 1983 as a private educational charity, to promote independent analysis and public discussion of open economies and the relations among them. It is pluralist and non-partisan, bringing economic research to bear on the analysis of medium- and long-run policy questions. Institutional (core) finance for the Centre has been provided through major grants from the Economic and Social Research Council, under which an ESRC Resource Centre operates within CEPR; the Esmée Fairbairn Charitable Trust; and the Bank of England. These organizations do not give prior review to the Centre’s publications, nor do they necessarily endorse the views expressed therein.
These Discussion Papers often represent preliminary or incomplete work, circulated to encourage discussion and comment. Citation and use of such a paper should take account of its provisional character.
Copyright: Kai-Uwe Kühn and Matilde Machado
September 2004
ABSTRACT
Bilateral Market Power and Vertical Integration in the Spanish Electricity Spot Market*
The Spanish electricity spot market is highly concentrated both on the seller and the buyer side. Furthermore, unlike electricity spot markets in other deregulated electricity systems, large buyers and sellers are typically vertically integrated. This allows both large net sellers and large net buyers to strategically influence the spot market price. We develop a supply function model of this market to analyse the impact of market power on prices and productive efficiency and use it empiricially to detect such bilateral market power. Our estimates suggest that market power has had little impact on spot market prices but that substantial productive inefficiencies may have arisen from the exercise of bilateral market power.
JEL Classification: L13, L41 and L94
Keywords: bilateral market power, electricity markets, market power test, supply function equilibirum and vertical integration
Kai-Uwe Kühn
Department of Economics University of Michigan 611 Tappan Street 238 Lorch Hall
Ann Arbour, MI 48109 USA
Tel: (1 734) 763 5317 Fax: (1 734) 764 2769 Email:
[email protected]For further Discussion Papers by this author see:
www.cepr.org/pubs/new-dps/dplist.asp?authorid=111588
Matilde Machado
Universidad Carlos III de Madrid Calle Madrid 126
28903 Getafe (Madrid) SPAIN
Tel: (34 91) 624 9571 Fax: (34 91) 624 9875
Email:
[email protected]For further Discussion Papers by this author see:
www.cepr.org/pubs/new-dps/dplist.asp?authorid=150060
developed in our report to the CSEN (Kühn and Machado, 2000). We thank Daniel Ackerberg, Charlie Brown, Luis Cabral, Trond Olsen, Dan Silverman, and Juan Toro for comments on a previous version of the paper. We are also grateful to Pedro Blás, Natalia Fabra, Miguel Angel Lasheras, participants at the 4
thCEPR conference in Empirical Industrial Organization and the
‘Competition and Coordination in Electricity Industry’ conference in Toulouse, as well as seminar participants at CEMFI, Madrid, City University London, Institute for Fiscal Studies, London, University of Essex, and the University of Michigan for helpful discussions. This Paper was finished while Machado was visiting CEMFI. She wishes to thank all the faculty and staff there for the wonderful environment.
Submitted 30 July 2004
1 Introduction
In January 1998, the Spanish government liberalized the market for electricity generation and intro- duced a spot market for electricity. This followed liberalization in the UK market and was enacted almost simultaneously with liberalization in California. The basic design of this electricity spot market is similar to the previously deregulated UK market and even closer to the California electricity market.
However, Spanish deregulation has been distinctive by allowing vertical integration between the gener- ation and retailing, which had been prohibited in other deregulation experiments.1 As a result, Spain’s major electricity companies are active on both sides of the electricity spot market, selling electricity as generators and buying it from the spot market as retailers.
The Spanish experience has also been distinct from that in California or the UK because there has been no major intervention by regulators caused by concerns about excessive pricing in the spot market. In the UK concerns about market power led to forced divestitures in generation and ultimately triggered a complete re-organization of the market. In California, it is now well known, that the exercise of market power caused, or at least contributed, to the 2000-2001 electricity crisis with its associated large costs to the public. In Spain, commentators had expected that the exercise of market power would be a major issue post-deregulation (see Kühn and Regibeau, 1998, and Arocena, Kühn and Regibeau, 1999). Indeed, Spanish electricity generation was more concentrated than UK generation at the time of deregulation with the two largest …rms controlling approximately 75% of generation. This high degree of concentration has remained virtually unchanged over the …rst few years of the deregulation experience.
Nonetheless, the issue of high spot market prices due to market power has been of much less importance in Spain than in the UK or California.
We show in this paper that the absence of major concerns about excessive pricing in the spot market is most likely a consequence of vertical integration. We show that what theoretically matters for an
1Most deregulation experiments in fairly concentrated markets, including the UK and California, have imposed vertical separation between generation and retailing activities in the belief that these would create incentives for entry into the industry. See Arocena et al. (1999) for such an argument.
integrated …rm is its net demand position at any point in time in the spot market. Since some …rms will be net demanders they have an incentive to overproduce in generation in order to lower the spot market price paid on the net purchases from the spot market. Since electricity markets must net out, there will always be …rms with net demand and net supply positions in the spot market. If they have similar degrees of market power, prices may not di¤er much from competitive prices. Indeed, prices may be higher or lower than in a perfectly competitive market. As a result it will not be apparent from average price cost margins in the industry whether substantial market power exists in the spot market.
However, there may, nevertheless, be large e¢ ciency losses because of the exercise of market power since net-demanders systematically overproduce and net-suppliers underproduce.
In this paper we analyze a supply function model to show these points formally and to develop a framework for structural estimation of competition in the Spanish electricity spot market.2 The model shows that market power e¤ects arise exclusively from asymmetries in upstream generation assets and downstream demand realizations. Under complete symmetry in generation cost functions and downstream demands the operation of the spot market would be e¢ cient and marginal cost pricing would obtain.
The model allows us to test alternative models of …rm behavior even in the absence of cost data:
In the presence of market power an increase in exogenous downstream demand will, on average, lead to a larger net demand position and systematically more aggressive bidding. Under competition, there should be no such impact of downstream demand variations on a …rm’s bidding strategy. Hence a systematic impact of downstream demand on the bid quantities of individual …rms will indicate the presence of market power. There should also be no impact of downstream demand on bidding behavior if the generation part of the electricity company would narrowly maximize generation pro…ts. Indeed, only under joint (generation and retailing) pro…t maximizing behavior would …rms act as if only net
2We have chosen the supply function model because it most closely resembles the true bidding structure of the market. It is therefore most appropriate for a structural estimation approach. However, it should be kept in mind that the qualitative features of the model would be retained by any other bidding model, for example the models of Harbord and von der Fehr (1993) and Mansur (2003).
demand positions mattered.
Our structural model allows us to nest the assumptions of perfect competition, supply function com- petition, and supply function competition with imperfect joint pro…t maximization between upstream and downstream units of the same …rm in form of simple restrictions on parameters of the estimating equation. Our estimates, based on a sample of spot market bids from May through December 2001, clearly reject perfect competition and robustly con…rm the assumption of joint pro…t maximization be- tween upstream and downstream units of the same …rm. The latter result is of some importance in its own right. Generation and supply companies in Spain are jointly owned but formally legally separate entities. Our analysis clearly rejects the claim often made before deregulation that legal separation would have a signi…cant impact on the behavior of the …rms.
Note that the use of a structural approach is crucial for our analysis since it allows the nesting of alternative hypotheses about the existence of market power even in the absence of information on costs,
…nancial contracts, or information on the form of downstream negotiated retail contracts. Furthermore, the structural approach is necessary to assess the impact of market power in terms of e¢ ciency e¤ects since it enables us to identify and estimate the …rms’ marginal cost parameters. Assessing e¢ ciency gains is particularly important given that there is two sided market power in the electricity spot market.
In markets with one sided market power, an estimate of price-cost markup would give an indication of the importance of market power in the market. However, since the spot market price may not be dramatically di¤erent from the competitive price, under two-sided market power the only way to assess the importance of market power is by estimating the e¢ ciency gains.
We do so by estimating marginal costs imposing the parameter restrictions of our supply function model. This gives us, for each …rm, precise estimates of the parameters of the aggregate marginal cost function for non-hydroelectric generation plants. We show that, if the two largest …rms (Iberdrola and Endesa) were to bid in their non-hydro plants at marginal cost (maintaining hydro-electrical bid functions unchanged) there would be little impact on price. However, there would be an estimated cost
reduction on these assets alone in the order of magnitude of 6000 Euro an hour or 51 million Euro a year.
The use of supply function equilibrium to model behavior in electricity markets was pioneered by Green and Newbery (1992) based on the theoretical work of Klemperer and Meyer (1989) and extensions of this work to capacity constrained markets by Kühn (1991). Their work focused on calibrating alternative scenarios for electricity liberalization in generation for the UK. Supply function models of electricity markets have …rst been estimated by Sweeting (2002) and Wolak (2003).
We contribute to this literature by expanding on the theoretical work in Kühn and Machado (2000), which …rst explicitly modelled the vertical structure of the market and discussed how the presence of heterogeneous and variable degrees of vertical integration could be exploited to identify market power in the spot market. In independent work Hortacsu and Puller (2004) have used an almost identical model to that developed in Kühn and Machado (2000) to study the Texas balancing market. Their use of the theoretical model is very di¤erent, however. Their aim is not to measure market power, but instead test the deviation of actual bidding from optimal bidding behavior. This is possible in their case because they have access to actual cost data. In contrast, we use the supply function model to estimate the marginal cost functions and assess the impact of market power.
Our paper is distinct from the rest of literature by focusing on the interaction of net-suppliers and net demanders with market power in the spot market.3 What allows us to identify the impact of market power in the presence of vertical integration in our paper is a high degree of variability of downstream demand, which leads to large e¤ective variations in vertical integration (i.e. net demand positions). The spirit of our exercise is therefore very close to Wolfram (1998) in the sense that we are observing variations in infra marginal sales to detect the exercise of market power. She concludes that asymmetries in generation assets in the UK electricity market signi…cantly increased prices. The
3Mansur (2003) also notes the di¤erent incentives of net-demanders and net-suppliers. However, the main focus of his paper is on the impact of cost non-convexities on the measurement of the degree of market power in the PJM market. For his study he uses cost data, which is not available to us.
argument that asymmetric asset distributions increase market power had previously been raised by Green and Newbery (1992). Green (1996) explicitly considered the impact of asymmetric holdings of generation assets on spot market prices in a calibration of a supply function model to data of the UK electricity market. Unfortunately, the impact of asymmetries in the distribution of generation asset on spot market prices is di¢ cult to test empirically due to the lack of variation in the distribution of those assets across …rms. In contrast to these previous studies we are focused on the e¤ects of vertical integration. Since there is much greater variation in the demand shares and therefore in the net-demand positions of di¤erent electricity companies than there is in capacities, it is possible to identify the impact of asymmetries.
The rest of the paper is structured as follows. Section 2 describes a simple theoretical model that illustrates most of the qualitative strategic e¤ects at play and derives the basic propositions. Section 3 describes the institutional features of the Spanish electricity market. Section 4 adapts the basic model of Section 2 to the speci…cities of the Spanish one day ahead electricity spot market, allowing for the existence of a signi…cant hydroelectric generating capacity and the regulatory rules that a¤ect bidding incentives. We also describe the data in this section. In Section 5 we discuss the estimation results and in Section 6 we measures the e¢ ciency losses from the exercise of market power. Section 7 concludes.
In the Appendix we discuss some of robustness issues and theoretical caveats that may in‡uence the interpretation of our results.
2 An Illustrative Model
There are essentially four separate economic activities in electricity markets: generation, transmission, distribution and retailing (often called supply). Even under electricity liberalization transmission and distribution are considered natural monopoly activities and always remain regulated. These services are paid …xed per unit access prices by the retailers. Generation and retailing are considered competi- tive activities. While in almost all deregulatory experiments generation was immediately deregulated,
retailing has generally been liberalized only gradually. The introduction of a spot market meant that generators now directly sell their electricity to retailers (see Figure 1). The latter purchase regulated transmission and distribution services as separate inputs for electricity retailing. By the rules of the spot market virtually all electricity produced has to be sold into the spot market and retailers have to purchase all their electricity from the spot market. Our analysis focuses on the interaction of generators and retailers in the spot market and its implications for the e¢ ciency of electricity supply.
The main feature of interest of the Spanish electricity market for our analysis is that the major competitors are active both in generation and in retailing. This potentially generates market power both on the buyer and the seller side of the market. In this section we develop a simple duopoly model of supply function competition that has these characteristics. In section 4 we adapt this model to the idiosyncratic features of the Spanish electricity market. Yet, the basic mechanism driving the qualitative results of the extended model will be the same as in this illustrative model.
Every generator iis integrated into downstream retailing. Demand from his customers is given by
iD(pi). We assume that the …nal consumer price is predetermined by contract or regulation pi = p, re‡ecting the fact that downstream prices are set much less frequently than spot market prices. For ease of exposition we normalize D(p) = 1. The demand parameter i is randomly distributed on some interval[ i; i], where we allow for i =1:We will refer to it as the state of retailing demand for …rm i. We allow i to be correlated between …rms. There is a set of signals about the state of retail demand of the form k = l+"k, k = 1; :::; K, where l is either i or j, and Ef"kg = 0. Each …rm receives a subset of these signals denoted by Ii for …rm i, which is …rm i’s information set. For our model the only relevant signals are those which contain private information about the rival’s downstream demand.
Hence, without loss of generality, we reduce the set of signals in our illustrative model to one for each
…rm, where the signal for …rm i has the form i = j +"i.4 We assume that the distributions of the parameter vector ( i; j)and the signal vector are such that the posterior for i, i.e. Ef ijIjgis linear
4Note that the signal about …rmi’s own demand would contain information about …rmj’s demand when demands are correlated. We have chosen our formulation to make the illustrative model more transparent.
in the signals observed.5
Firm i produces electricity with the total cost functionCi(qi) =c0iqi+c1iqi2
2. A …rm’s strategy set consists of a set of supply functions of the form Si( ;Ii), whereSi is increasing and di¤erentiable in . For any information setIi, this function speci…es how much electricity the …rm is willing to produce for all possible spot market prices .
The upstream generation market is run by a spot market operator who obtains direct information about total market demand = i + j.6 He also receives the supply functions submitted by the two
…rms. He then sets the price such that the market is cleared:
=Si( ; Ii) +Sj( ; Ij). (1) An electricity generator obtains Si( ; Ii) Ci(Si( ; Ii))of pro…ts from selling electricity in the spot market. In addition he receives (p ) i from distributing electricity to the end user for which he receives the pricepand pays the spot market price . Firms maximize the joint pro…ts from generation and retailing by simultaneously submitting their supply functions to the spot market operator taking the supply function chosen by the rival as given. Each …rm will, therefore, perceive that a change in their supply function will a¤ect the equilibrium spot market price the spot market operator sets via the market clearing condition (1).
Maximizing pro…ts over a function space is potentially a di¢ cult problem to solve. Klemperer and Meyer (1989) have shown how to reduce such a problem by substituting in for the supply function of the …rm from the market clearing condition. Then the problem can be solved by choosing an optimal price for every realization of an uncertain parameter, provided that the optimal spot market price is monotone in the uncertain parameter. Except for the changes in incentives due to vertical integration, our model would be equivalent to that of Klemperer and Meyer (1989) if all signals were common to
5This implies thatEf ij jg=Ef ig+ [ j Ef jg], where is the correlation coe¢ cient between i and j.
6Assuming that the spot market is cleared on the basis of realized demand is a simplifying assumption allowing us to exposit the basic economic e¤ect at play in the simplest way. In section 4 we will change this assumption to re‡ect the true structure of the Spanish spot market mechanism. As will be clear later, the basic mechanism is still at work in that modi…ed model.
both players so that there would be no private information.7
When there are private signals a …rm does not only face whatever uncertainty exists in the total demand (as in Klemperer and Meyer), but is also uncertain about the realization of the supply function of its rival.8 In order to use their techniques to solve the …rm’s maximization problem and derive explicit equilibrium behavior, we restrict attention in this paper to the analysis of equilibria in supply functions Si( ; Ii) that are linear in all of their arguments:
Si( ; Ii) =s0i +s1i i+si ; (2) The intercept of the supply function has a deterministic components0i and one component that depends on the signal observed. The latter corresponds to the signal that is observed by …rmiprivately.9
By restricting ourselves to linear supply functions we can generate a residual demand for …rm i in the spot market that depends additively on a random shock as is the case in Klemperer and Meyer (1989). This residual demand for …rmiis given by:
Sj( ; Ij) = s1j[ j Ef j jIig] fSj( ; Ij) s1j[ j Ef j jIig]g (3) De…ne the random variable i by i s1j[ j Ef j jIig]. All the uncertainty faced by i in its residual demand is captured by the random variable i. In other words, i is a su¢ cient statistic for the state of the spot market for …rm i. For any given we can, therefore, write the residual demand for …rm ias i EfSj( ; Ij)jIig.
Note that, for a higher i, the residual demand curve shifts upward and the unique optimal quantity will lead to a higher equilibrium price. Because of this monotonicity we can express …rm i’s problem simply as maximizing pro…ts pointwise with respect to for every possible realization of i:
7Readers familiar with Klemperer and Meyer (1989) will note that in their model there exists no equilbrium for the case of completely inelastic demand. This is not the case in our model due to vertical integration into downstream retailing.
8Formally, instead of analyzing Nash equilibria in supply functions we solve for Bayesian Nash equilibria.
9Note that we are making two separate linearity assumptions. First, linearity in the private signal is a standard assumptions that allows the derivation of equilibrium in Bayesian games (see for example Vives 1987, Gal-Or 1987).
Second, we assume linearity in price. Given the linearity of marginal costs and demand, an equilibrium that is linear in price will be the only one robust to the support of the underlying uncertainty. The linearity assumption can always be interpreted as a local approximation.
max
( i;Ii)EfEf[p ] i+ [ i EfSj( ; Ij)jIig] Ci( i EfSj( ; Ij)jIig)jIi; ig jIig, (4) Such pointwise maximization of (4) yields the following …rst order condition for every i
Ef i jIi; ig+Si( ; Ii) ( c0i c1iSi( ; Ii))sj = 0 (5) where we have substituted Si( ; Ii)for i EfSj( ; Ij)jIigfrom the equilibrium condition. From this
…rst order condition we immediately obtain our …rst result:
Proposition 1 Suppose …rm j uses a linear supply function. Then, …rm i in a state (Ii; i) will be producing at price exceeding (below) marginal cost if and only if …rmiis a net supplier (net demander) of electricity in the spot market equilibrium. Furthermore, …rm iprices on average below (above) marginal cost if and only if it is on average a net demander (net supplier).
Proof. It follows directly from (5) thatSi( ; Ii) Ef ijIi; g>0()( c0i c1iSi( ; Ii))>0and the same for the reverse sign. On average net supply to the market must be equal to the unconditional expectation EfSi( ; Ii) ig. Since Ef( c0i c1iSi( ; Ii))sjg = Ef( c0i c1iSi( ; Ii))gsj by the linearity of j’s supply function, the same argument as before can be made for the unconditional expectations.
Proposition 1 captures the essential strategic issue in this market. If a generator would expect to sell exactly as much into the spot market as he takes out of the spot market as a retailer, there would be no reason at the margin to increase or decrease production to in‡uence the price. Any marginal change in production, to the …rst order, will only e¤ect a redistribution between the upstream and the downstream parts of the same business. When a …rm expects to be a net supplier, then it has an incentive to hold back production, because this redistributes rents from net demanders to this …rm.
Holding back production results in a price increase from which the …rm bene…ts on its net sales into the spot market. This is the standard oligopoly incentive to reduce production. The opposite is true
for net demanders. A net demander has an incentive to overproduce in order to reduce the price paid on the net-purchases on the spot market. This is an oligopsony e¤ect. It will make a net demander produce up to a point where price is below marginal cost.
The reader should note that this e¤ect does not depend on the supply function set up. Any model of the spot market that takes vertical integration into account will have the feature that incentives are driven by the net demand positions of the …rms. The supply function model has the advantage of leading to an estimating equation that has few parameters and from which we can infer the structural parameters of the model.
Despite the fact that …nal consumer demand in our model is totally inelastic due to predetermined downstream prices (either due to contracts or to regulation), the interaction of oligopoly incentives for net suppliers and of oligopsony incentives for net demanders will lead to an important ine¢ ciency in generation when there is signi…cant market power: e¢ cient units of production will be held back, while ine¢ cient units will be bid into the market due to the oligopsony incentive.
In the absence of market power in the electricity spot market, the downstream demand positions should not matter at all. Any …rm would take the spot market price as exogenously given and not a¤ected by its own choice of supply function. Maximizing (4) state by state would then simply generate a non-random linear supply function that has the same slope as the marginal cost curve sci = c1
i1. We
can therefore conclude:
Proposition 2 A …rm will condition its supply function on the state of downstream demand and on signals about demand in general only if it has market power in the electricity spot market.
To obtain more insight on the impact that the downstream distribution of retail demands has on the exercise of market power in the electricity spot market, we now analyze equilibrium behavior. We show that there exists a unique supply function equilibrium that is linear in price and the signals. To obtain such linearity in the best response of …rmi to a linear supply function of …rmj it is clear that
we needEf i jIi; ig to be linear. But i is just a linear function of and the signals that are privately observed by j. Our assumption on the linearity of posteriors then directly implies that Ef i j Ii; ig takes the linear form:
Ef ijIi; ig= i0+ i1 i+ i i (6)
Replacing i in equation (5) bySi( ; Ii) +EfSj( ; Ij)jIigfrom the market clearing condition yields:
Ef i jIi; Si( ; Ii) +EfSj( ; Ij)jIigg+Si( ; Ii) ( c0i c1iSi( ; Ii))sj = 0. (7) Since the …rst order condition (7) has to hold for every , the …rst derivative of (7) must be zero.
Assuming that competitors set linear supply functions (6) implies:
i (Si0( ; Ii) +sj) +Si0( ; Ii) sj[1 c1iSi0( ; Ii)] = 0 (8) Equation (8) determines the slope of the supply function of …rm i. Clearly, this only depends on the constants i and ci1 as well as on the slope of j’s supply function sj, which we have assumed to be linear. Hence, the slope of the optimal supply function of …rm iwill be a constant, independent of the signals received. Setting si = S0i( ; Ii) we can solve for the equilibrium slopes of the supply functions of …rms iand j from the system of equations implied by (8). This yields:10
si = 2( i + j ) ci1+cj1+ i j [ci1
i
cj1
j ] (9)
Note that the slope of the two …rms are the same up to the expression[ci1
i
cj1
j ], which determines the degree to which supply function slopes di¤er in equilibrium.
Note that i will depend, via Bayesian updating, on the slope of the rival’s supply function sj. Keeping this in mind, we can gain an understanding of the implications of expression (9) by considering a limit case: Suppose that …rms observe no private signals of demand, i.e. i = and assume that
i and j are perfectly correlated. Then i0 and i1 in (6) are zero and i is simply given by the downstream market share of …rm i, i.e. i + j = 1. In this case (9) is easily interpretable. If …rms
1 0Solving forsj and replacing it in the F.O.C we can then solve fors0iands0j.
are symmetric, i.e. ci1 =cj1 and i = j = 12, the whole expression collapses tosi = c1
i1, the slope of the perfectly competitive supply function. Intuitively, with completely symmetric …rms, we must have a symmetric outcome. But then every …rm will have a zero net supply position in equilibrium and market power e¤ects are irrelevant. Now consider inducing an asymmetry in the demand position keeping costs symmetric. Clearly if …rm i has the larger downstream market, i > j , …rm i will have a steeper supply curve. Similarly, holding the demand side symmetric, i.e. i = j = 12, the …rm with the
‡atter marginal cost function will have a steeper supply function. The more e¢ cient …rm will want to expand output more strongly as a response to market shocks. Overall, we may get opposing e¤ects from the downstream market share and the slope of the upstream cost function. Which …rm has the steeper supply function will be determined by the relative size of ci1
i . Note that even with identical slopes of the supply functions, i.e. ci1
i = cj1
j , the equilibrium response to demand shocks is distorted from that of perfect competition: For any given total production, the …rm with the ‡atter marginal cost function does not produce enough, while the …rm with the steeper marginal cost function produces too much.
Unfortunately, the interpretation in terms of i as a market share breaks down in a more general setting with imperfect correlation or private signals. To see this, consider again the case of perfect correlation. In contrast to the previous case we now allow for private signals. In this case i < i, i.e. it falls below the average market share of …rm i. The reason is that i is no longer a perfect signal for i and Bayesian updating requires that i falls relative to the case without private signals. It is nevertheless possible to generate some characterization results that allow one to make predictions about the relative slopes of the supply functions for di¤erent …rms from observable data.
Proposition 3 shows that even in the more general settings, the general intuition about symmetric
…rms carries over when looking at average behavior:
Proposition 3 Suppose …rms are ex-ante symmetric in the sense that Ef ig = Ef jg, ci0 = cj0, ci1 =cj1, and i = j . Then …rms are neither net suppliers nor net demanders on average and price equals on average the marginal cost of production.
Proof. Given the assumptions of the proposition it follows that s1i=s1j from (9). Now consider the determination ofEfsi0g. From (7) and (8) and the symmetry assumption we have:
Ef ijIi; Si( ; Ii) +EfSj( ; Ij)jIigg ( is1i+ js1j) + [Si( ; Ii) s1i ]
+(c0i+c1i[Si( ; Ii) s1i ])s1j = 0.
(10)
Taking unconditional expectations and imposing symmetry on the slopes of the supply functions yields:
Ef ig 2 s1Ef g+Efsi0g+ (c0i+c1iEfsi0g)s1= 0
It follows from the assumptions stated in the proposition that Efsi0g = Efsj0g. Now note that this implies that:
EfSi( ; Ii)g Ef ig=EfSj( ; Ij)g Ef jg= [EfSi( ; Ii)g Ef ig]
where the …rst inequality follows from the symmetry of the supply functions just derived and the second follows from the market clearing condition. It then follows that EfSi( ; Ii)g = Ef ig in equilibrium and, hence, Ef g =EfCi0(Si( ; Ii)g, by the …rst order condition of the …rm’s maximization problem.
This proposition does not claim that …rms will always produce at marginal cost in a general setting.
On the contrary, …rms will, generically, be either strict net demanders or strict net suppliers for almost every realization of the demand parameters.
Proposition 3 provides a convenient benchmark to assess what would happen if we introduced some degree of asymmetry into the model. Suppose …rst that just the expected level of downstream demand di¤ered between the two …rms, but nothing else. Then, following the reasoning of the above proof, it is easy to show that the …rm with the higher expected downstream demand will become a net-demander and will, on average, produce up to a point where marginal cost exceeds price. This means that …rms with larger downstream market share will be more likely to be net demanders and to price below marginal cost. It is more di¢ cult to relate the relative slopes of the di¤erent …rms to the net demand position. But if one …rm has both a lower c1i
i and a higherEfs0igthan the other, then it will produce
below marginal cost and will be a net demander. While this does not imply that any net demander has a steeper slope of the supply function, it does seem to make it likely that net demanders will also have steeper supply functions.
3 A Description of the Spanish Electricity Market
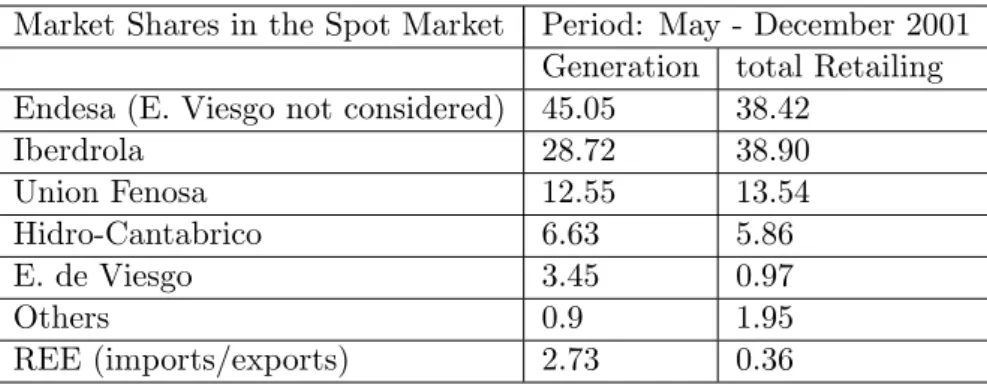
The Spanish electricity market is highly concentrated. During the period of May-December 2001, four
…rms (Endesa, Iberdrola, Union Fenosa, and Hidrocantabrico) account for 92.95% of the generation sold into the spot market and 96.72 % of total electricity sold at the retailing level (see Table 1).
Market Shares in the Spot Market Period: May - December 2001 Generation total Retailing Endesa (E. Viesgo not considered) 45:05 38:42
Iberdrola 28:72 38:90
Union Fenosa 12:55 13:54
Hidro-Cantabrico 6:63 5:86
E. de Viesgo 3:45 0:97
Others 0:9 1:95
REE (imports/exports) 2:73 0:36
Table 1: Statistics for generation, retailing and distribution sold and bought in the spot market by each of the Spanish electric …rms when adding generation by co-ownwership plants according to the fraction of the plant owned.
This high degree of market concentration, particularly among the two largest …rms, led to signi…cant concerns about market power at the time of liberalization.
On the generation side there is a mixture of technologies used for power production. The most important of these are coal (33% in share of total energy consumed in 2001) and nuclear (31%). Due to geographical characteristics of the country, Spain has a high proportion of hydroelectric production (19%).11 The role of modern CCGT technology was minimal in 2001.
Generation units belong to one of two possible regimes. Generating units in the “normal” regime
1 1Most of the remaining electricity is fuel-oil, and energy produced out of renewable sources. Source: CNE annual report for 2001.
sell all their production into the spot market.12 Units belonging to the “special”regime (14.8% of total production in 2001) bypass the pool completely. This includes renewable and other “green”energies but also many types of cogeneration and excess sales from industrial …rms generating electricity for their own use.
Electricity produced by special regime generators have to be purchased by the local distribution company in the area in which the generator is located. The distribution company has to pay the monthly average price of the daily market plus a regulated subsidy for any electricity these generators decide to sell (see Real Decreto 2818/1998). Since generators in the “special” regime are small, i.e.
limited to a maximal capacity of 50MW, production decisions can be considered non-strategic.13 The retailing market consists of two parts. Small users of electricity like individual households have to purchase electricity at regulated retail prices from the local distribution company. Larger users of electricity (“quali…ed consumers”) have several options: First, they can buy electricity through an intermediary (i.e. an unregulated retailer other than the local distribution company); Second, they can buy at regulated retail prices from the local distribution company. Third, they can buy electricity directly from the centralized market by placing demand bids (see …gure 1). In 2001, there were no quali…ed consumers who made use of the latter option.14 As part of the Spanish liberalization process, the critical consumption level determining quali…ed consumers has been lowered successively until it included consumers of any size at the beginning of 2003 (Real Decreto-Ley 6/2000, June 23rd). In 2001 the critical consumption level was 1 Gwh/year. At that time, unregulated retailers accounted for 32.1%
of electricity purchased in the spot market.15
1 2There is the possibility of writing “physical contracts” with large end users directly. The market for physical contracts represented in 2001 on average less than .5% of total electricity consumed in every hour of the day and never accounts for more than approximately 2% of the market. Physical contracts simply mean that the transaction does not go through the centralized market. However, there is an obligation to provide the amount of electricity agreed upon in the contract on the side of the generator and to take up that amount on the side of the end user.
1 3The “special” regime allows the government to subsidize certain forms of electricity production. The limit of 50MW capacity does not apply to renewable generation but since these units seem to always bid all their production there appears to be no strategic impact on the spot market price. This does not mean that there are no strategic investment decisions on these technologies but our sample period is too short for these e¤ects to matter.
1 4Quali…ed consumers can also write a physical contract directly with an electricity generator (see footnote 12).
1 5Source: REE Annual Report 2001. Unregulated retailers include the retailing subsidiaries of the generation companies.
Physical contracts
Pool (Market Operator) Generation
Retailers
(unregulated demand)
Distribution Companies (regulated demand)
Qualified Consumers Consumers at
regulated prices
Figure 1: A Stylized Picture of the Spanish Electricity Market
The spot market (known as the “pool”) consists of a sequence of markets for and at di¤erent times of the day. The bulk of the energy (around 90% for 2001) is traded on the “daily market”. The daily market opens the day before actual production takes place. In this market …rms submit, for every generating unit they control, an increasing supply function for every hour of the day. Demand in the daily market comes from demand side bids of retailers and distribution companies for each hour of the day. Bid functions must be monotonic step functions with at most 25 steps. The market operator aggregates the demand and supply functions and sets the daily market price at the lowest price at which the aggregate demand and supply functions cross. All production units o¤ered below this price and demand bid above this price are liquidated at the equilibrium price.16
1 6After the market clears, the system operator will make sure that the production plan obtained from the daily market is feasible given the transmission constraints in the system. If transmission constraints are binding they are resolved by
The clearing of the “daily market”, obviously, will not guarantee that the market clears in real time.
For this reason …rms have to submit step supply functions and step demand functions for real time market clearing. If in real time the total production cleared in the daily market falls short of realized demand, the system operator uses the supply functions to determine which …rms expand production.
If, in real time, committed production is in excess of realized demand, the system operator uses the demand functions to determine which …rms decrease their production level. In each case the system operator determines a real time price by intersecting the bid functions with the inelastic real time demand. Marginal trades in the real time market are executed at these real time prices.17 Our paper focuses on the operation of the “daily market”. Although we are aware that there can be strategic interactions in sequential markets (see Kühn and Machado, 2000), we will ignore this possibility for the purposes of this paper.
There are a number of special features of the Spanish electricity market that we need to take into account in order to adapt our basic model. The most important of these is the recovery of the so called
“costs of the transition to competition”(CTCs). As part of the negotiations between the government and the incumbent generation …rms before liberalization in 1998, it was agreed that generators should receive a compensation for pro…t losses due to the introduction of competition.18 There has been continued discussion over the years about how much should be paid to generators and how these payments should be …nanced. In our sample period (i.e. May 2001 to December 2001) we have a single regime. Essentially, the pro…ts of the distribution companies are taxed away and redistributed to generators according to percentages set by law. Retailing pro…ts from the regulated part of the market accrue to the …rm in the
replacing generating units with the cheapest units that solve the constraint. We will abstract from this issue in this paper.
1 7In addition there are six “intra day” markets that sequentially open after the daily market closes. In these markets previously made production and demand commitments can be modi…ed over time as new information about demand and availability of generation plants arrives. Each one of these markets works technically like the daily market with the only di¤erence that supply and demand functions can only have 5 steps. All trades are executed at the price that clears each market. However, in this market demand units can sell previously committed demands and generators can purchase electricity to reduce production commitments. The net result of the daily and intra daily markets in terms of production and demand commitments establishes the …nal production plan before the real time markets open.
1 8Sometimes this was justi…ed by a stranded assets argument: Generators had made government mandated investments in generation plants under the old regime, that they argued would not be pro…table in a competitive environment.
form of CTC compensation whereas pro…ts from unregulated retailing will remain with the …rm. CTCs have a big impact on the incentives of the …rms when bidding on the spot market because the regulated part of the market covers 65% of total demand.19 This is highlighted by a comparison between Table 1 and Figures 2 and 3. According to Table 1, Iberdrola is a net-demander on average and Endesa a net supplier. However, CTCs modify the e¤ective net demand position. As can be seen from Figures 2 and 3 Endesa is now most of the time (81.5%) an e¤ective net demander while Iberdrola frequently switches between being a net demander and a net supplier.
MWh
Evolution of Iberdrola's net-demand position
time
1 5640
-3757.02 1766.44
Figure 2:
1 9A further complication arising from CTCs comes from a potential direct e¤ect on the price of the daily market. The law stipulates a maximum for the total aggregate compensation paid to generators in the form of CTCs until 2010. This amount may be reduced in the event that the annual weighted average spot market price received by …rms exceeds 6 pts/Kwh. It should be clear that the impact of each day’s strategy on this average must be minimal. In addition, Unda (2002, section 2) argues that given the low CTC payout to generators in 2001 and the distribution de…cits in 2002, …rms would not expect to recover the full stipulated amount of CTCs by 2010 in any case. For that reason an increase of the average weighted spot market price above 6 pts would not be perceived as having the e¤ect of reducing the total amount of CTCs that would eventually be paid. Therefore, we do not model this aspect of CTCs.
MWh
Evolution of Endesa's net-demand position
time
1 5640
-1505.52 2975.18
Figure 3:
Another feature of the Spanish market that cannot be ignored in the modelling is the presence of cross-ownership for some generating units. Production from jointly owned plants accounts on average for 28.6% of total production of which 90% comes from nuclear plants and 10% from non-nuclear thermal plants. The prevalence of nuclear technology in jointly owned generation plants implies that the strategic e¤ects from jointly owned production will be small since nuclear capacity is always fully bid in as base load.
Finally, the model in the next section also deals appropriately with dynamic issues arising from hydroelectric production. In our sample, hydroelectricity represents between 7% and 17% of Endesa’s hourly production and between 9% and 32% of Iberdrola’s hourly production. Iberdrola uses hydro- electricity extensively as the marginal technology.
4 Implementing the Supply Function Model Empirically
In this Section, we adapt the theoretical model developed in Section 2 to the speci…c features of the Spanish electricity market and develop the empirical strategy that allows us to identify the structural parameters of the model from the available dataset. We proceed by separately modelling the pro…t
terms that arise from retailing and generation.
4.1 The retailing side of the market
Firm’s obtain pro…ts from the regulated and the unregulated retail market. In the unregulated retail market, …rmihas a set of customersBi, with whom it has established retailing contracts. Each customer b 2Bi faces a …nal electricity price pbt , where t refers to the day and refers to the hour of the day.
Demand from a customer b at time t is given by Dbt (pbt ) = bt Db(pbt ) where bt is the random component of demand from customerb at time t . Total unregulated retail demand faced by …rm iis then written as Ditu =P
b2Bi bt Db(pbt ). We assume that the demands from these retailing contracts are completely inelastic in the spot market price t . This assumption is obviously not exactly satis…ed in the real data. However the estimated spot market demand elasticities with respect to the spot market price are never larger than 0.09.20 In the Appendix we show that they can safely be approximated by zero and we show that our empirical tests are robust to assuming elastic demand.
In the illustrative model of section 2 we assumed that the realized demand was bid into the spot market. However, in the Spanish market, …rms bid a forecast for the next day’s demand into the spot market. Market clearing is based on these forecasts. Let Iit be the information that …rm i has the day before day t. Then its expected demand from the unregulated part of the retail business will be EfDuit j Iitg. We assume this demand forecast is truthfully bid into the market.21 In addition the
…rm truthfully bids its expected regulated demandEfDrit jIitginto the daily market. This part of the demand is totally inelastic due to regulation.22
2 0Wolfram (1999) cites that Wolak and Patrick (1997) found short run elasticities for customers that hold pool price related contracts in one the UK REC areas not bigger than 0.30. She also claims that her “calibrated” elasticity of 0.17 is within the values found in Lester D. Taylor (1975) and E. Rapahel Branch (1993). Moreover her demand estimates (using nuclear availability as an instrument for price in the demand equation, instrument which she admits is “noisy”) produce a short run elasticity at the average values of 0.1. Similarly to our data, Wolfram’s elasticity estimates were not very sensitive to the linear demand or constant elasticity assumptions. Finally, Mansur (2001) …nds an elasticity of demand (to lag prices) of around 0.096 which he admits may be biased downwards due consumers expectations of a retroactive rebate.
The low observed elasticity has led a number of authors to assume contracts that are completely inelastic relative to the spot market price (see Hortacsu and Puller, 2004, Mansur, 2003 and Wolak, 2003).
2 1We are disregarding the potential strategic incentives for demand bidding in this paper (see Kühn and Machado, 1998).
2 2In practice, the regulated demands are bid in at the maximum price allowed by the rules of the market.
The revenue of the distribution companies comes from access fees for providing the distribution service in a given geographic area and from retailing to the regulated part of the market in that area.
The costs of the distribution companies consist of the distribution costs plus the costs of purchasing the electricity it sells to the regulated part of the market. Note that the pro…ts of a distribution company are therefore largely determined by the regulated retail price and the realized prices in the pool. Whatever surplus there is, it is used to pay subsidies to the generating …rms. These consist …rst of a subsidy for domestic coal use. What is left after the payment of the coal subsidy is distributed according to the pre set CTC percentages. This strips the distribution companies of any pro…ts.
All distributors are owned by the four largest upstream generating companies. But since distributors are stripped of their pro…ts, all pro…ts arising from the regulated side of demand appear on the balance sheet as CTC compensations.23 As a result, a …rm views pro…ts from retailing to the regulated part of the market (for any transaction in the pool) as depending on total regulated demand and not on its own regulated demand. As noted in Section 3 this changes the e¤ective demand position of the …rms.
If the share in CTCs of …rmiis given by i, then the CTC payment generated at time t from the regulated demand bid into the spot market is given by:
i
X
j
(p t cjd)EfDrjt jIjtg , (11) wherecjd are the marginal distribution costs of …rm j and p is the retail price in the regulated part of the market.
Moreover, distributorj has to buy the electricity produced by generators in the special regime,Stej, in their area at the monthly average hourly price in the daily market plus a regulated subsidy and sell
2 3Since CTCs are calculated from residual pro…ts of the distribution companies they can be negative. In this case, distribution companies are reimbursed by the generators. The pre-set CTC percentages di¤er in this case from a situation with positive CTCs. In the empirical part of the paper we assume that expected CTC payments at the time of decisions in the daily market are non-negative, so that there is a single set of CTC shares. At least until the end of October 2001 the aggregate distribution pro…t over the year was positive. However, aggregate distribution pro…ts turn sharply negative at the end of the year. There was some discussion whether the government should cover such a de…cit and, at the end of 2002 the government accepted the petition by the generators to do so. If this was anticipated in 2001, then …rms may reasonably have ignored the de…cit CTC payment percentages. (See CNE 2002, “Informe sobre los resultados de la liquidacion provisional no 10 de 2002 y veri…caciones practicadas”.)
this electricity on to …nal customers at pricep.24 Collecting terms in these payments that involve the price t , the CTC payment generated in period t can be written as P
j(p t cjd)Sej , where Sej is the monthly average of production from the special regime purchased by …rmj. The total CTC payment attributable to period t for …rm ican then be written as:
CT Cit ( t ; It) = i
X
j
(p t cjd) EfDrjt jIjtg+Sej +kj , (12) whereIt is the vector of information sets of all …rms and kj a term that does not depend on t .25
We will also allow for contracts for di¤erences (or forward contracts), i.e. pure …nancial instruments that allow hedging the spot market risk. There is a set of hedge contracts …rmiholds,Bhi. A contract b 2 Bih speci…es the number of units Dbt and a …xed forward price pbt . The …rm promises a¤ect the behavior of …rms in the spot market (see Wolak, 2000). We do not have any data on these contracts, but they can be treated as an unobservable component of marginal cost.26
4.2 The Generation Side of the Market
LetSit be total production of electricity by …rmiandhit the amount of hydroelectric generation (both in MegaWatt hours). The cost functionCi(Sit hit )27 denotes the costs of non-hydro production of
…rmi. We maintain the assumption that marginal costs are linear but now allow for an additive shock
2 4Note that the total expected demand of …rmiin the regulated retail sector is given byEfDrit jIitg+EfSeit jIitg, since downstream demand is served …rst by electricity from the special regime.
2 5Strictly speaking distributors pro…ts include access fees from unregulated demand that other …rms sell in …rm i’s distribution area as well as the payment of supply subsidies on electricity bought from generators in the special regime.
From the point of view of setting supply functions in the daily market these will be seen as …xed costs, i.e. they do not interact with ;and, therefore, do not a¤ect optimal choices. We consolidate these terms in the termkjin order to simplify notation.
2 6As in Hortacsu and Puller (2004) these may be part of the …rms’ private information and thus contribute to the residual demand uncertainty.
2 7Strictly speaking,Sit should include the production from jointly owned generation plants weighted by ownership share ( P
n2Pi
nSn);wherePi represents the set of plants where …rmihas a less than a 100% share and n is …rmi0sownership share in plantn. Likewise, the production from co-owned plants would enter the cost function in the following way:
Ci(Sit hit
X
n2Pi nSn)
For the moment we abstract from this because it only complicates notation. It is straightforward to include the production from co-owned plants in the analysis (see appendix). All our empirical results presented in Section 5 include the correct speci…cation.
which is observed by the …rms: Cit0 (Sit hit ) = c0i +c1i(Sit hit ) +"cit . Note, that we also assume that there can be hourly systematic shifts in the cost function that a¤ect the constant term in marginal cost but not the slope.28 This is a crude way of accounting for the e¤ect of start up costs:
Generating units already running will have lower perceived avoidable costs of expanding production than generating units that still have to start up. We believe that this is best captured through a shift in the constant term of marginal cost. To have an e¤ect on the slope of marginal costs one would have to argue that the e¢ ciency ranking of generating units systematically changes when they are in or out.
While this is certainly true to some extent (e.g. nuclear has very high start up costs and very low marginal costs), those generators for which it may apply are mostly operating as base load suppliers, so that the ranking of generation units remains approximately constant throughout the day.
Autocorrelation in the shocks to costs should be expected in electricity generation. For example, autocorrelation may be due to an unobserved unavailability of some generating unit, which typically lasts for more than one hour.
Hydroelectricity can be produced at a constant marginal costchi+"hit, where"hit is a random shock.
The full marginal opportunity cost of hydroelectricity costs will, however, be implicitly determined by the shadow value of hydro stocks. The hydro stock, measured in units of MegaWatt hours, of …rm iat the beginning of day tis denoted byHit. There is a law of motion for the stock of hydro given by
Hi(t+1)=Hit
X24
=1
hit +rit (13)
whererit is the exogenous random net in‡ow of water reserves in units of MegaWatt hours during day t. Given thatrit has a predictable component, EfritjIitg will vary with the information …rmihas. In particular, if this component is purely seasonal, Iit will include the information about the season. We will capture all of the non-stationarity in the environment through the common components of all the information sets Iit. For estimation purposes we then only have to decide what entersIit.
2 8The empirical formulation will also allow for monthly shifts in the constant term.