energies
ISSN 1996-1073 www.mdpi.com/journal/energies Article
Design Parameter Analysis of Point Absorber WEC via an Evolutionary-Algorithm-Based Dimensioning Tool
Marcos Blanco 1,*, Pablo Moreno-Torres 1, Marcos Lafoz 1 and Dionisio Ramírez 2
1 Division of Electrical Engineering, Centro de Investigaciones Energéticas,
Medioambientales y Tecnológicas (CIEMAT), Avda. Complutense, 40, Madrid 28040, Spain;
E-Mails: [email protected] (P.M.-T.); [email protected] (M.L.)
2 Department of Automatica, Electrical, Electronic and Computer Engineering,
Universidad Politécnica de Madrid, Madrid 28006, Spain; E-Mail: [email protected]
* Author to whom correspondence should be addressed; E-Mail: [email protected];
Tel.: +34-913-357-194; Fax: +34-913-466-480.
Academic Editor: John Ringwood
Received: 6 July 2015 / Accepted: 29 September 2015 / Published: 12 October 2015
Abstract: Wave energy conversion has an essential difference from other renewable energies since the dependence between the devices design and the energy resource is stronger. Dimensioning is therefore considered a key stage when a design project of Wave Energy Converters (WEC) is undertaken. Location, WEC concept, Power Take-Off (PTO) type, control strategy and hydrodynamic resonance considerations are some of the critical aspects to take into account to achieve a good performance. The paper proposes an automatic dimensioning methodology to be accomplished at the initial design project stages and the following elements are described to carry out the study: an optimization design algorithm, its objective functions and restrictions, a PTO model, as well as a procedure to evaluate the WEC energy production. After that, a parametric analysis is included considering different combinations of the key parameters previously introduced. A variety of study cases are analysed from the point of view of energy production for different design-parameters and all of them are compared with a reference case. Finally, a discussion is presented based on the results obtained, and some recommendations to face the WEC design stage are given.
Keywords: wave energy; point absorber; WEC dimensioning; differential evolution
1. Introduction
The total wave energy potential of the world’s oceans is estimated in the order of some TW [1,2]
and the technologies to use it have been developed during centuries (the first patents on ocean wave energy extraction dated back to 1799), and the present R & D interest and efforts started in the 70s [3,4].
The participation of big companies in this sector, as well as the creation of joint ventures to collaborate on big projects, reflects the increasing interest in this resource. However, the cost of wave energy is still too high to be competitive [5] and there are some challenges to be faced, such as the survivability or robustness of wave energy converters (WEC) or the reduction of their installation and maintenance costs.
Another indicator which reveals the advance of marine technologies is related to the guidelines and standards that have been developed during the last years (EQUIMAR [6] or Carbon Trust [7] guidelines, EMEC [8] or IEC standards [9]). These guidelines are based on the experience of previous R&D projects which have led to recommendations ensuring the success of new projects. For example, [10] proposes a scheme of R&D project for the development of a new wave energy converter (see Figure 1).
In this scheme, one of the key stages is the dimensioning of the converter, which is quite important in this type of energy since it is very dependent on numerous operation parameters.
Figure 1. Project Development Stages Flow-Chart Scheme Example of a R&D WEC Development Project [10].
This paper presents an analysis of design parameters by means of a previously developed algorithm for the dimensioning of the geometry of a WEC [11] to be applied in the initial project stages (STAGES 1 and 2). This algorithm (modified and extended accordingly) is used as the main tool of the parametric analysis, which is accomplished in terms of location, type of WEC, control strategy, hydrodynamic design and rated characteristics of the power take-off (PTO).
There is a strong connection between wave energy at a given location and the geometrical design of a WEC [12,13]. This implies that even for a WEC of the same type and power, the characteristics of its
PTO and its geometry will have different designs for different locations under optimized design and operation conditions. It seems reasonable to assume that similar strong connections could appear with the others analyzed parameters. Therefore, an algorithm able to carry out a preliminary geometrical design in an automatic way could prove very useful. In this point, the challenge is the translation of a real problem into a properly-defined mathematical problem.
The design algorithm is addressed as a numerical optimization problem in previous works found in the literature [14–19], including approaches such as the economic analysis of the whole design of a WEC, the dimensioning of particular equipment, the optimization of the complete water contact surface and the WEC dimensions optimization in order to take advantage of pitch movement.
In particular, the proposed algorithm addresses the geometrical design as a mathematical optimization problem in which the search space comprises the dimensions of the WEC. The procedure introduced for the parametric analysis is based on a methodology that considers some fixed parameters such as location, PTO characteristics or WEC concept [20–22]. That methodology can also be used for the selection of an optimum PTO for a certain WEC [23] considering exploitation criteria, as well as the study of the location of different WECs in a wave farm to optimize the quality of the power delivered to the electrical grid [24].
Moreover, the possibility to easily modify the restrictions and objective functions allows using the experience obtained from previous projects to get a better adjustment of the results of the parametric analysis to real scenarios. Furthermore, the objective functions could be converted into a single cost/benefit function, resulting in a useful tool for studying the economic aspects of wave energy projects during the detailed design phase (STAGE 3 in Figure 1).
2. Parametric Analysis Definition
The algorithm described is used to perform a parametric analysis (to increase the understanding of relationships between input and output variables in the design process) of certain design-parameters in a WEC. A particular example, taken from a real experimental case, will be considered as a reference case.
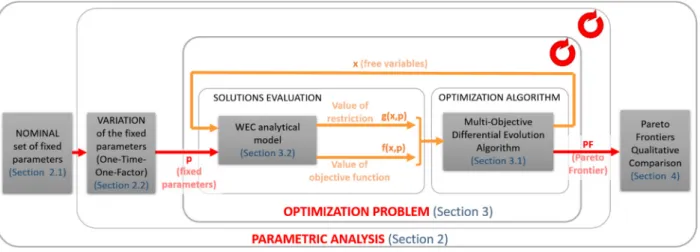
Figure 2 shows the block diagram that outlines the parametric analysis. It is carried out through an optimization problem [25,26] (the preliminary design process described in the Section 3 which is based in [11]) which uses an analytical WEC model. The objective is to obtain the combinations of the free variables x (search space variables) which fulfils the restrictions g(x,p) and minimizes the objective functions f(x,p). Besides, the WEC model uses with a set of design-parameters which work as fixed parameters p (its values remains fixed in the optimization process). In the parametric analysis, a set of design-parameters variations (Section 2.2) are defined from a set of nominal design-parameters (Section 2.1). The optimization problem is run once with each design-parameters variation in order to compare the Pareto frontiers resulting from each run.
Figure 2. Scheme of the Parametric Analysis of the Preliminary Dimensioning Process.
2.1. Reference Case Definition
The real case study corresponds to the Spanish UNDIGEN project, in which the design and manufacturing of a WEC to become the test bench for a novel PTO were undertaken. This PTO is based on a Switched Reluctance Linear Generator (SRLG) [27] and the deployment was carried out in the testing site of PLOCAN [28], at the Canary Islands in Spain. Among the design-parameters and characteristics of the project (defined in STAGES 1 and 2), the following statements applied:
(a) Generation plant with a single grid-connected WEC.
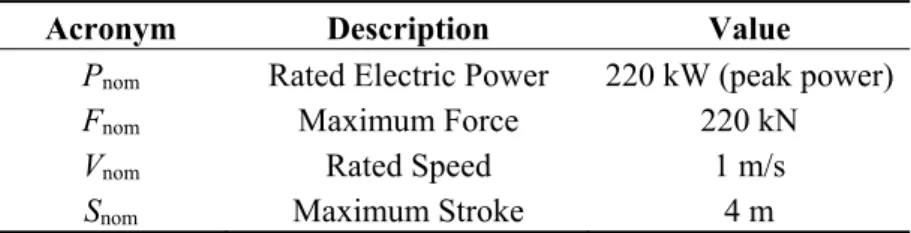
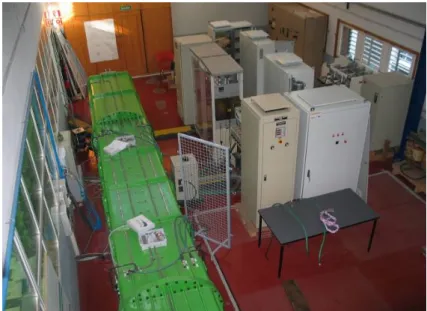
(b) The PTO had been previously defined and built. Figure 3 shows the PTO during the laboratory tests, while Table 1 contains its main parameters.
(c) The sea site for the commissioning and testing is located at PLOCAN.
(d) The WEC is a point absorber, which is one of the most suitable topologies for the installation of a direct-driven generator [29].
(e) The algorithm for power extraction is based on reactive control [3,30].
(f) The WEC design aims to match the peaks in its power-extracted frequency profile with the most common wave frequencies of the site, in order to maximize power extraction. These peak-power frequencies are related with hydrodynamic resonance frequencies and with the PTO performance [31–33].
Table 1. Switched Reluctance Linear Generator Rated Parameters.
Acronym Description Value Pnom Rated Electric Power 220 kW (peak power)
Fnom Maximum Force 220 kN
Vnom Rated Speed 1 m/s
Snom Maximum Stroke 4 m
Figure 3. Switched Reluctance Linear Generator during Dry Testing.
2.2. Parametric Analysis Set-up
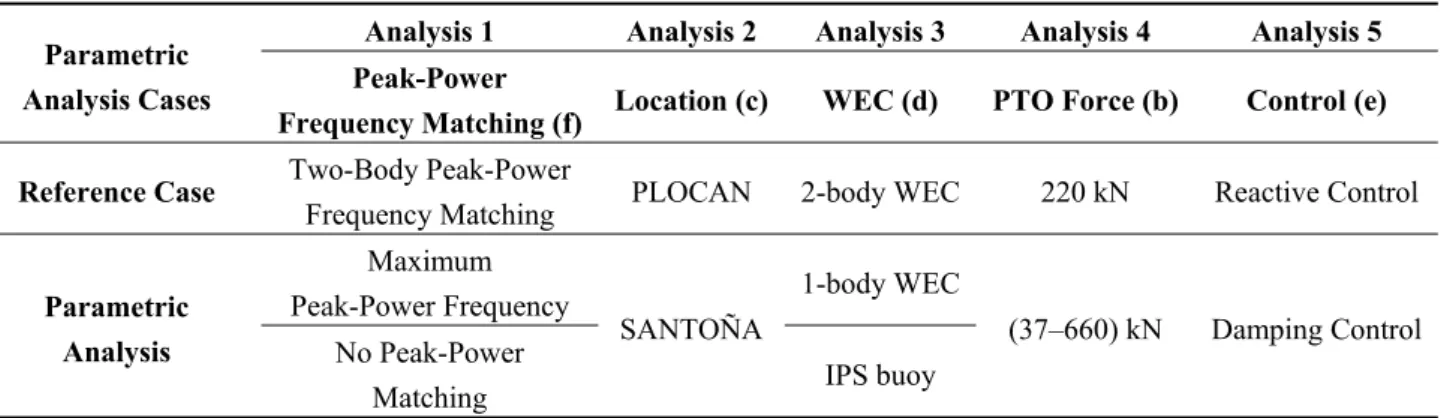
The parametric analysis is based on variations from the reference case, in particular on variations of the design-parameters (b) to (f) from the previous section, as presented in Table 2.
Table 2. Parametric Analysis description. Variations of the initial data from the reference case.
Parametric Analysis Cases
Analysis 1 Analysis 2 Analysis 3 Analysis 4 Analysis 5 Peak-Power
Frequency Matching (f) Location (c) WEC (d) PTO Force (b) Control (e) Reference Case Two-Body Peak-Power
Frequency Matching PLOCAN 2-body WEC 220 kN Reactive Control
Parametric Analysis
Maximum Peak-Power Frequency
SANTOÑA
1-body WEC
(37–660) kN Damping Control No Peak-Power
Matching IPS buoy
The analysis consists in changing one design-parameter at a time, keeping the rest of the design-parameters to their nominal values (the reference case values presented in the first line of the Table 2). After changing the value of one design-parameter (and carrying out the optimization procedure), it returns to its nominal value. Then the process is repeated for each of the other design-parameters values considered. The way to carried out the variation of the inputs in this analysis is similar to the local OFAT sensitivity analysis [34], but in the parametric analysis only a qualitative comparison of the results is accomplished. In this kind of analysis there are limitations in the information obtained. It is a local analysis which only provides information around the nominal values and does not provide information about the design-parameter. Nevertheless, a local parametric analysis is adjusted to the objective of this paper: The evaluations of the influence of certain design-parameters starting from a given reference case (in order to consider the suitability of possible modifications).
PLOCAN, a testing site with moderate wave intensity was selected as the site for the reference case.
To carry out the parametric analysis another location was selected, Santoña, also in Spain. Santoña has a higher wave energy resource, so that conclusions can be drawn about the influence of the location, both in terms of energy and occurrence diagrams.
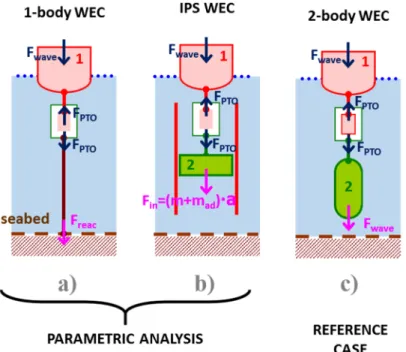
With regard to the type of WEC, the reference case consists of a 2-body point absorber (i.e., PowerBuoy of OPT [35]), since it allows for higher flexibility when considering sea depth. For the parametric analysis, the options of 1-body point absorber (i.e., CORPOWER [36]) and IPS point absorber (i.e., Aquabuoy) were taken into account. These three point absorber concepts are showed and the work principles are summarized as following. 1-body point absorber (Figure 4a) has, generally, one floating body (that interacts with the waves) and a PTO that reacts against the floating body and the seabed taking the advantage of the floating body heave motion to generate energy; 2-body point absorber (Figure 4c) has, generally, one floating body and one semi-submerged body (which experiment different interactions with the waves) and a PTO that uses the relative movement between then to generate energy;
finally, the work principle of the IPS buoy (Figure 4b) is similar to the 2-body point absorber, but its submerged body moves inside a tube and take the advantage of the water inside the tube to increase its inertia.
Figure 4. Point Absorber Configurations to Heave Energy Extraction: (a) 1-Body Point Absorber; (b) IPS Buoy; (c) 2-Body Point Absorber.
About the PTO characteristics, the parametric analysis is based on the modification of the force to be developed by it (FPTO). Due to the particular characteristics of the selected PTO (SRLG), there is scalability in terms of force, whereas a new electromagnetic design would be required to scale the speed.
Nine different cases are included in the analysis, comprising values from 37 to 660 kN. In this paper, the analysis of this factor does not consider the extra costs related with the PTO modifications (the aim of the analysis is only to understand the relationship of the PTO rated force in the WEC dimensioning process). Thus, the prime mover (the part of the WEC that interacts with the ocean waves) costs, but not the WEC global cost (prime mover + PTO), are considered in the analysis of the objective functions.
The default energy extraction strategy is an optimum (reactive) control [3]. Besides, a damping control strategy, which consists in a pure resistive control where the generator force is proportional to the speed [3], has been analyzed as well. Both strategies have been conveniently adapted to consider the PTO power losses and its rated force constraint. It is worth mentioning that the theoretic energy extraction capacity of the prime mover is directly related with its hydrodynamic ability to radiate waves, so as it depends fundamentally on its geometry. However, the control strategy has a direct impact in the energy extracted (which is one of the objective functions of the presented dimensioning method) and, besides, it introduces changes in the dynamic WEC behavior which modifies the feasible solutions area defined by the dimensioning method restrictions. Therefore, the analysis studies the relationship between the control strategy selection and the values of the objective functions resultant of the dimensioning process [37].
Finally, a WEC peak-power frequency matching the most relevant sea states (wave frequency) is considered in the reference case. In particular, the peak in the extracted-power frequency profile related with the PTO behavior (and thus, with the relative movement of the two bodies of the point absorber) matches the characteristics of the most common sea state occurrence. As many as three peak-power frequencies can appear and will be described later in Section 3.3.3. During the parametric analysis, two more cases were studied: A design of a WEC whose peak-power frequency of highest power (among the aforementioned three frequencies) matches the sea state of highest occurrence; and a comparison with a case where this matching restriction is not taken into account.
3. Preliminary Dimensioning Algorithm
The preliminary WEC dimensioning algorithm described in the paper is based on a set of previous works [11,20–23] which were focused on the obtaining of a preliminary WEC geometry design as an input of the project design stage (STAGE 3). However, the previously developed algorithm has been modified and upgraded to be used as a main tool in an automatic parametric analysis of given design-parameters. Thus, the analysis can be applied to initial project stages where these design-parameters are defined, such as Site Screening within STAGE 1 or Technology Selection and Outline Design within STAGE 2. Parametric analysis (Section 2) requires the use of the WEC dimensioning algorithm described in [11], but extended and upgraded as follows: The restriction and objective function can be activated/deactivated by the user (parametric analysis 1, Table 2); locations can be selected from public data as in [38] (analysis 2, Table 2); point absorber (prime mover) dynamic model can be selected, such as 1-body WEC, IPS buoy or inertial WEC and thus, theirs hydrodynamic coefficients are calculated for each WEC concept (analysis 3, Table 2); PTO model for selecting rated characteristics can be scaled (analysis 4, Table 2); and finally energy extraction control can be selected from different options (analysis 5, Table 2). During the project engineering stage (STAGE 3), the algorithm [11] has been applied aiming to obtain a set of WEC dimensions to be used as detail engineering stage inputs.
In this paper, however, the final objective is the obtaining of Pareto frontiers of the objective functions in order to increase the understanding of the relationships between input and output variables and to evaluate the influence of each basic design-parameter.
On balance, in this section, the WEC preliminary dimensioning algorithm presented in [11] is outlined (in order to give the sufficient information to understand the paper) and based on it, the aforementioned extensions and upgrades are presented as well.
3.1. Optimization Problem Algorithm
The problem of obtaining the WEC dimensions is framed, on the one hand, by the given design-parameters of the reference case and, on the other hand, by the proposed design-parameter variations according to the parametric analysis description (see Table 2). This problem is set up and accomplished as a mathematical optimization problem. An evolutionary algorithm solves this optimization problem through an iterative process where a set of WEC candidate solutions are evaluated in terms of objective functions and restrictions in each iteration. Depending on the results of this evaluation, the algorithm conveniently explores the search space in order to find the candidate solutions that maximize/minimize the objective functions and fulfils the restrictions.
Multi-Objective Differential Evolution Algorithm
The particular optimization-algorithm implemented is a differential evolutionary algorithm (DE) [39]
upgraded with Deb’s rules [40] to consider feasibility and modified, in the same way as the NSGA-II method [41], to evaluate multi-objective functions. The algorithm works as follows:
(1) In each iteration (generation), the DE algorithm generates a new set (population) of candidate solutions (child population, Qt) from the initial set of solutions (parent population, Pt). The definition of the new set of solutions implies the specification of the particular values of the search space variables (see Section 3.3.1 for more information). The main differential characteristic of the DE algorithm, compared with other bio-inspired algorithms, is the definition of a new set of candidate solutions where each one is obtained from mutation of two randomly chosen candidate solutions by the sum of the weighted differences between them.
(2) In a second iteration step, the candidate solutions (Qt) are evaluated, calculating their objective function values (described in Section 3.3.2) and restricted values (described in Section 3.3.3) by means of a WEC mathematical model (described in Section 3.2) characterized for some particular values of the search space.
(3) The third iteration step evaluates and compares Qt together with Pt in order to determine the initial population of the following iteration (Pt+1). Subsequently, a joint set of solutions (Rt), from Pt and Qt, is ordered in terms of the multi-objective function values (dominance between solutions) by means of a non-dominated sorting algorithm based on NSGA-II. Besides, Rt is sorted in terms of restrictions accomplishing Deb’s rules. In this way, an order is established based on feasibility, when the solution accomplishes all the restrictions, and dominance, when the solution gets better values in both objective functions. Finally, Pt+1 is composed by the best solutions of Rt.
The optimization algorithm parameters are selected as follows: The population is composed by 200 members and the optimization process runs 1000 iterations (which means 200,000 candidate solutions evaluated). A high value of this two factors are chosen in order to get a well-defined Pareto frontier and a spread area of feasible solutions for the sake of clarity in the figures of this paper. However, in order to obtain a useful set of Pareto frontier solutions, the number of iterations could be reduced due to the size and shape of the Pareto frontier, reaching a steady state in a fraction of the complete iteration process.
With the previous values, the optimization process code (implemented in MATLAB®) runs in Intel I7-2600 PC (16 GB RAM) is executed in approximately 200 min.
3.2. Mathematical Model of a WEC
The mathematical model equations allow the evaluation of each candidate solution considered during the optimization algorithm. Particularly, in the second iteration step the equations of the model should be written in a way that allow the evaluation of the objective functions as well as the variables affected by restrictions.
3.2.1. Location and Operation States
The reference case is located at the WEC test site of PLOCAN, on the west coast of Gran Canaria island (Canary Islands, Spain, longitude: 15.39° W, latitude: 28.05° N [38]). For the parametric analysis of the location, another Spanish WEC test site is selected, specifically the Santoña site (Cantabria, Spain;
longitude: −3.250° E, latitude: 43.500° N [38]). The sea state occurrence scatters diagrams of both locations are shown in Figure 5.
In the first step of the location analysis, the most representative sea states of each location are selected in order to reduce the computational load (reducing the number of sea states evaluated) of the method and for the sake of simplicity in the graphical representation of the results. Thus, the mathematical polynomial expression Equation (1) to relate peak period (Tp) and significant height (Hs) is obtained by means of a least-square approximation for both locations.
Hs = KT-H·Tp2; KT-H_PLOCAN = 0.0223; KT-H_SANTOÑA = 0.0146 (1) where KT-H is the relationship coefficient between Hs and Tp.
These two fittings are also depicted as blue solid lines in Figure 5.
Figure 5. Sea States Occurrence Scatter Diagram of: (a) PLOCAN; (b) Santoña.
Besides, the ocean waves are considered regular in order to be used as input variables of the WEC mathematical model. This simplification is applied with the aim to reduce the computational load too.
Equations (2) and (3) are used to calculate the equivalence between a regular wave and the real waves of a certain sea state while keeping constant the sea state wave energy (E) and the sea state wave power (J) [1]:
2
2 0
irregular
wave g 16
regular 2
wave g 8
s
reg s
reg
E H
E g S f df H H
E H
(2)
2 2 1,0
2 1,0
0 2
irregular
wave g 64
regular
wave ρg 32
s
g reg
reg reg
T H J
J g c f S f df T T
T H J
(3)where: ρ is the ocean water density; g is the gravity constant; Hreg is the regular equivalent wave height;
T−1,0 is the energy period; Treg is the regular equivalent wave period; S(f) is the energy wave spectrum and cg is the group velocity.
This simplification implies associated uncertainties (the influence of the power extraction bandwidth and the shape of the wave energy spectrum) which should be added to the ones related with the frequency domain model (non-linear effects or the complexity control implementation) [14,31]. Thus, the results could not be representative in terms of proper expectable power-extraction evaluation. Nevertheless, these results could be considered as indicative of the power extraction capabilities of the WEC and they can be used in a geometric optimization problem [14].
Similar approaches can be found in WEC geometry optimization procedures [14,15,42], where the WEC energy extraction in a certain range period are taking into account. However, in this paper (unlike other approaches), the regular wave amplitude is weighted to represent better the ocean wave resource at the location. This approach is considered the most representative in order to apply the different restrictions presented in the Section 3.3.3.
In summary, each value of T−1,0 or Tp is related bi-univocally with a value of Hs according to Equation (1), and each pair (Tp, Hs) has an equivalent regular representation (Treg, Hreg) according to Equations (2) and (3).
In a second step of the location analysis, the most suitable period ranges of the WEC operation profile (see Figure 6) are defined. The proposed operation profile is in accordance with the behavior of a non-controllable energy source. It is defined by means of Tmin (period of waves with sufficient energy to be worth activating the WEC) and Tmax (period of waves so energetic that they could damage the WEC) according to the following statement: The operation range, defined by Tmin and Tmax, must contain 90% of the total sea state occurrence.
Figure 6. Four Operation Ranges of Renewable Power Plants particularized for ocean wave energy. The WEC generated power profile is represented for the pairs (Hs,Tp) of the most representative sea states of a particular location.
Besides, TPmin is defined as the period in which the rated power is reached. Thus, Tmin, TPmin and Tmax
determine the 4 operational WEC ranges as depicted in Figure 6: Range I in which the WEC remains in a standby mode; Range II in which the PTO extracts the maximum power from the waves (resonance mode); Range III in which the PTO works restricted by its rated power (saturated mode); and Range IV in which the WEC remains in a survival mode Table 3 summarizes these period values for both locations.
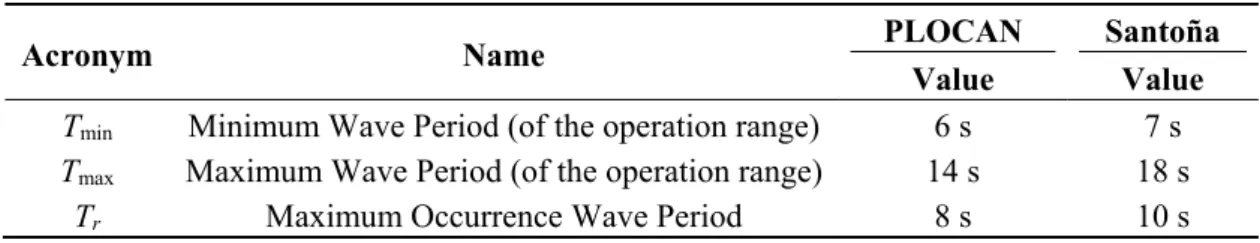
Table 3. PLOCAN and Santoña Location Characteristics.
Acronym Name PLOCAN Santoña
Value Value Tmin Minimum Wave Period (of the operation range) 6 s 7 s
Tmax Maximum Wave Period (of the operation range) 14 s 18 s Tr Maximum Occurrence Wave Period 8 s 10 s
3.2.2. Point Absorber Dynamic Model
The WEC concept considered in this paper is a point absorber [3,43]. It takes advantage of its vertical movement to interact with incident waves and extract their energy. This WEC concept is particularly suitable for implementation with a direct-drive PTO such as an electric linear generator due to the aforementioned vertical movement which can be directly transformed into electric energy. Figure 4 shows the point absorber options of the reference study case (see Section 2.1, Figure 4c) and the parametric analysis (see Table 2, Figure 4a,b). The dynamic models are presented in the frequency domain and are restricted to the heave displacement.
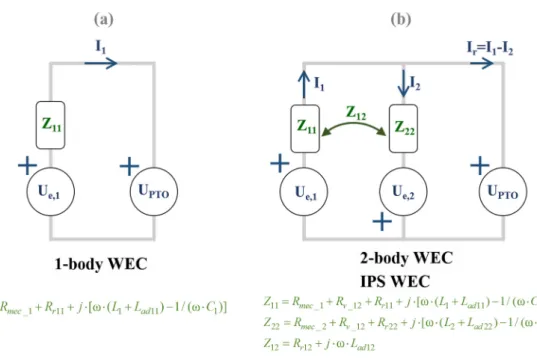
Equation (4) describes the heave dynamics of a 1-body point absorber (Figure 4a) in the frequency domain according to its electric equivalent circuit [3],which is depicted in Figure 7a. The mechanical parameters and variables are represented by their electrical equivalents. It is worth mentioning that the frequency domain representation implies that all coefficients and variables are complex numbers or phasors:
_1 11 1 1 1 1 11 1. 11 1 ,1
mec r ad e PTO
R R I j C L L I Z I U U
(4)
where: Rmec_1 is the electric resistance equivalent to the mechanical damper Dmec_1, that consists of the mechanical losses associated with the PTO; Rr11 is the electric resistance equivalent to the radiation term Dr11; C1 is the capacitance equivalent to the inverse of the stiffness coefficient S1; L1 is the inductance equivalent to the device mass m1; Lad11 is the inductance equivalent to the added mass term mad11; Ue,1 is the voltage equivalent to the wave excitation force Fe,1; UPTO is the voltage equivalent to the PTO force FPTO; I1 is the current equivalent to the velocity v1 and Z11 is the total impedance of the mechanical system.
By solving Equation (4) it is possible to obtain the expressions of the velocity Equation (5) and the averaged mechanical power extracted Equation (6) (Pmec) in terms of UPTO:
1 e,1 PTO 11 e,1 PTO mec_1 r11 1 1 1 ad11
I U U Z U U R R j C L L (5)
1
,1 2
11
1 Re2 * Re 2
mec PTO e PTO PTO
P U I U U U Z (6) where y* denotes the conjugate of the complex variable y and Re(y) denotes the real part of the complex variable y.
The heave dynamics of the frequency model of a 2-body point absorber (Figure 4c) is defined by the system Equations (7) and (8) (heave dynamics of the floating-body, body 1, and the semi-submerged body, body 2, respectively). The system of equations is expressed according to its electric equivalent circuit, shown in Figure 7b.
_1 11 1 1 1 11 1
12 12 2 11 1 12 2 ,1
1 ...
...
mec r ad
r e PTO
R R I j C L L I
R j L I Z I Z I U U
(7)
_ 2 22 2 2 2 22 2
12 12 1 12 1 22 2 ,2
1 ...
...
mec r ad
r e PTO
R R I j C L L I
R j L I Z I Z I U U
(8)
where: Rmec_i is the mechanical equivalent resistance of the body i (where the sub-index “i” takes the value “1” for the floating body and “2” for the semi-submerged body); Rrij is the radiation hydrodynamic resistance of the body i produced by the movement of the body j; Ci is the capacity associated with the stiffness coefficient of the body i; Li is the inductance associated with the mass of the body i; Ladij is the added mass inductance of the body i produced by the movement of the body j; Ue,i is the excitation voltage of the body i; UPTO is the voltage that represents the PTO force; Ii is the current that represents the velocity of the body i; Z11 is the body 1 total impedance; Z22 is the body 2 total impedance; and Z12 and Z21 are the mutual impedances.
It is worth mentioning that the heave dynamic Equations (7) and (8) are also applicable to the dynamics of an IPS buoy (see Figure 4b).
Finally, Equations (7) and (8) are expressed in their matrix form as in Equation (9).
PTO e
PTO e
U U
U U I
I Z Z
Z Z
2 ,
1 , 2
1 22 12
12
11 (9)
The equivalent electric circuit of a 2-body point absorber (Figure 7b) can be simplified according to the Thevenin theorem [44]. This simplified circuit can be represented with the same circuit diagram as
a 1-body point absorber from the PTO point of view (see Figure 7a). The expressions of the Thevenin equivalent voltage (UTH) and Thevenin equivalent impedance (ZTH) (corresponding to Ue,1 y Z11 in the circuit diagram of Figure 7a) are shown in Equations (10) and (11) respectively. The same simplify result can be obtain from the analysis of the dynamics Equations (7)–(9) as presented in [45]:
ZTH = (Z11·Z22 − Z122)/(Z11 + Z22 + 2·Z12) =…
…=(Z11·Z22 − Z122)·(Z*11 + Z*22 + 2·Z*12)/|(Z11 + Z22 + 2·Z12)|2 (10) UTH = ((Z11 + Z12)·Ue,1 − (Z22 + Z12)·Ue,2)/(Z11 + Z22 + 2·Z12)) (11) This Thevenin simplification allows the use of 1-body mathematical expressions, such as velocity Equation (5) or mechanical power Equation (6) equations, in the study of 2-body point absorbers.
To evaluate the expressions of the WEC dynamic models it is necessary to know the value of the coefficients and parameters of all the expressions and, specifically, to calculate the hydrodynamic parameters (radiation damping, added mass and excitation coefficients [3]). These hydrodynamic coefficients are frequency dependent, and their calculation is dependent on WEC geometry. These calculations can be carried out through analytical expressions (e.g., [46] for the case of 1-body WEC, [47] for a 2-body WEC and [48] for an IPS buoy). The main disadvantages of the analytic calculation approach are:
First, that WEC geometry should be composed of simple geometric forms, and second that the analytic expressions should be re-set to each WEC concept. However, the lower computational load makes the analytical approach especially suitable for optimization algorithms where a lot of different geometries may be evaluated. In the method presented, the use of simplified WEC geometries, considering all the WEC bodies as cylinders is representative enough for a preliminary WEC dimensioning. Another approach is the use of Computational Fluid Dynamics (CFD) programs which are more versatile in terms of WEC geometry, although their use implies a higher computational load.
Figure 7. Electric Equivalent Circuits (a) 1-Body WEC; (b) 2-Body WEC.
3.2.3. PTO Power Loss Model
The preliminary dimensioning method uses a PTO power loss model to evaluate the electrical power output of the SRLG-PTO. More complex and accurate models have not been considered for an energetic evaluation since the time response of the mechanical dynamics is several orders of magnitude lower than the electric dynamics. Only Joule effect losses at the stator coils are considered, while power losses of the magnetic circuit (hysteresis losses and eddy current losses) and mechanical dissipation losses (such as linear bearing losses) are not taken into account due to the presumably high air gap and the low velocity [29,49]. By considering current directly proportional to the force exerted [27], the SRLG power loss model expression results as shown in Equation (12). This equation is not expanded with the expression of Pmec presented previously in Equation (6):
loss _cu
_cu
1 2 Re * 1 2 Re * 1 2 ...
... 1 2 Re * 1 2
2
elec mec loss PTO PTO PTO PTO PTO PTO
2
PTO PTO PTO PTO
P P P F v P F v R I
F v R' F
(12)
where: Pelec is the PTO electric power output; Ploss is the power losses (winding losses); FPTO is the PTO exerted force (named UPTO in the equivalent electric circuit); vPTO is the relative velocity between stator and translator of the SRLG-PTO (named I1, in 1-body WEC case, or Ir, in IPS or 2-body WEC cases, in the equivalent electric circuit ); RPTO_cu is the PTO electric resistance; |IPTO| is the amplitude of the PTO electric current phasor and R’PTO_cu is the proportional coefficient to calculate the winding losses from FPTO values.
The parametric analysis (see Table 2) proposes a variation of the PTO rated force (FNOM) in order to analyze the effect of the PTO rated characteristics in the design. In this regard, expressions for PTO scalability are defined based on two premises: The PTO volume is proportional to its rated force, and PTO efficiency is independent from its rated force (efficiency remains constant and its value is independent of the rated force). These assumptions imply that PTO scalability is based on variations of the electric configuration instead of on modifications of the current values. It means that, instead of basing the scalability in modifications of voltage and current rated values (and consequently magnetic and electric modifications), the scalability is based on the selection of the number of sub-machines (minimum independent and functional machine unit).
Under these premises, Equation (12) is expressed in terms of PTO rated characteristics as in Equation (13). This equation requires to carry out the parametric analysis of the rated PTO force (FNOM, see Table 2) which results are presented in the Section 4.4:
_cu
_cu
1 2 Re * 1 2 ...
2
... 1 2 Re * 1 2
2
NOM 2
elec PTO PTO 3 PTO PTO
NOM 2
PTO PTO PTO PTO 3 PTO PTO
P F v F R I
2 0 10
F v F v F R' F
2 0 10
(13)
The aforementioned premises are only suitable when force values are close to the FPTO value of the reference case. Significant PTO modifications and complex scalability expressions are needed for FPTO values far from rated values. An accurate cost and complex scalability model implies to take into account the magnetic materials, the magnetic circuit design (rate between number of poles in stator and translator, shape of the poles, topology, etc.), the electric design (coils configurations and characteristic,
conductors section, current density, etc.), the mechanical design (linear bearings selection, maximum stroke, etc.), etc.
3.2.4. PTO Control Strategy
By applying the Thevenin theorem (see Section 3.2.2), it is possible to define a simplified electric equivalent circuit as a 1-body equivalent circuit diagram for the three concepts of point absorber considered (Figure 4). The PTO control strategy needs just to be defined for the 1-body point absorber case. It maximizes the PTO electric energy extraction while constraints the PTO force to its rated value (see Table 1). The reference case considers a control strategy based on reactive optimum control [3] and on the maximum electric power transfer theorem [44], applied to the equivalent electric circuit shown in Figure 7a. The parametric study considers the modification of the control strategy into a pure damping control [50].
In the case of the reactive optimum control (reference case), the electric power (Pelect) Equation (14) is firstly expressed in terms of the module and phase of the phasor PTO force (FPTO), based on the expression of mechanic extracted power Pmec Equation (6) and in the SRLG power loss model Equation (12).
Pelec is presented in terms of FPTO module and angle to ease the calculation of the optimum values by means of Lagrange multipliers:
Pelec = (1/|ZTH|)·[|FTH·FPTO|·cos(θF_PTO + θZ_TH) − (|FPTO|2·cos(θZ_TH)] − RꞌPTO_cu·|FPTO|2 (14) where: θF_PTO and θZ_th are the phases of the complex variable FPTO and ZTH respectively.
From the expression Equation (14), it is possible to solve a problem of Pelec maximization with restrictions in the module of FPTO to the SRLG rated value FNOM (see Table 1). The Lagrange multipliers theory Equation (15) is applied to solve it. The expressions Equations (16) and (17) show the FPTO
module and phase values that maximize Pelec. The restriction in the PTO force module does not affect the optimum PTO phase value Equation (17):
max[Pelec − λ(FPTO − FNOM)] (15)
|FPTO| = max([FNOM, |Fth·Zth*/(2·Rth + 2·RꞌPTO_cu·|Zth|2)|]) (16) θF_PTO = angle(Fth·Zth*/(2·Rth + 2·R’PTO_cu·|Zth|2)|) (17) where: FNOM, is the PTO rated force value and λ is the Lagrange multiplier included to take into account the PTO maximum force restriction.
This control strategy can be upgraded in order to consider PTO maximum velocity and maximum displacement restrictions [51]. Although this upgraded control strategy is considered as an option in the dimensioning method code, the actuation of the velocity and displacement restrictions are preferred in the paper.
In the case of pure damping control (parametric analysis case), the electric power (Pelec) Equation (18) is firstly expressed in terms of the mechanical impedance (ZPTO) representing the PTO force, based on Equations (6) and (12). Pelec is presented in terms of ZPTO to ease the optimum values calculation:
Pelec = FPTO·vPTO* −Rꞌ·|FPTO|2 = ZPTO·|vPTO|2 − RꞌPTO_cu·|FPTO|2 (18) where: ZPTO is the mechanical impedance imposed by the PTO when it exerts the force according to a certain control strategy.
From expression Equation (18), it is possible to solve a maximization problem (of Pelec) taking into account that ZPTO may be real, and the ZPTO value has to constrain the PTO force maximum value to its rated value. The expression of the ZPTO optimal value, obtained again by applying the Lagrange multipliers theory, is shown in Equation (19):
2 RTH R'PTO_cu1
RPTO2
2 ZTH 2R'PTO_cu
RPTO ZTH 2 0 (19)where: RTH and RPTO are the real parts of the Thevenin impedance (ZTH) and PTO impedance (ZPTO).
3.3. Optimization Problem Definition
The dimensioning problem is now translated into a mathematical optimization problem. To set a completely defined mathematical optimization problem it is necessary to specify: Search space (Section 3.3.1); objective functions (Section 3.3.2); and restrictions (Section 3.3.3).
3.3.1. Search Space
The search space comprises the WEC dimension variables. Figure 8 shows the geometric schemes and the dimension variables to be optimized for the three WEC concepts (see Table 2) considered among the reference case (see Figure 8c) and the parametric analysis cases (see Figure 8a,b). The search space of the reference case (2-body point absorber) is composed of five dimensions (R1, R2, d1, d2 and d3), the search space of the 1-body point absorber is composed of two dimensions (R1 and d1) and the search space of the IPS point absorber is composed of six dimensions (R1, d1, d2, d3, l1 and l2). It is important to notice that the variable R3 represents the radius of the PTO housing.
Figure 8. (a) 1-Body Point Absorber Search Space Variables; (b) IPS Buoy Search Space Variables; (c) 2-Body Point Absorber Search Space Variables.
3.3.2. Objective Functions
The objective functions include the variables to be optimized (maximized or minimized), which determine whether a candidate solution is better when compared to another. In the scope of an industrial problem, the objective functions would be, ideally, a pure-economic mono-objective functions, presumably obtained from a techno-economic analysis [18,52,53] of a proposed WEC technological solution.
Nevertheless, in this paper a pseudo-economic multi-objective function is defined which, on the one hand, takes into account the minimization of the WEC volume and, on the other hand, takes into account the maximization of energy extracted from the PTO. The WEC volume is associated with the WEC cost (a pseudo-cost function related to the type and amount of construction material, the size of the ballast tanks, the reinforced internal structures, the moorings, the dead weights, etc.) while the PTO energy extracted is considered directly related to the incomes.
The WEC volume is directly calculated from its dimension values (search space variables) according to the simplified geometries presented in Figure 4. Just the case of 2-body WEC (Figure 8c) volume calculation is presented in Equation (20) for sake of an example:
Volume = π·[(R1)2 − (R3)2]·d1 + π·(R3)2·d3 + π·(R2)2·d2 (20) The annual electric energy extracted is obtained from each sea state considered, multiplying the Pelec, calculated according to Equations (6) and (12), by the occurrence sea state probability (pwave).
The resultant summation is finally multiplied by the hours in one year. The expression is shown in Equation (21):
Eelec[W·h] = Σ[Pelec(Hs,Tp)·pwave(Hs,Tp)]·(365·24 h/year) (21) where: Eelec is the PTO annual energy extracted and pwave is the occurrence probability of a certain sea state (characterized by its Hs and its Tp) according to the annual occurrence scatter diagrams shown in Figure 5.
Since the optimization problem is defined by a multi-objective function, instead of only one optimal solution there will be a set of optimal solutions (in which none of the objective functions can be improved in value without degrading some of the other objective values), which form a Pareto frontier [54]. This set of mathematical optimal solutions may not be good solutions, because the whole considerations of the engineering design problem are not included in the programmed code. In the case that the algorithm is used in the project design stage (Figure 1), the designers should analyze the Pareto frontiers solution, and the whole set of feasible solutions to select the most suitable solution for the detail design stage [11].
3.3.3. Restrictions
The preliminary dimensioning algorithm uses a set of restrictions in order to ensure that the final WEC dimensions are suitable for the PTO characteristics or the sea states of the selected location. Each wave frequency or period represents a particular sea state, which means a certain value of wave height according to Equation (1). Thus, the restrictions are interpreted as forbidden zones in the frequency/period profiles of certain WEC variables. Those forbidden zones are defined by a maximum/minimum values permitted for each restricted variable and the operational ranges (See Section 3.2.1) where each restriction is active. The restrictions used in the optimization algorithm are described as following, defining the operational ranges where the restriction is active and the minimum/maximum value (if applicable).
(a) Minimum PTO electric extracted power in WEC operational Range III. The power extracted values of the profile should exceed the minimum value of the PTO rated power (PNOM, defined in Table 1) multiplied by a certain coefficient.
(b) Maximum PTO relative velocity in WEC operational Ranges II and III. The power extracted values of the profile should exceed the maximum value of the PTO rated velocity (vNOM, defined in Table 1) multiplied by a certain coefficient
(c) Maximum PTO relative displacement in WEC operational Ranges II and III. This restriction is applied over the amplitude of the relative movement (between 2 bodies in the case of IPS and 2-body devices; between the floating body and the sea floor in the case of 1-body WEC).
It ensures that the relative movement amplitude does not reach the maximum value of the PTO maximum stroke SNOM (see Table 1), which should be limited by protections such as end stop springs or similar devices.
(d) WEC peak-power frequency in the neighborhood of the fr (1/Tr) value (see Table 3).
(e) Anti-Slamming [55] restriction in WEC operational Ranges II and III. This restriction ensures that the floating-body oscillatory-movement amplitude is less than its own draft (d1). The distance between the mass center of body 1 (floating body) and the sea water surface is restricted to the maximum value of the floating body draft multiplied by a certain coefficient.
It is worth mentioning that all the restrictions presented in the previous list are applied in each parametric analysis, with the exception of the peak-power frequency matching restriction (d), which have been varied as a factor of the parametric analysis in the way described in Section 2.2.
The restrictions of minimum power, maximum velocity and maximum displacement, (a)–(c) use as minimum and maximum limits the rated PTO characteristics PNOM, vNOM and sNOM, respectively (see Table 1). This approach considers as non-feasible solutions the WEC geometries with a dynamic behavior profiles which exceed the PTO rated values. These restrictions ensure the WEC suitability for the PTO. The anti-slamming restriction, (e), is considered to avoid dangerous situations for the WEC survivability.
In addition, a WEC peak-power frequency matching (d), is imposed in order to ensure WEC convenience for the occurrence of sea states in the location. This restriction of the frequency of a peak of the extracted-power WEC profile constrains this frequency within a maximum percentage of 1/Tr. The variable Tr is defined in Section 3.2.1 as the period of the sea state with the maximum annual hours of occurrence, as seen in the scatter diagrams, Figure 5. These WEC peak-power frequencies are evaluated by calculating the zero-crossing values of the impedance Zth frequency-profile (see Section 3.2.2) [31]. A graphical representation of the restriction is shown in Figure 9.
A 2-body point absorber (reference case) could have up to three peak-power frequencies depending on the intrinsic PTO variables. Two of them are related with the natural resonance frequencies [45] and the third appears by the actuation of the PTO [31,32]. The existence of three peak-power frequencies could be inferred from the ZTH expression Equation (10), taking into account that the numerator has three zeros respect to the variable ω (since it is raised to the third power). Indeed, if the imaginary part of the ZTH (in a particular WEC solution) would be plotted, three zero-crossing could be appreciated (as show, for the sake of example, in the blue profile in Figure 9):
(a) The first (ωr2 = 2π (Tr2−1)) produces the maximization of the oscillation amplitude in the submerged body. This peak-power frequency is related with the natural resonance frequency of body 2. It is usually sufficiently high to be out of the WEC operational Ranges II and III, due to the fact that the stiffness of the body 2 is small compared with its mass.
(b) The second (ωr1 = 2π (Tr1−1)) produces the maximization of the oscillation amplitude in the floating-body. This peak-power frequency is related with the natural resonance frequency of body 1. It is usually within the WEC operational Ranges II and III.
(c) The third (ωr12 = 2π (Tr12−1)) appears by the effect of the PTO and in a well-tuned device.
It produces a peak in the power extraction frequency profile characterized by individual and relative velocities relatively manageable. The value of this frequency is usually between ωr1 and ωr2 [31,32,45]. This frequency, not usually considered a resonance frequency, is in the neighborhood of the resonance frequency of the two rigidly connected bodies [31,45].
Figure 9. Graphical Representation of the WEC Peak-Power Frequency Matching Restriction.
The forbidden zone, no Zth zero-crossing, is represented by a red dashed area. Red Zth profile belongs to a non-feasible candidate solution and blue Zth profile belongs to a feasible one.
Considering the parametric analysis related to the WEC concepts, in the case of a 1-body point absorber, there is only one peak-power frequency, ωr1, associated with the body 1 resonance frequency (floating-body). In the case of an IPS point absorber, there are two peak-power frequencies, ωr1 and ωr12,
being the peak-power associated with the natural resonance frequency ωr2 (a) negligible due to its small submerged body stiffness coefficient.
4. Discussion of the Parametric Analysis Results
In this section, the results obtained in the parametric analysis of the design-parameters (described in Section 2.2) are shown. The analysis has been carried out starting from the WEC reference case (Section 2.1) and changing several design-parameters. The Pareto frontier obtained is useful to depict and compare the results, as well as the impact of these changes. Conclusions are based on the results of the objective functions and the dependence with the most relevant dimensions: The radii of the bodies (R1 and R2) for a 2-body point absorber and the radius and draft of the floating body (R1 and d1) for the case of a 1-body point absorber and IPS buoy.
4.1. Parametric Analysis 1: Peak-Power Frequency Matching Restriction
Figure 10 shows three of the Pareto frontiers, obtained from the previously-mentioned optimization problem taking into account the two objective functions. These Pareto frontiers correspond to the different cases of the application of the peak-power frequency matching restriction (see Table 2).
Figure 10. Pareto Frontiers Comparison for the Parametric Analysis of the Peak-Power Frequency Restriction presented in terms of objective functions.
These Pareto frontiers, Figure 10, shown in: green, the frontier obtained when this restriction is removed (PF1); red, the matching of the highest peak-power (PF2); blue, the one obtained with the restriction of the reference case described in Section 3.3.3 (PF3). In addition, filled in green, magenta and blue, the areas corresponding to the feasible solutions for these three cases are presented.
The result of the comparison shows that PF1 allows better solutions than PF2 and PF3 in design trends of low WEC volume and low energy extraction. The objective of increasing the energy extraction is subjected to the one of reducing the volume.
On the one hand, the resonance of a body is related, approximately, to the ratio between mass and the stiffness (Archimedes) coefficient [3]. Consequently, the mass and the volume must be impaired to obtain a relatively high resonance frequency (as in the reference case).
On the other hand, the peak-power matching restriction aims to optimize the use of the electric PTO, minimizing the needs of reactive mechanical power, so it is only useful in the WEC operation Range II.
Therefore, the restriction makes sense depending on the amount of annual hours the WEC is within Range II (see Figure 6). Also, the larger the WEC volume, the greater the number of hours at rated power (operation Range III) to the detriment of hours in the Range II. It can be seen that, as the volume increases, the difference between the energy extracted in the Pareto frontier PF1, and the Pareto frontiers that take into account the PF2 and PF3 restrictions also increases. Form a hydrodynamic point of view, when the peak-power matching restriction is imposed for the floating body (PF2), the low radius is directly associated with low volume. The low radius implies a reduced capacity to radiate waves and, thus, a reduced capacity to extract energy and relatively narrow bandwidth. This effect could be another reasons to explain why the PF2 are composed of worse solutions at low volume than PF1.
Note that in Figure 10, PF2 allows better solutions that PF1 and PF3 in design trends of high volume WECs and high energy extraction. In this case, the the peak-power matching restriction weights the solutions by giving more importance to its energy extraction than to its volume. It is necessary to increase the mass to tune the natural resonance of the WEC with the resonance of the location, getting a benefit in terms of energy extracted.
Finally, as can be seen in Figure 10, PF3 provides better solutions in WECs with very low volume (below 100 m3) and extracted energy when compared to PF2 and similar results are obtained compared to PF1. It should be recalled that the peak-power frequency related with the two bodies relative displacement (ωr12) has a lower value than the resonant frequency of body 1 (ωr1), so ωr1 resonance searching (PF2 solutions) ensures that ωr1 value is around 1/Tr and ωr12 searching (in PF3 solutions) ensures that ωr1 value exceed 1/Tr value. Taking into account that ratio between the stiffness coefficient and the mass of the body 1 is directly related with its resonance frequency (ωr1), the ωr1 resonance searching imposes a lower body 1 stiffness-mass ratio in the body 1 than the ωr12 searching. Furthermore, the ωr1 resonance searching implies greater body 1 excursions at its resonance frequency [14]. These two factors have an influence on the observed behavior at the Pareto frontiers PF2 and PF3. On one hand, the first factor (low ratio stiffness-mass) could lead PF2 to higher volume solutions. On the other hand, the low volume WEC solutions tend to have low draft and low mass, thus they have great sensitivity to maximum stroke and anti-slamming restrictions. In addition, the second factor (grater excursions) could emphasize this sensibility, reducing the number of feasible solutions in the low volume zone.
Also, it should be taken into account that a peak-power in the frequency profile can be obtained for frequencies in which the capacity to extract wave energy is relative low (due to the values of the hydrodynamic coefficients at the frequency ωr12, and the inherent high PTO damping value [31]
what leads to high electrical losses), so volume changes do not lead to an equivalent compensation in energy extraction. This effect could be the reason of getting better PF solutions in high volume for non-resonant devices.
4.2. Parametric Analysis 2: Location
In this subsection, the differences between the design results when the location changes from the original of PLOCAN to the alternative location at Santoña are shown (see Table 2). In Figure 11a the feasible solutions found for the reference case (grey tones) and the Pareto frontier (black) have been depicted. For the alternative location, the feasible solutions in absence of the peak-power matching restriction (light green), with the restriction only of ωr1 (magenta) and with the restriction only of ωr12
(cyan) are shown (Section 3.3.3). The Pareto frontier is presented in green.
![Figure 1. Project Development Stages Flow-Chart Scheme Example of a R&D WEC Development Project [10]](https://thumb-us.123doks.com/thumbv2/123dok_es/12610527.0/2.892.114.783.526.923/figure-project-development-stages-scheme-example-development-project.webp)