Utilizando análisis de regresión múltiple, técnicas de previsión y toma de decisiones multicriterio (MCDM), este proyecto proporciona un método sistemático para identificar variables económicas que afectan la demanda de energía. Además, la demanda de vivienda, transporte y energía comercial está altamente correlacionada con el factor económico.
Introduction
- Introduction & Background
- Problem Definition
- Significance
- R&D Objectives & Thesis Contributions
- R&D Orientation, Methods & Materials
This MS thesis proposes a systematic method to forecast energy demand in Colombia, focusing on the behavior of macroeconomic variables. These methods lead to analyze the future behavior of energy demand in consumption sectors in Colombia.
Background & Literature Review
Background
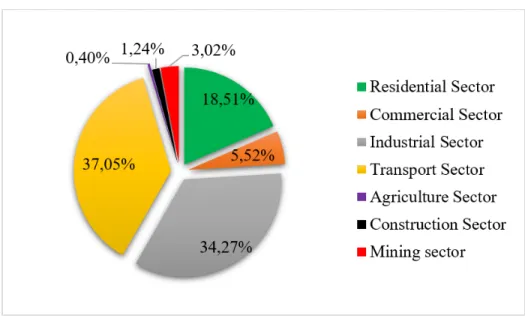
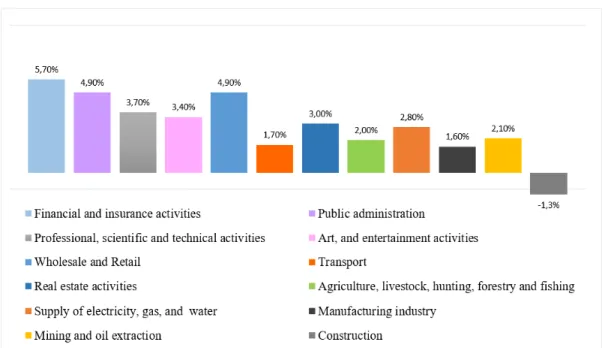
The official report of DANE and the Asociaci´on Nacional de Empresarios de Colombia showed that the economic growth in Colombia in 2019 had a recovery distributing its value to 3.3% of the country's GDP. Colombia's energy balance in 2015 showed a net energy consumption (exchange and transformation) of 29,655 kTEP/year for major sectors of the economy.
Patent Landscape
The first patent reviewed, US Patent number US 9852483 B2, 'Electric Power Demand Forecasting System and Method' describes a forecasting method for forecasting the electric power demand using weather data because the electric power demand is considered to correlate with changes in weather. It is based on the weather record and the electric power demand data in the past with predicted weather groups in a period (including a predicted target day) for predicting the electric power demand [ 24 ].

Scientific Literature Review
This work provides a comprehensive overview of the literature on the implementation of the Modern Portfolio Theory (MPT) methodology in the field of energy planning and electricity production. The book entitled 'Prospectiva energ´etica' studies the behavior of Colombian energy demand until 2050.
Methodology
- Fundamental Analysis
- Dataset
- Correlation analysis
- Statistical analysis
- Significance analysis
- MicMac analysis
- Variables confirmation
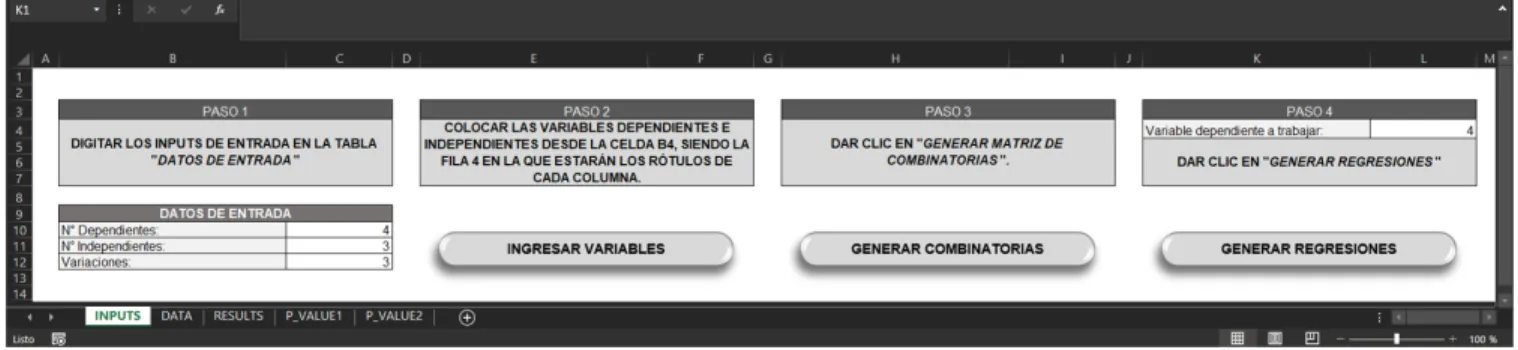
It makes it possible to obtain all possible occurrences of the independent variables with the dependent variable. The set of independent variables representing the behavior of the dependent variables is evaluated.
Results and Performance Assessment
Fundamental Analysis of the Macroeconomic Variables
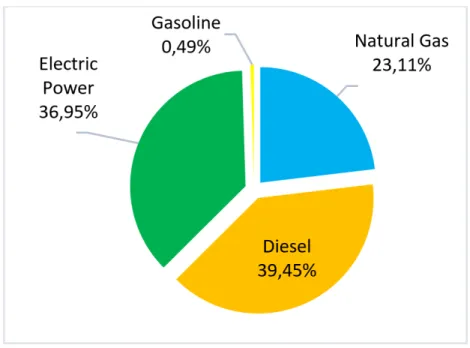
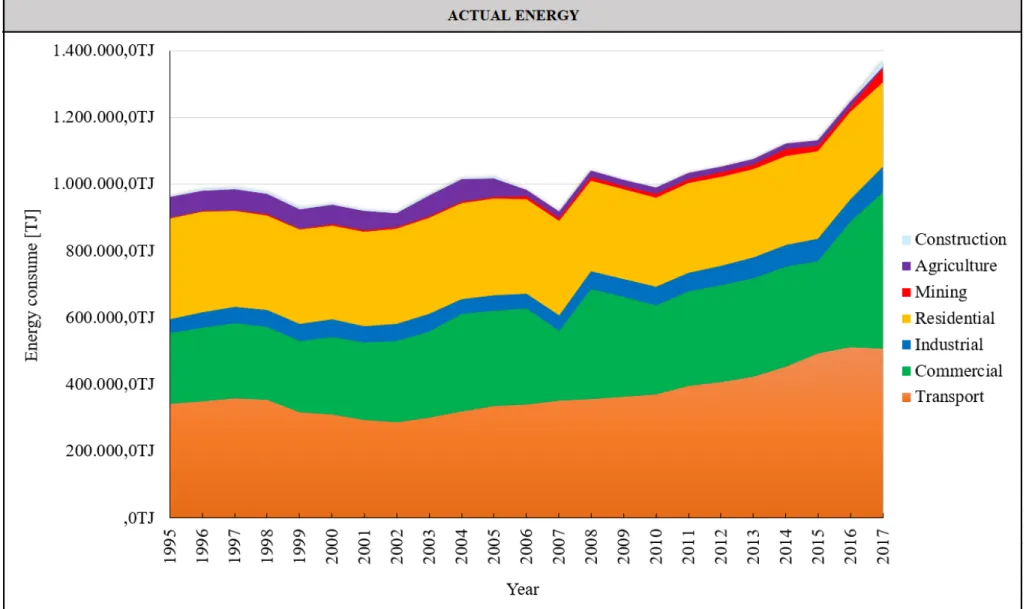
Diesel and petrol are the main energy sources used in the transport sector, with the percentage of the sector's energy consumption being around 37% and 40% respectively. Several economic and energy sector hypotheses imply that there is a relationship between GDP and energy demand. One of these is the hypothesis of energy-driven growth (causality between energy and GDP Granger) [79]. At the same time, in a meta-regression analysis of a large part of the literature on the energy-GDP (GDP) relationship, Bruns et al.
Based on the theory previously defined and supported, the behavior of the GDP isolated to the model implies an endogenous and dependent relationship with the energy consumption. Therefore, the PPI shows an exogenous and independent relationship with the energy consumption because its value is not affected by other factors or variables, on the contrary, it directly affects factors such as the transmission and distribution cost components of the CU. On the other hand, it directly affects the price of 'reconciliaci´on positivea' of thermal generators in the balance of the national dispatch center.
In the transport sector, oil use is typically a smaller share of total oil consumption in non-OECD countries. Also, changes in the value of the US dollar will have collateral impacts on commodity price fluctuations for importing and exporting countries [100].

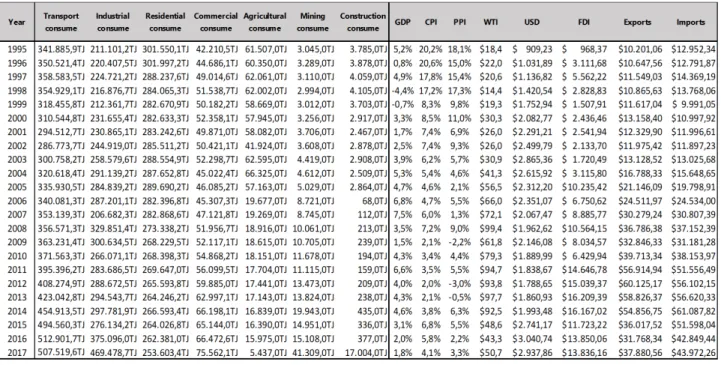
Data Selection
If energy consumption is determined to be a catalyst for exports or imports, any reduction in energy consumption due to energy conservation policies will reduce exports or imports and hence trade gains, indicating a lower rate of economic growth. Although exports and imports are catalysts for energy, energy conservation policies do not adversely affect the benefits of trade, resulting in economic growth. Energy efficiency and innovation are highly correlated with foreign market access, and a decline in energy consumption can also hinder international competitiveness and negatively impact the product portfolio for export purposes [112].
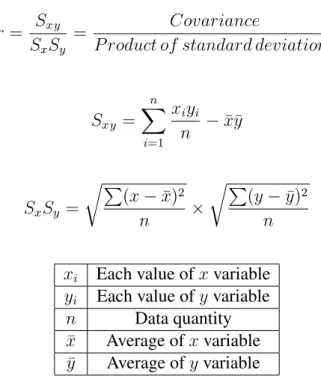
The trade balance is an endogenous variable in the model because its value depends on the import and export variables. Colombia's exports and imports were considered as separate variables to run the systematic methodology since the trade balance depends on the values of these variables. In order to analyze the general behavior of the quantitative data of the model, three basic aspects were studied, such as the midpoint of all data (median), measures of spread (range, variance and standard deviation) and the shape of the distribution (kurtosis) .
Based on point 3.4.1 of the proposed methodology, the variability of the independent variables is determined because these factors will explain the behavior of the dependent variables. Consequently, every independent variable in the model uses a quadratic and cubic expression with the exception of the CPI, which uses a quadratic and semi-logarithmic expression.
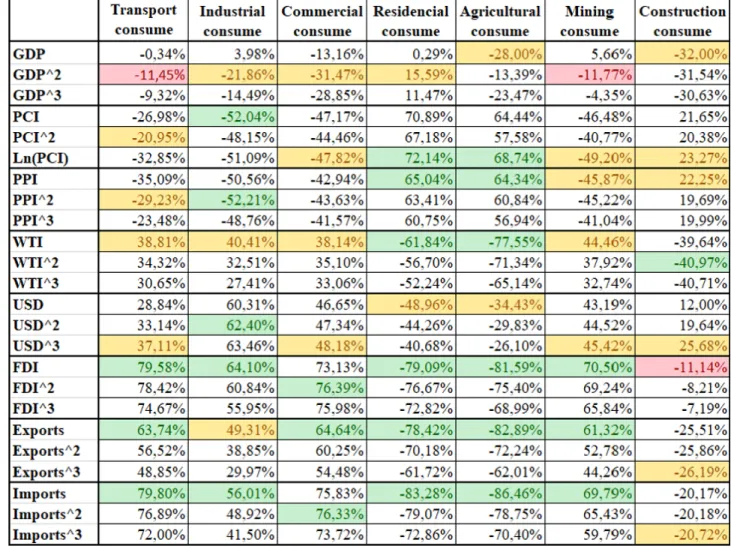
Correlation Analysis by Sectors of Consumption
Finally, the energy consumption of the construction sector showed only a medium relationship with the WTI. In addition, the imports and exports showed a positive and high correlation with the energy demand of the commercial sector. The GDP has a positive and low relationship with the energy demand of the residential sector.
Furthermore, the CPI has a high and positive relationship with the energy demand of the residential sector. Finally, foreign direct investment, imports and exports have a negative and strong relationship with the energy demand of the residential sector. The CPI and the PPI have a positive and high relationship with the energy consumption of the agricultural sector.
GDP has a negative and low correlation with the energy demand of the mining sector. WTI has a negative and moderate relationship with the energy demand of the construction sector.
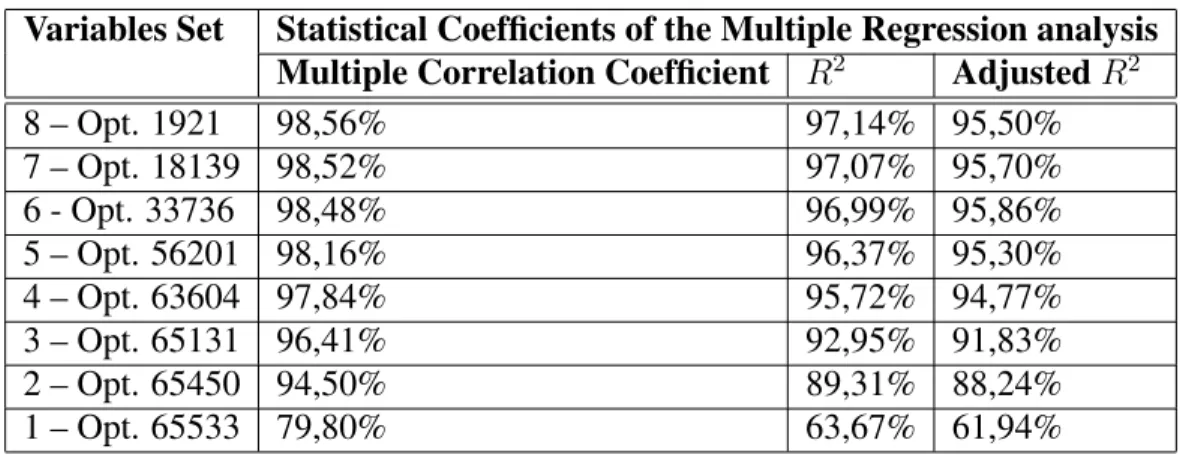
Multi-regression analysis & Macroeconomic Variables Selection
The set of variables without this variable showed a positive change in the general behavior of the statistical coefficients which. Using the significance analysis in the commercial sector, the variable with the highest statistical noise in the set of variables was GDP. Using the significance analysis in the housing sector, the variable that had the highest statistical noise in the set of variables was GDP.
Micmac analysis assessment
Economic set of variables of Industry Sector selected in the P-value assessment occupied all the three groups in the MICMAC matrix. Exports3, F DI2 and P P I occupied the "Linkage Factors" group with a high influence and dependence, while Imports3 had a medium influence and high dependence. Finally, U SD3 occupied the “Dependence Factors” .. group that had a low influence and medium dependence, as shown in Figure B.3 in Appendix B).
The variables of the economic set of the housing sector selected in the P-value estimation occupied two groups in the MICMAC matrix. Export, F DI, Import3, P P I, CP I2, W T I2 were placed in the group "Linkage factors" with low influence and high dependence despite the medium dependence of CP I2. Finally, GDP3 occupied the group of "drivers" with medium influence and low dependence, as shown in Figure B.4 in Appendix B).
Economic set variables for the agricultural sector selected in the P-value assessment occupied the "Linkage Factors" group. Export3, W T I and Import had a large influence and dependence, as shown in Figure B.5 in Appendix B).
Energy Based Model by Sectors of Consumption
The overall error between theory energy and energy projected within this sector is 2.77%, as shown in figures 4.12 and 4.13. CP I2, W T I2, F DI3, Export3 and Import were the variables considered in this study to establish the energy-based model of transportation energy demand of Colombia, as shown in equation 4.1. The overall error between theory energy and energy projected within this sector is 6.16%, as shown in figure 4.14 and 4.15.
The overall error between theoretical energy and energy projected within this sector is 3.83%, as shown in Figures 4.16 and 4.17. GDP2,P P I,W T I2,U SAnd export3 were the variables considered in this study to obtain the energy-based model of commercial energy demand in Colombia, as shown in equation 4.3. The overall error between theoretical energy and energy projected within this sector is 0.96%, as shown in Figures 4.18 and 4.19.
GDP3, CP I2, P P I, W T I2, F DI, Export and Import3 were the variables considered in this study to obtain the energy-based model of commercial energy demand in Colombia, as shown in Equation 4.4. W T I, Export3 and Import were the variables considered in this study to obtain the energy-based model of agricultural energy demand in Colombia, as shown in Equation 4.5.
Conclusions
Contributions
The implementation of an integrated energy planning methodology allows Colombia to apply a comprehensive assessment of the project's energy demand. Also, this research showed that the theoretical determination and assumption that only the population variable affects energy demand is invalid. In fact, the theoretical determination means a support to validate the results in energy planning rather than being the only approach to the project's energy demand.
Future Work
23] Jose Andres Suarez Diaz, Development of an Energy-Based Model for Forecasting the Energy Demand of Colombia, Oregon Institute of Technology, June 2019. Mahecha, Republic of Colombia Ministerio de Minas y Energ´ıa Unidad de Planeaci´on Minero Energetica, UPME . Sub-directorate of Planeaci´on Energ´etica - Grupo de Demanda Energ´etica,p. Paez et al., Future scenarios and trends of energy demand in Colombia using long-term energy alternative planning, vol.
67] Unidad de Planificación Minero Energética Caracterización Energética del Sector Residencial Urbano y Rural en Colombia. 69] Unidad de Planificación Minero Energética, UPME Plan transitorio para el suministro de gas natural. 70] República de Colombia - Ministerio de Minas y Energía, Unidad de Planificación Minero Energética.
Empirical evidence from Pakistan - Humaira Yasmeen, Ying Wang, Hashim Zameer, Yasir Ahmed Solangi— Energy Reports. 107] Interactions between energy and imports in Singapore: Empirical evidence from conditional error correction models – Salih Turan Katircioglu – Energy Policy.
Transport sector
Industrial Sector
Commercial Sector
Residential Sector
Agriculture Sector
Transport Sector
Commercial Sector
Industrial Sector
Residential Sector
Agriculture Sector