In order to avoid the challenges arising from the implementation of an evolutionary computational enzyme design scheme. To test a combined implementation of the Rosetta enzyme design protocol with EVB evaluations using a reshaping strategy. To use EVB simulations to estimate activation free energies for a ranked subset of designed variants.
To understand the catalytic effect of the original and improved enzymatic systems on the target reaction. To confirm the use of the WCN for predicting experimental dynamical profiles of protein systems. The first chapter deals with the application of the Rosetta design methodology in conjunction with EVB simulations to evaluate the activity of the designed variants.
Enzyme optimisation: the Kemp Elimination case
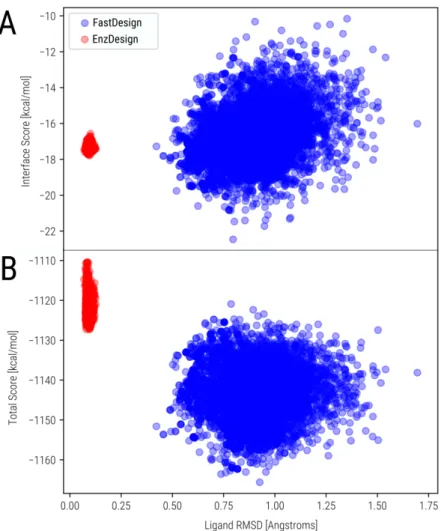
An alternative to classical MD simulations is the EVB method, which can directly inquire about the free activation energy of a simulated chemical reaction. The structure of the GNCA4-W229D variant is available in complex with the KE TSA reaction (Figure 2). We tested this by self-docking the TSA reaction of KE to the GNCA4-W229D structure (Figure 3).
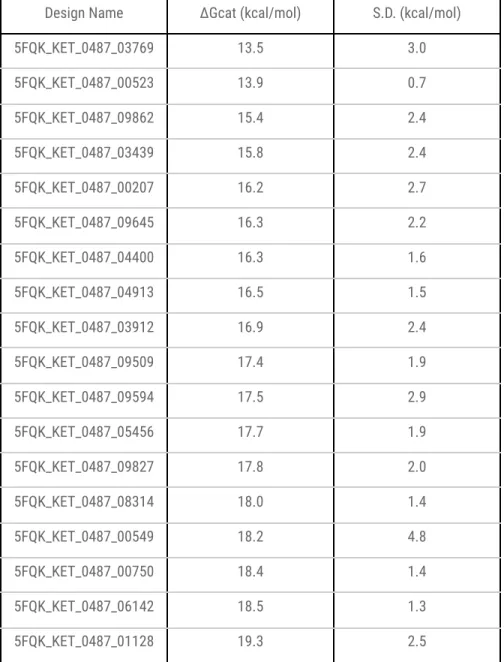
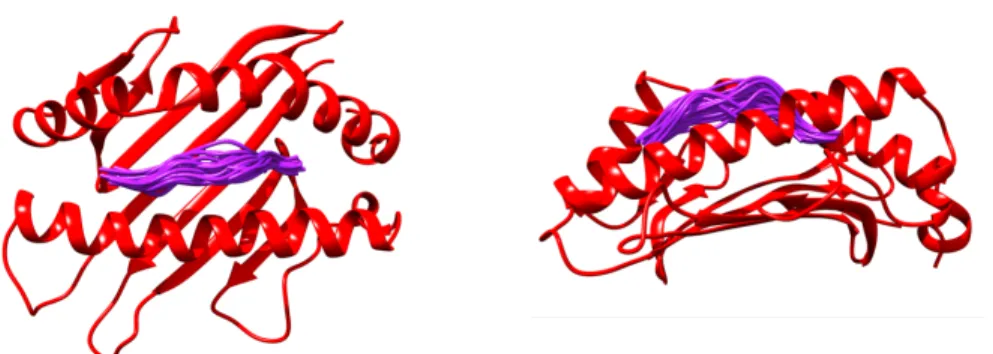
Active site structure of the GNCA4-W229D variant with Kemp eliminase activity in complex with the KE reaction TSA (6-nitrobenzotriazole). Most designs have higher activation free energies than the EVB-derived value of the starting variant GNCA4-W229D-F290W kcal/mol). The second concerns the physical origin of the dispersion in activation free energies.
Contribution of the electrostatic free energy at the LRA residue level to the free energy of activation of the GNCA4-W229D-F290W enzyme over the KE reaction. The activation free energies of the full simulations were plotted along with the LRA free energy contribution of the uncharged residue (Figure 12).

Predicting binding free energy in MHC-I-peptide complexes
The progression of the scores for all modeled replicas is shown in Figure 19, where it can be seen that total and interface scores converged early in the search, at less than five fast-relaxation cycles. From the boxplot of interface score value distributions (Figure 20 bottom plot), it is clear that the mean values of the distributions have a higher correlation with the experimental data with an actual PCC of 0.8053. The calculated probabilities allowed us to estimate the binding free energy as the expectation value of the entire distribution of sampled conformations (see the Methods section for details on these equations).
Inspection of the PCC convergence for the same parameter shows that the curve has almost converged at about four relax cycles (Figure 25). Since our protocol only generates a local search around these backbone conformations, we evaluated the convergence of the PCC as a function of the number of starting backbone conformations. To further examine which starting conformations were more favorable in terms of energy optimization, we plotted the Boltzmann probability contribution of each starting conformation to each of the peptides in the binding data set (Figure 27).
The mean of the bootstrapped PCC is shown, and the error bars represent its bootstrapped standard deviation. Since the rosette score function is decomposable from the residuals, we plotted the average Boltzmann interface energies on the surface of the sampled minimum energy complex structures (Figure 28). Top) Side view of the MHC peptide pocket showing the conformation of the lowest energy peptides above it.
We have validated the use of the Rosetta energy function to predict experimental activities using conformational sampling in combination with a statistical-mechanical ensemble analysis. The architecture of the energy function allowed us to understand the physical origin of the. Me is the total conformational energy of the MHCp complex, the conformational energy of the unbound peptide, and is the conformational energy of the MHC receptor without the bound peptide.
After all resampling was performed, the mean and standard deviation of the PCC distributions were calculated and reported.
Dynamical and binding predictions using the WCN metric
The Pearson(Spearman) CC between the WCNAll atom profile and the B-factor profile is shown in the title together with the PDB code of the. It binds the two subunits of the NF-κB dimer (i.e., the p65 and the P50 subunits) at different ends of its ankyrin repeat fold (Figure 31). The RHR of the p65 (green) and the P50 (red) subunits contact different interfaces of the IκBα protein.
For the interaction with the NF-κB p65 subunit the interface residues with IκBα are correctly included in this set of residues, being also true for the interface residues that interact with the NF-κB p50 subunit. To visualize the pattern of surface residues with positive FEEC results, we mapped their FEEC values to the surface of the IκBα protein (Figure 33 top). Positive FEEC values cluster in specific regions of the protein and they appear to be highest in the terminal residues of the IκBα structure.
100% of the interfacial residues have positive FEEC scores when the SASah threshold is 74% or higher, although at this threshold the interfacial consists only of the inner 16 residues. The percentage of correctly classified interfacial residues according to the FEEC score (red line) is shown as a function of the SASAh. The N-terminal side of the IκBα protein contains the larger number of negatively charged residues with positive FEEC values (red circle in Figure 36).
Based on this logic, we defined a FEEC score as the value of the WCN minus the SC scores. When positive FEEC scores were mapped onto the surface of the IκBα structure, it delineated regions very similar to those used by the protein to interact with its partner protein, NF-κB. Using the FEEC metric, we were able to narrow down the H4 histone binding to a specific region, which according to the crystallographic structure of the IκBα protein in complex with the.
Each WCN metric, as described here, has an inverse relationship to the evolutionary SC; therefore we use the inverse of the WCN (WCN-1) to make comparisons with the evolutionary information.

Exploring protein conformational landscapes with Structure-Based Model simulations
The energies of each conformation were recalculated using the same force objects in the SBMOpenMM. We decided to investigate the evolution of the RMSD from the trajectories to their corresponding crystallographic structures (Figure 43). RMSD values remain high at Tf temperatures, which corresponds to the exploration of the unfolded basins.
The free energy of the process is shown in Figure 45, with the left basin referring to the folded configuration and the right basin to the unfolded configuration. After defining conformations belonging to the TS region of the FoxP folding simulation, we plotted the probabilities of contact formation for the folded, TS and unfolded configurations (Figure 46). Probability of contact formation for the folded (b), TS (c) and unfolded (d) configurations of the FoxP protein.
The kinetic characterization of this simulation was performed with an MSM analysis of the folding process. A total of 15 replicates of 10 μs (SBM time scale) each were run at the folding temperature of the system using the all-atom SBM force field. Since our interest is in the folding-to-unfolding reaction, we plotted the values of the second eigenvector on the right, which corresponds to the slowest ITS in the MSM transition matrix (Figure 52).
The radius of gyration increases slightly in the folded configuration towards the TS region of the two minima. We wanted to map exactly the configurations associated with the TS of the folding response. The analysis shows that the simulation has converged with respect to the length of the simulated time for.
Electrostatic origin of the catalytic power of enzymes and the role of preorganized active sites.J. On the relationship between sequence conservation and packing density profiles of protein complexes. Leopoldini, M. et al. The role of quantum chemistry in elucidating the elementary mechanisms of catalytic processes: from atoms to surfaces to enzymes.
Methodologies
The data used for this parameterization are the thermodynamic and kinetic constants specific to the reaction under study, which can come from experimental measurements in wet labs or ab initio QC calculations of the relevant chemical steps. When studying the physical origin of enzymatic catalysis with EVB, it is necessary to run simulations in the uncatalyzed (i.e. water solution) and the catalyzed environment (i.e. the solvated enzyme system). If the method succeeds in predicting the kinetic change (in activation free energies) between these environments, the simulation is considered valid and can be interrogated to understand the physical origin of the simulated catalytic effects.
Similarly, the reference simulation can be an enzyme with low activity, then the adjusted parameters can be used to predict the catalytic trend among improved variants to understand the origin of the improved catalytic activity. This description, called theozyme, is usually achieved at the level of quantum chemistry by optimizing the positions of immaterial side chains around a model of the reacting molecule's TS. Models are then selected by a combination of metrics that attempt to assess the stability of the protein and its active site complementary to the TS model.
A group of the most promising models is selected for the assessment of their desired catalytic activity. The proposed changes by these methods mainly depend on the catalytic hypothesis on how to improve the reaction rate and they are usually guided by a scoring function that can distinguish the effect that mutations can have on the protein stability. Its mathematical form is based on a continuous quantification of the contact map, in which the contact-specific contribution is the squared inverse of the contact distance.
When the WCN contributions of all atoms are summed, the profile obtained agrees very well with the experimental dynamics profile of the system (e.g., the B-factor profile).96 The WCN has also been shown to agree with the sequence conservation (SC) profile of protein families.97 These similarities lead to exciting hypotheses about the relationship between protein structure, dynamics and evolution that we can now approach quantitatively with the WCN. Although the exact mathematical relationship between these profiles is unknown, a possible interpretation of their origin can be hypothesized. On the dynamic side, the WCN is based entirely on the original structure of the protein and defines the magnitude of the system dynamics around the original free energy basin.
On the evolutionary side, when a set of evolutionarily related proteins (i.e., a protein family) explores the protein sequence/fitness landscape in search of better adaptability, or even as a consequence of neutral drift, there is a higher constraint for exchanging residues in crowded regions than residues in less restricted areas.
Code