Most existing studies evaluating fisheries management fail to check the accuracy of the estimated parameters in reproducing the observed dynamics of the resource. The analyses, opinions and findings of this paper represent the views of its authors, they are not necessarily those of the BBVA Foundation.
Introduction
Both include ecological or environmental uncertainty in the biological dynamics of the fish stock. Two examples show in particular how poorly this approach can reproduce the observed dynamics of the biomass.
The Traditional Approach
Thus, given X0, the resource dynamics implies Xˆ1= Fˆ (X0) – Y0 where Fˆ is the estimated gross growth function. For southern cod (bottom panels), the traditional estimate reproduces the observed stock evolution very poorly.
A Stochastic Approach
The Model
Ymax can be understood as the maximum amount of fish that can be physically caught by the fleet at their current size. Ymin can be interpreted as the minimum amount of catches that the fleet must make to maintain minimum income for current fleets given their catch capacity.
Calibration Procedure
Then, in section 6, this approach is applied to the northern murrutti stock, which is a fishing ground regulated by the European Union and fished by two heterogeneous fleets from different countries. In this case, the stochastic approach is extended to fit not only observed data on biomass and catches, but also relative catches per unit effort and quotas set by the European regulation for each fleet.
The Case of the European Anchovy Fishery
Calibration
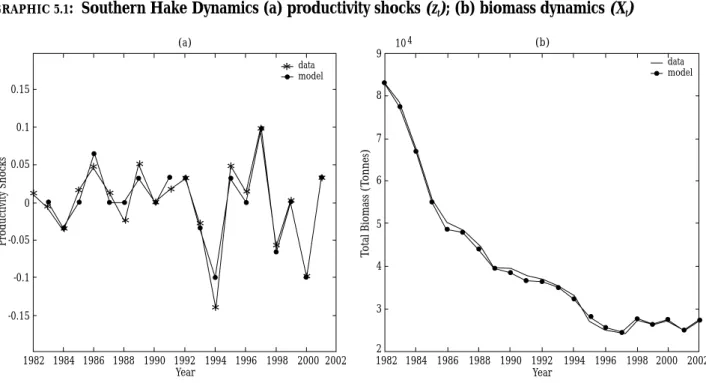
An appropriate functional form for gross biomass growth, F = ez tf (Xt), has been chosen from the various candidates analyzed. Note that the estimated productivity shocks reproduce the observed stock path quite accurately (panel b).

Evaluation of European Anchovy Stock Management
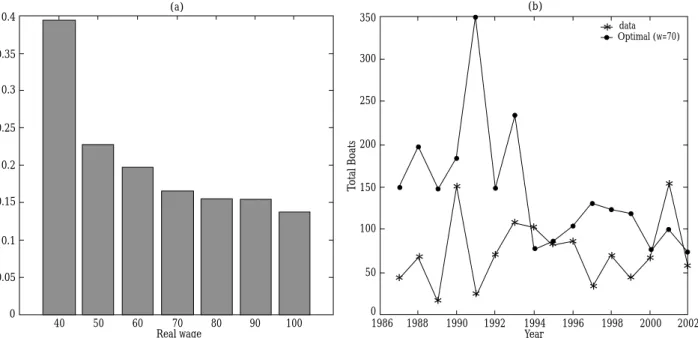
As expected, the higher the real cost of the effort, the lower the profit of the fishery, regardless of the degree of management efficiency. This inefficiency has meant a reduction of between 13% and 40% in fishing profits.
The Southern Stock of Hake
Calibration
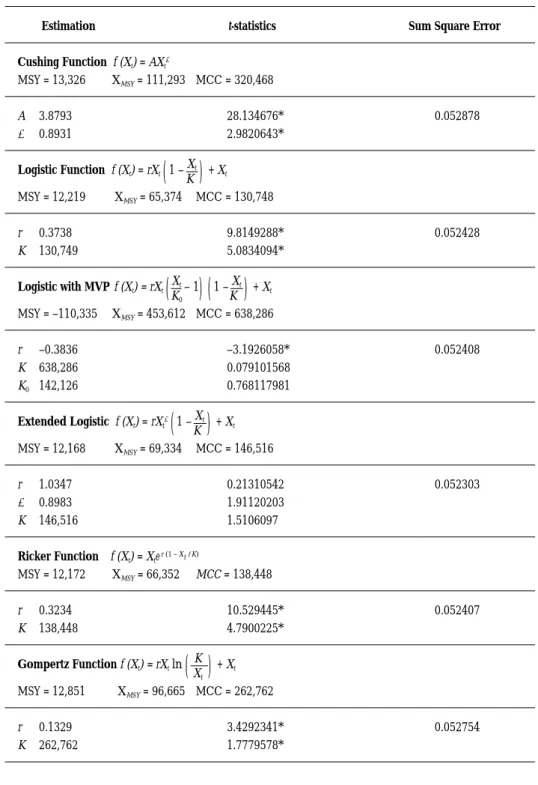
As in the European anchovy stock, we choose the functional form of the gross growth function by estimating the dynamic resource equation for six alternative gross functions: Cushing, logistic, logistic with minimum viable population size (MVPS), extended logistic, Ricker and Gompertz. Data for the stock and the total catches from 1982-2002 in the southern hake stock are used. While she considers steady state utilization, we analyze the transition from the initial situation to the steady state in the presence of productivity shocks.
The Cushing, Logistic, and Gompertz functions fit the data well, but according to the Akaike criterion, the Cushing function was chosen because it presents the lowest sum of squared errors in the parameters and the estimated biological aggregates are sensitive. To do this, we take seven equal values for the productivity shock condition, i.e. Given the information from the estimated errors, zˆ, and the values for the states of z, we compute the transition matrix, p, for the Markov chain discretizing a continuous seven-state process following Tauchen (1986).
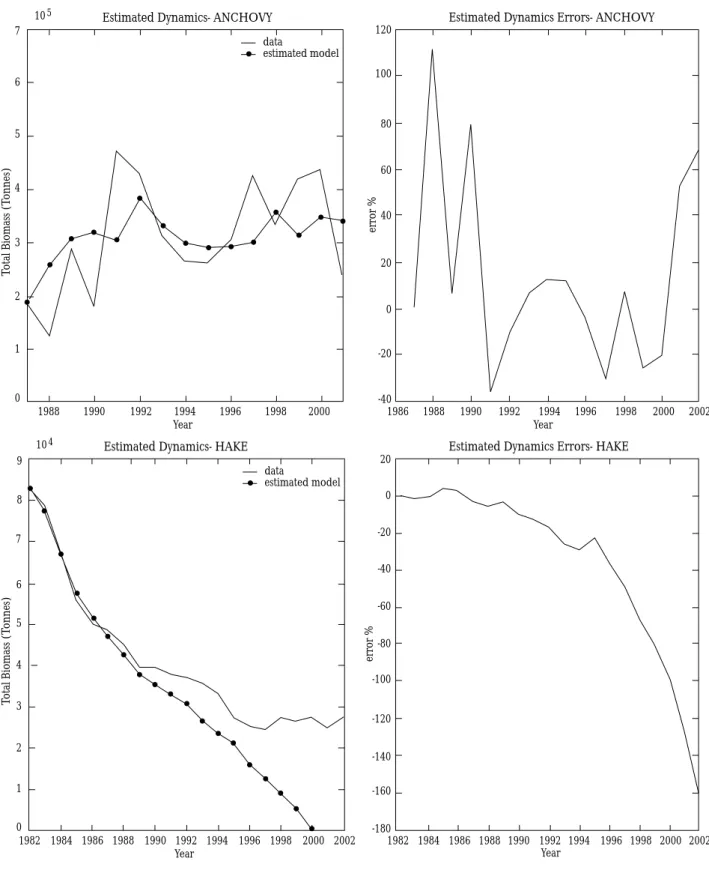
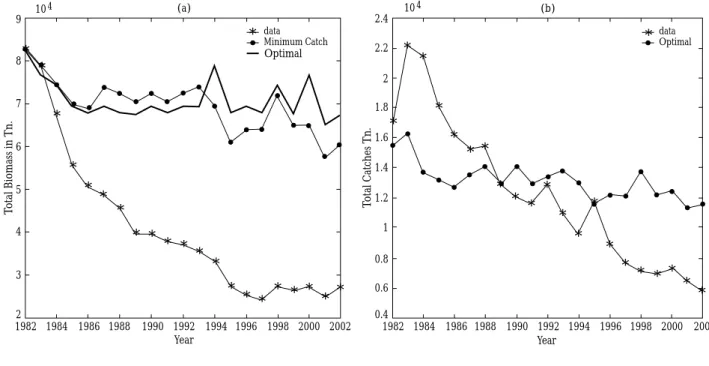
For the data from this fishery, deviations in the observed paths for stocks and catches from those implied for the model are minimal.
Evaluation of the Management of the Southern Stock of Hake
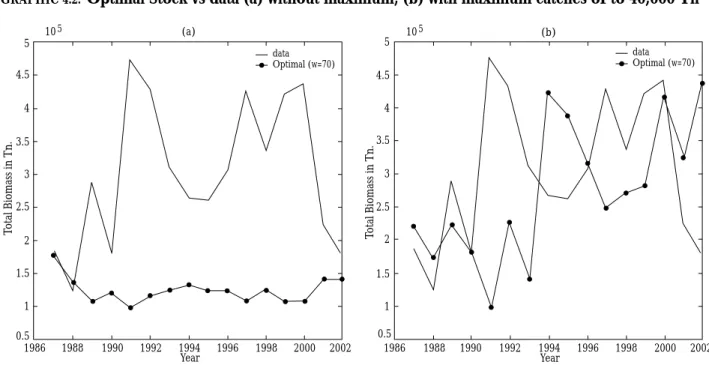
In contrast, observed fisheries profits declined drastically due to overexploitation of the stock in the early 1980s. We see that the craft fleet has reduced its effort tremendously; however, optimal management of the fishery would allow the initial level of effort to be maintained without major changes. This illustration is presented for two different resource inventory levels: a low inventory (Tn 20,000), which represents a level close to the current inventory, and a high inventory (Tn 60,000), which is close to the optimal level.
Second, the higher the resource stock, the lower the trawler fleet's participation in total catches. This is because an increase in the stock implies more catches and therefore a more than proportional increase in the catches of the less productive fleet (trawlers). Overexploitation of the resource in the early 1980s reduced the stock enormously, and this led to a reduction in catches in the 1990s.
In terms of total profit, fisheries lost more than 317 million euros, which represents 35 percent of the current profit.
The Northern Stock of Hake
An Heterogeneous Multi-fleet Model
Because we want to introduce the possibility of political discrimination to analyze the optimality of the CFP, this model is extended. Assume that the dynamics of the total catch level in period t, Yt(Lt, Xt), depends on the total effective effort, Lt, and the fish stock level in this period, Xt. Second, each country i receives a share of the total catches, a quota si, t, which is proportional to its share of the total effective effort.
These two assumptions allow us to express the production function of each country as a function of its effort and that of the rest of the fleet, i.e. Note that this expression implies two different external effects of the effort of one of the fleets on the catches of the other fleets. This assumption implies that, at any time, catches by one fleet depend on the effort of other fleets.
We believe this is an acceptable approach in an aggregate analysis of fleets, but it may be difficult to approve in a micro-level study.
Calibration
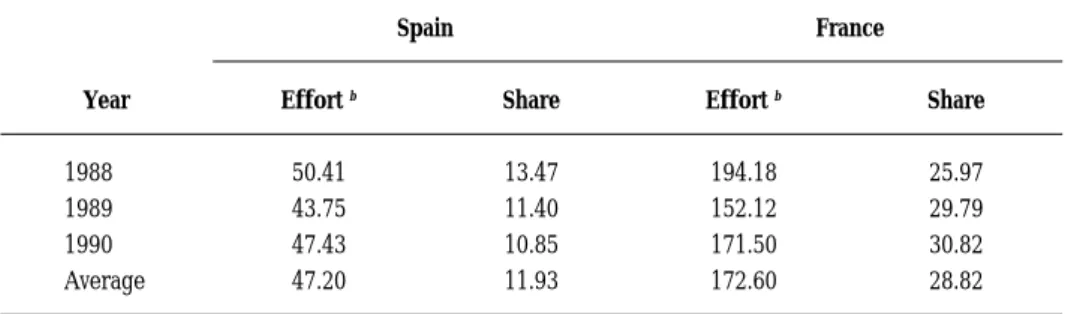
To do this, we take five equal values for the productivity shock condition, i.e. To calibrate φ reflecting differences in productivity when considering homogeneous fleets, we assume that effort is independent of productivity parameters. Shares for fishing fleets are calculated as the ratio of each fleet's catch in the area in which the reference fishing fleet fishes to the total Northern Stock catch.
The catch parameter, l, and the productivity parameter for the French fleet, θfr, are calibrated together to reproduce the effort and catch data of the French fleet in subareas VII and VIII of the northern stock. To do this, we use the capture equation (6.2), which expresses the total effort in terms of the French share and effort, i.e. We also assume that the remaining fleets fishing in the northern stock have the same productivity as the French fleet, i.e. θru= θfr.
As quotas for each fleet, we use the average of the legal quotas set by the CFP in areas VII and VIII during the period 1987–2002 adjusted to consider the entire northern hake stock.

Quantitative Experiments
- The efficiency of the CFP
- Optimal Side-Payments
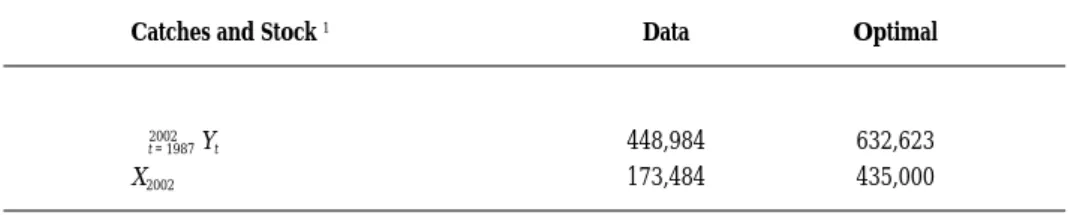
We can see in graph 6.2 (a) that optimal utilization led to a recovery of the stock until 1997, when it fell again. If the fleets had fished efficiently, the present value of the future earnings would have been 111,698 Tn resources, which means more than 670 million euros, considering 6 euros/kilo as the price of bees. Moreover, when calculating the profits associated with the observed data for the entire period and taking into account the cost of calibrated efforts to match the target stock of Com-.
This means that the inefficient use of Hake's Northern Stock has resulted in a monetary loss of more than 670 million euros. In particular, there is a significant reduction in France's quota in favor of Spain and the rest of the Union. This result can also be observed in graph 6.3, where the capture routes are illustrated for each of the policies considered.
We can observe in panels (b), (c) and (d) that the side payment solution pushes France's catches below the OCFP policy level, while Spain's and the rest of the Union's are above this level.

Discussion
Data
In the case of the southern hake stock, the artisanal fleet, whose productivity increases with the stock, would buy all permits at auction as long as the stock reaches the efficient value. At the same time, trawler fleet participation would drop from current levels to zero. COUNCIL REGULATION COM final of 28 May 2002, Communication from the Commission on the reform of the Common Fisheries Policy (“Roadmap”).
COUNCIL REGULATION (EC) No. 494/2002 of 19 March 2002 on the introduction of additional technical measures for the recovery of the hake stock in ICES subareas III, IV, V, VI and VII and ICES sections VIIIa,b,d,e. Additional technical measures for the recovery of the hake stock in ICES subareas III, IV, V, VI and VII and ICES divisions VIIIa,b,d,e. The optimality of the common fisheries policy: the northern hake stock, Spanish economic review (forthcoming).
ASTORKIZA(2001): Is the current regulation of Division VIII European Anchovy Optimal?, Environmental and Resource Economics, 19, 53-72. GUTIÉRREZ(1997): Distribution of Potential Gains from International Environmental Agreements: The Case of the Greenhouse Effect, Journal of Environmental Economics and Management, 33, 1-16. ICES CM 2003/ACFM:01, Report of the Working Group on the Assessment of Southern Stocks of Hake, Monkfish and Whitefish.
Numerical Solution of Bellman’s Equation
The random variable is treated as the state variable X and the calibrated distribution of z is used to compute Ez'[V (X', z') | z.
Characterization of the Steady State for the Northern Stock of Hake
By adding (C.4) and (C.5) over k = 1, .., n and taking into account that constraints in the steady-state optimization problem imply that e –lSj. Substituting expressions (C.8) and (C.9) in optimal conditions (C.2), this can be expressed in the steady state as. He was a visiting professor at the Carlos III University of Madrid and the ITAM (Instituto Tecnológico Autonómico de México).
Currently associate professor at the University of the Basque Country, in the Department of Fundamentals of Economic Analysis II, she has been a visiting scholar at the University of California, San Diego and the University of Warwick. She has published articles in the Journal of Environmental Economics Management, Journal of Economic Dynamics and Control, Journal of Institutional and Theoretical Economics, Annales D'Economie et de Statistique and Spanish Economic Review. DT 04/02 The reform of the IRPF and the determinants of labor supply and the Spanish family.
DT 05/03 Retraso, eficiencia y costes: ¿cómo puede la imagen del Departamento de Justicia adaptarse mejor a la realidad?