Introduction
Credit Cards
Credit card pricing puzzles
- Adverse selection, search costs and switching costs
- Rational or irrational consumers
- Fixed and variable interest rates
- Tacit collusion
- Option values
- Credit card fees and risk
Ausubel (1991) documents a significant puzzle in that although the credit card market appears to be a competitive market (with many thousands of providers and few barriers to entry), the actual interest rates charged by credit card providers are both high and sticky. downwards. He argues that it is for this reason that credit card interest rates are so much higher than the zero profit interest rate.
Examining consumer behavior using credit card data
- Personal bankruptcy
- Credit cards and the permanent income hypothesis
To date, this is the only paper in the literature that examines this topic, even though the issue of credit card penalty fees has become very prominent in public policy debates. However, if consumers increase their credit card debt after receiving a credit enhancement.
The pricing of the network interchange fee
An important prediction of the network literature is that the value of a network to its users increases as the number of locations in the network increases, called the network effect. On the other hand, they find that for smaller banks the level of markup is negatively related to their market share in the following year. ATM market share Calculated as the relative weight of each bank's ATMs in the total number of ATMs in the market.
POS market share It is calculated as the relative weight of the POS terminals of each bank in relation to the total number of POS terminals. It shows the impact of ATM investment developments on the entire market. This substitution is further confirmed by the sign of the coefficient of POS transactions for foreign customers in the regression of ATM transactions.
Automated Teller Machines (ATMs)
ATMs in a network
A related prediction is that the value of a network will increase as the number of users increases (called the scale effect). Saloner and Shepard (1995) argue that the greater the geographic distribution of ATMs, the greater the benefits to bank cardholders who are able to access ATMs for their banks in a variety of locations. wide range of locations (ie network effect). One implication of the network effect hypothesis is that a bank that expects to have a larger ATM network in equilibrium (in order to benefit from network effects) will start implementing new ATM technology sooner.
In other words, they claim that the network effect predicts that a larger no. A key finding of Saloner and Shepard (1995) is that the more branches a bank has, the earlier it will introduce new ATM technology in the 1970s. They argue that this is consistent with the network effect hypothesis, which states that the greater the number of network users, the greater the value of the network.
Pricing of ATM services
They argue that ATM market share should influence a bank's choice of whether to impose ATM surcharges through both the direct and indirect effects. The argument that larger market shares of ATMs result in higher ATM surcharges also holds for the indirect effect. The indirect effect is due to customers in smaller banks with relatively few ATMs switching deposit accounts to larger banks with a larger number of ATMs to avoid paying ATM surcharges.
The purpose of Massoud, Saunders and Scholnick (2006) is to empirically investigate whether the option to impose ATM surcharges has actually benefited larger banks and hindered smaller banks. Massoud, Saunders, and Scholnick (2006) find that the level of ATM surcharges is positively related to the market share of major banks' deposits in the following year. Thus, their results indicate that larger banks (which already have large ATM networks) are able to generate a larger market share of deposits by setting ATM surcharges at a higher level, while smaller banks are only able to influence their market share of deposits per establishment of larger ATM networks.
ATM networks and antitrust
The second is that Massoud, Saunders and Scholnick (2006) examine bank-specific data, while Prager (2001) examines data for markets or regions (MSAs, etc.). The policy conclusion that follows from this argument is that antitrust authorities should weigh the benefits of the network against the costs of monopoly power when evaluating jointly owned ATM networks, rather than simply assuming that common ownership is an adequate protection against monopoly power as it currently is. the case. On the other hand, the opposite would occur if ATM mergers created additional market power.
Her main conclusion is that she could find no significant differences in both ATM prices and volumes between merging and non-merging networks. These results imply that either the market power and efficiency impacts of ATM mergers were counterbalanced or they were both very small. The policy implication of this is that consumers were not harmed by the ATM mergers in the study.
ATMs as new technology
Average ATM transaction value It is calculated as the ratio of the total dollar value of the transaction to the total number of transactions for foreign customers from non-network cards (foreign customers). Average POS Transaction Value Calculated as the ratio of the total dollar value of the transaction to the total number of transactions per POS. MALMENDIER(2004): "Contract Design and Self-Control: Theory and Evidence", The Quarterly Journal of Economics, CXIX.
SCHOLNICK(2006a): “The Impact of ATM Surcharges on Larger Versus Smaller Banks: Is There a Switching Effect?”, The Journal of Business, 79 (5). SCHOLNICK(2006b): “The Cost of Being Late: The Case of Credit Card Penalty Fees”, University of Alberta, Working Paper. SHEPARD (1995): “Adoption of Technologies with Network Effects: An Empirical Investigation of ATM Adoption,” The RAND Journal of Economics The Competitive Impact of Disclosure Requirements in the Credit Card Industry,” Journal of Regulatory Economics.
Debit Cards (Point of Sale Networks)
The choice between debit cards and ATM cash
The develops a Nash game where the consumer makes predictions about the ratio of merchants in the economy connected to the POS system. The greater the proportion of merchants connected to POS, the lower will be their demand for cash from ATM networks. On the other hand, the probability that the merchant will install the POS system depends on the proportion of retail consumption that will be paid for using this system.
The consumer's problem in deciding between cash and POS debit cards involves issues such as the costs of using cash from an ATM (which includes both the shoe leather costs of finding an ATM and the costs of using an ATM from another bank. network); the interest lost from holding cash as well as the probability that a merchant will accept POS transactions. A key finding of the model is that a corner solution where there is full POS coverage as well as zero cash usage will exist if the interest rate is above zero (eg 2%). Regarding the policy implications of this paper, Markose and Loke (2003) argue that their model can explain why money demand functions began to break down in the late 1970s as new technologies such as POS and ATM.
Empirical estimates of consumer payment choices
It is calculated as the ratio of ATM revenue from cards of foreign customers (non-banking network) to ATM transaction from non-banking network cards. This variable shows the relative demand (amount of transactions) for ATM services by card users who are customers of the bank. Foreign ATM transactions It is the total number of annual transactions per ATM of foreign customers: this variable indicates the relative demand of customers (the amount of transactions) for ATM services by card users who are not bank customers.
This variable shows the relative demand (amount of transactions) of POS terminals by card users who are customers of the bank. Average ATM Transaction Value It is calculated as the ratio of the total dollar value of the transaction to the total number of transactions for own customers from own network cards (members) for the ATM. Population growth is calculated as a weighted average of the values of this variable in the different territories where the bank operates using as a weighting factor the total number of branches in each territory.
New Estimates on the Substitution Between ATMs and POS
Hypothesis
According to figures from the Blue Book on Payment and Securities Settlement Systems (European Central Bank) and the Red Book on Payment and Settlement Systems (Bank for International Settlements), only the United States shows a higher absolute number of ATMs and POS terminals.
Data and variable definition
Empirical methodology
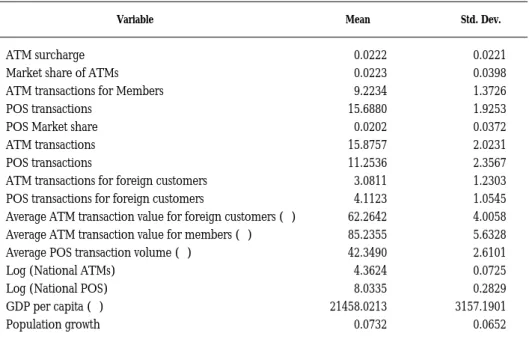
ATM Surcharge This is the surcharge that a bank charges to their non-members within the same card payment network. ATM Transactions Members This is the total number of annual transactions per ATM of members. GDP per capita This is the gross domestic product per capita is calculated as a weighted average of the values of this variable in the different areas where the bank operates by using the total number of branches in each area as the weighting factor.
The last 3 equations (3 to 5) explain the demand for ATM services (by bank customers and foreign customers) as well as the demand for POS services. Our choice of instrumental variables is based on their association with the dependent variables. The instruments include lagged values of bank-level explanatory variables in each equation, as well as different lags of GDP and population growth.
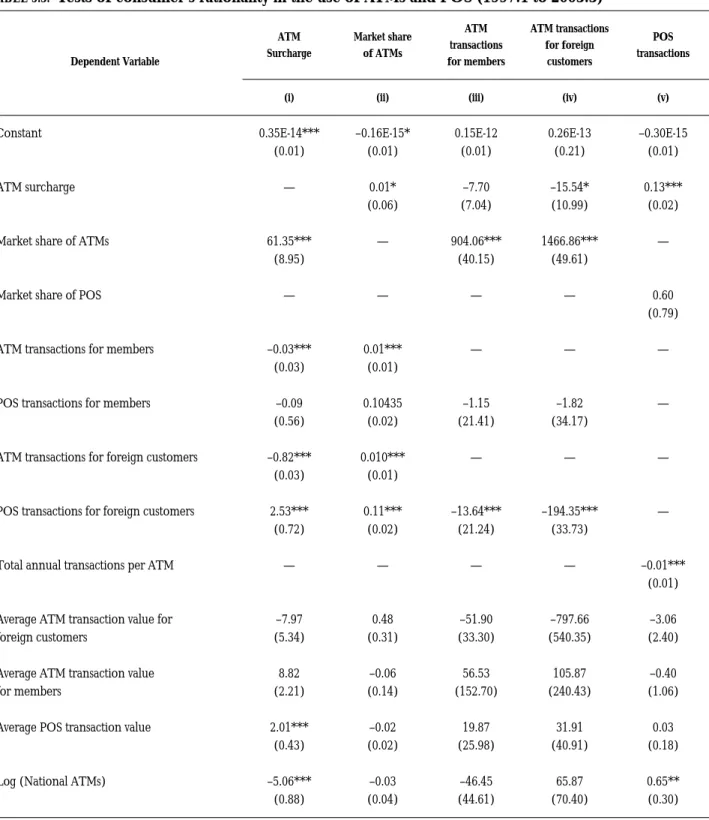
Main results
If the two payment mechanisms are substitutes, we would expect to see the coefficient on ATM in the POS regression negative. As can be seen in column (v) of table 5.3, the sign on the volume of ATM transactions in the POS regression is negative and significant at the 1% level. Our two hypotheses of consumer rationality in using ATMs and POS are tested using estimated coefficients in the ATM transaction for foreign customers and POS transaction (columns iv and v).
The main conclusion of this survey is that research in the area of credit cards, debit cards and ATMs is still unclear and unresolved and that additional research remains to be done. For example, as we describe in detail above, theoretical explanations for the behavior of credit card interest rates in the existing literature include (1) adverse selection, (2) search costs, (3) switching costs, (4) ) rational consumers , (5) time inconsistency on the part of consumers, (6) fixed and variable interest rates, (7) tacit collusion, (8) option value of card debt, and (9) risk and return. At the moment, the main limitation to the progress of additional research in the field of the payment system is the availability of useful data.
The fact that the credit card, debit card, and ATM problems can be analyzed from so many different perspectives provides an important advantage to future researchers on these topics in developing new explanations that are alternative to those already found in the literature. DT 07/05 The New Keynesian Monetary Model: Does it show the link between output and inflation in the US