Journal Pre-proofs
R&D&I Efficiency AS one OF the Sustainable Development Goals (SDGS) In Europe: Application of A Dynamic Model With Network Structure and Cu‐
mulative Divisional Malmquist Index (CDMI)
Vanessa Rodríguez Cornejo, Teresa García Valderrama, Jaime Sánchez Ortiz, Francisca Cabrera Monroy
PII: S0957-4174(23)02840-3
DOI: https://doi.org/10.1016/j.eswa.2023.122338
Reference: ESWA 122338
To appear in: Expert Systems with Applications Received Date: 19 December 2021
Revised Date: 17 August 2023 Accepted Date: 24 October 2023
Please cite this article as: Rodríguez Cornejo, V., García Valderrama, T., Sánchez Ortiz, J., Cabrera Monroy, F., R&D&I Efficiency AS one OF the Sustainable Development Goals (SDGS) In Europe: Application of A Dynamic Model With Network Structure and Cumulative Divisional Malmquist Index (CDMI), Expert Systems with Applications (2023), doi: https://doi.org/10.1016/j.eswa.2023.122338
This is a PDF file of an article that has undergone enhancements after acceptance, such as the addition of a cover page and metadata, and formatting for readability, but it is not yet the definitive version of record. This version will undergo additional copyediting, typesetting and review before it is published in its final form, but we are providing this version to give early visibility of the article. Please note that, during the production process, errors may be discovered which could affect the content, and all legal disclaimers that apply to the journal pertain.
© 2023 Elsevier Ltd. All rights reserved.
R&D&I EFFICIENCY AS ONE OF THE SUSTAINABLE DEVELOPMENT GOALS (SDGS) IN EUROPE: APPLICATION OF A DYNAMIC MODEL WITH NETWORK STRUCTURE AND CUMULATIVE DIVISIONAL MALMQUIST INDEX (CDMI).
Vanessa Rodríguez Cornejo Teresa García Valderrama
Jaime Sánchez Ortiz (*) Corresponding author Francisca Cabrera Monroy
University of Cádiz
Author 1: [email protected] Telephone number: +34956037086 Fax number: +34956015386 Orcid: 0000-0003-2516-4311 Permanent address:
Faculty of Social and Communication Sciences Av. de la Universidad, 4.
Jerez de la Frontera Spain
Author 2: [email protected] Telephone number: +34956015437 Fax number: +34956015386 Orcid: 0000-0002-2453-597X Permanent address:
Faculty of Economics and Business Administration Avda. Duque de Nájera, 8
11002-Cádiz Spain
Author 3 (*) Corresponding author: [email protected] Telephone number: +34956037748
Fax number: +34956015386 Orcid: 0000-0002-3260-7646 Permanent address:
Faculty of Social and Communication Sciences Av. de la Universidad, 4.
Jerez de la Frontera Spain
Author 4: [email protected] Telephone number: +34956015180 Fax number: +34956015789 Orcid: 0000-0002-5665-7066 Permanent address:
Faculty of Economics and Business Administration Avda. Duque de Nájera, 8
11002-Cádiz Spain
TITLE: R&D&I efficiency as one of the sustainable development goals (SDGs) in Europe:
Application of a Dynamic model with Network structure and Cumulative Divisional Malmquist Index (CDMI).
ABSTRACT
In European countries the measurement of the efficiency of Research, Development and Innovation (R&D&I) is a problematic issue for politicians and the general population. For this reason, the United Nations (UN) 2030 Agenda on Sustainable Development Goals (SDGs) signed by UN Member States in 2015 includes SDG 9 for Industry, Innovation and Infrastructure. The objective of this study is to assess whether European countries efficiently manage their R&D&I resources. To meet this objective, the output-oriented Dynamic DEA with Network structure based on SBM framework (DNSBM) is
used under constant returns in order to first, verify how European countries are positioned in their contribution to realizing SDG 9, considering the dynamic relationships between the resources allocated to R&D&I and their results; and, second, define the long-term relationships between them by applying the Cumulative Divisional Malmquist Index (CDMI) model. This work contributes to the advancement of the research via: (1) development of a framework for the analysis of R&D&I efficiency based on a dynamic network optimization model, where the analyzed periods present interdependence based on the relationships between the inputs and outputs of the R&D&I of SDG 9 and (2) development of a new conceptual model to measure efficiency in the management of R&D&I in a sample of European countries.
Keywords: DEA DNSBM; Divisional Malmquist Index; SDG Innovation; R&D&I; European countries
1. Introduction.
The measurement of efficiency in Research, Development and Innovation (R+D+I) at the European level is an issue that concerns politicians and citizens. The investments made in R&D by the countries of the European Union (EU), and the results obtained, have been of particular importance in recent years (Kacprzyk and Świeczewska, 2019; Karadayi and Ekinci, 2019; Paramati et al., 2021). In addition, Mergoni and De Witte (2021) affirm that competitiveness and the development of innovation are relevant concepts in public investment, one of the main sustainable development objectives of the EU.
Mahroum and Al-Saleh (2013) affirm that the efficiency of R&D&I is mainly focused on the cross-sectional static efficiency in a specified period. However, the evaluation of the general efficiency of national investment in R&D&I should be carried out in several long-term periods to determine the performance of governments in the allocation of resources, and in the management of R&D activities, thus establishing the temporal and spatial dimensions within the economy as a whole.
These need to quantify efficiency from a dynamic perspective, explained in the Theory of Dynamic
Efficiency (Kirzner, 1997, 1998) which considers dynamic efficiency as the capacity of an economic system to promote creativity, innovation, and business coordination (North, 1990; Moreno-Casas and Bagus, 2022; Fils et al., 2023).
Nevertheless, there is still a significant research gap in the body of literature on how to measure the dynamic efficiency of R&D&I, and on the relationships between the resources used and the results obtained (Chen and Guan, 2012; Mahroum and Al-Saleh, 2013; Gong et al., 2014; Liu et al., 2014; Chen et al., 2018; Xiao et al., 2021; Liu et al., 2022), in line with UN SDG 9. Specifically, one of the issues that requires more research is related to the interdependence of national R&D&I activities since, to date, studies consider it independently between different periods (Chen and Guan, 2012; Guan and Chen, 2012; Carayannis et al., 2015; Lee et al., 2020). This leads us to affirm that the R&D&I of one period is not independent of the next period, in practice. Further, there are relationships between investments and their results that normally make innovation systems advance or regress in achieving their objectives.
In this context, the first objective of this work consists of developing a framework for the analysis of R&D&I efficiency, based on a dynamic network optimization model, where the analyzed periods present interdependence based on the relationships between the inputs and outputs of the R&D&I of SDG 9. To meet this objective, the output-oriented Dynamic DEA with Network structure based on SBM framework (DNSBM) is used under constant returns in order to first, verify how European countries are positioned in their contribution to realizing SDG 9; and, second, define the long-term relationships between them by applying the Cumulative Divisional Malmquist Index (CDMI) model. Therefore, an analysis of the efficiency of R&D&I, based on a dynamic network optimization model, was carried out, whereby the periods analyzed show interdependence based on the relationships between the inputs and outputs of R&D&I. The model that we propose in this paper aims to solve the problem that characterizes the measurement of the global dynamic efficiency of R&D&I over multiple periods (Chen et al., 2018), and in our case the study period is 2005-2019.
To confirm the robustness of our results, we have completed the Global Efficiency analysis with an analysis of the Malmquist Index, taking into account that it is a dynamic model (Zhu et al., 2020). Therefore, these results make it possible to determine which European countries have grown or not in terms of their R&D&I policies during the period under study. This objective allows progress in the intelligent systems that are implemented in companies, not only for models that are aimed measuring efficiency in R&D&I, but also for models from other fields that require concepts whose analysis is based on dynamic and interdependent data (Zhang et al., 2023).
In addition, as a second objective of the present work, a new conceptual model was developed, in order to measure efficiency in the management of R&D&I. There are studies on R&D&I in countries, cities, or regions (Rousseau and Rousseau, 1997; Nasierowski and Arcelus, 2003;
Hollanders and Esser, 2007; Zabala-Iturriagagoitia et al., 2007; Cullmann et al. 2012; Matei and Aldea, 2012; Lee et al., 2020; Brody et al., 2023), where those authors did not distinguish between quantity and scientific quality; that is, measuring efficiency by differentiating between scientific and research production, or knowledge generation and scientific quality, or its transfer phase. The model shown in the present study allows solving one of the main limitations identified by Carayannis et al.
(2016) in the measurement models of efficiency in R&D&I, with the result that producing a greater number of scientific articles is not necessarily related to a higher level of quality in scientific production. Therefore, the usefulness of the proposed model lies precisely in dividing the levels of efficiency into two divisions; on the one hand, the levels of efficiency for scientific production (i.e., the number of documents published in journals) and on the other hand, the quality and scientific impact of those publications (i.e., h-index, number of citations or patents).
The data used in our study were extracted from the system of outputs and inputs of R&D&I in Europe during the period 2005-2019 (published by Eurostat), and specifically the data related to UN SDG 9, in relation to publications, citations, and h-index of European researchers, classified by country, in data published by Scival (Elsevier). The structure of the rest of this work is as follows. In
section 2 a review of the literature of the common measures on R&D&I and on SDG 9 at the European level is carried out, collecting the existing studies in the body of literature on the measurement of R&D&I efficiency when applying the DEA methodology, which is the methodology used in the present study. Next, in section 3, the longitudinal and cross-sectional R&D&I dynamic study framework is explained, proposing a dynamic network DEA model for multiple periods and presenting the empirical study of 32 European countries for the period of 2005 to 2019. Finally, the results, the discussion, and the conclusions are presented in the remaining sections.
2. Literature review.
2.1. The importance of measuring R&D&I efficiency in European countries.
Currently, countries move in a dynamic environment that they must face if they want to continue growing and developing as a nation. Therefore, they must monitor, and respond flexibly to, the steps and strategies that are detected in that environment. Innovation has become one of the main objectives to achieve compliance with the SDGs (Bastien and Holmarsdottir, 2017; Chataway et al., 2017; Dahl-Andersen and Johnson, 2015; Schot et al., 2018). Innovation and technological progress are key to discovering durable solutions to economic and environmental challenges, such as increasing energy and resource efficiency (United Nations Economic and Social Council, 2019). Orhan and Guajardo (2021) explain the importance of United Nations Sustainable Development Goals (UNSDGs) in developing countries, including the innovation goal.
The United Nations SDG 9 states that policies have been carried out to promote innovation in the EU. According to a worldwide report published by the United Nations Economic and Social Council (2019), investment in R&D&I as share of Gross Domestic Product (GDP) increased from 1.5% in 2000 to 1.7% in 2015, and remained almost unchanged in 2017. To promote innovation and to achieve SDG 9, European institutions have reached a political agreement on Horizon Europe and the EU Research and Innovation Framework Program for the period of 2021-2027 (European Union, 2019).
In addition, as an economic activity, innovation is a dynamic concept that requires a methodology which allows its performance to be measured over time (Tone and Tsutsui, 2014), and in the present study is supported by the Theory of Dynamic Efficiency (Kirzner, 1997, 1998). This theory explains that dynamic efficiency can be considered as the capacity of an economic system to promote creativity, innovation, and business coordination (North, 1990). For this reason, the Theory of Dynamic Efficiency demonstrates that in the analysis of economic efficiency of activities that evolve rapidly (such as innovation), the dynamic dimension should not be forgotten, since it is a basic element to be considered in all studies of economic efficiency, which not only opens a valuable field for future researchers in this discipline, but also results in the development of economic science in the service of humanity, which is much more high-yielding and dynamically efficient (Leibestein, 1966;
Robbins 1972; Lipsey 1973; North, 1999).
2.2. Measurement of R&D&I efficiency: the DEA methodology used by countries.
The measurement of innovation becomes a complex process since it affects different parts of the organization (Tidd and Bessant, 2020). In this sense, the methods that present a higher degree of precision in the measurement of efficiency are non-parametric (the most prominent being Data Envelopment Analysis, DEA), allowing to quantify the multiple innovation factors and obtain robust results on its impact on public and private organizations (Nasierowski and Arcelus, 2003).
The DEA methodology has been used to measure the efficiency of some innovation factors in certain countries (Sharma and Thomas, 2008; Matei and Aldea, 2012). Because innovation is a relatively complex process that affects various activities of the organization, Network DEA has been applied in some studies to solve this problem (Chen and Guan, 2012; Guan and Chen, 2012;
Carayannis et al., 2015), but it is mostly static in its approach.
To study the effect of innovation in certain regions and countries (Zabala-Iturriagagoitia et al., 2007; Chen and Guan, 2012; Chen et al., 2018), two innovation processes (production and commercialization of knowledge) are used that affect various stages of their respective value chains (Carayannis et al., 2015). The Network DEA model is, therefore, an appropriate method with which to measure the impact of innovation in different geographical locations.
Kotsemir (2013) performed a bibliographic analysis on the most suitable variables that can be used to measure innovation using DEA models. Among them, inputs such as spending on innovation or R&D personnel over total GDP are noteworthy. As outputs, there are patents, high technology exports, or the number of publications. Broekel et al. (2018) use a DEA model with shared inputs and outputs to explain the innovation efficiency of different regions of Germany using R&D employees as inputs and patents as outputs.
Furthermore, it is necessary to explain why efficiency models are linked to innovation processes. Guan and Chen (2012) undertook a study in which they identified Greece and Ireland as efficient countries in all the models they applied. Those authors concluded that being an innovative country resulted in a higher level of efficiency of that country in the use of physical, human, and financial resources that are directly related to innovation (Matei and Aldea, 2012; Nasierowski and Arcelus, 2012).
However, Zabala-Iturriagagoitia et al. (2007) note that in their study, having fewer resources did not mean countries would consequently achieve lower levels of efficiency in innovation because, with the few financial, physical, and human resources of certain regions, they were able to obtain more efficient results in innovation than regions with more resources whose results were less efficient (since they needed to use more resources to achieve results in innovation). Therefore, in some cases, countries with more stable innovation policies were unable to achieve better innovation efficiency results than countries with fewer resources.
Carayannis et al. (2016) note that in many cases a DEA model with several stages is used to measure innovation, because innovation efficiency requires a common set of inputs and outputs, which in many cases are considered intermediate inputs and outputs (Lewis and Sexton, 2004; Färe et al., 2007).
Network DEA defines multiple stages or levels in the innovation model, allowing and helping to measure the efficiency of innovation management in certain countries, and the models in some studies are noteworthy (Wu et al., 2010; Lv, 2011; Cullmann et al., 2012; Choi et al., 2013; Chun et al., 2015; Kou et al., 2016).
Table 1 shows the most relevant studies that measure the levels of efficiency in innovation at the international, national, regional, and local levels.
Table 1 Studies on the measurement of R&D&I Efficiency.
AUTHORS DEA MODEL LEVEL INPUTS OUTPUTS
(Sharma and Thomas, 2008)
VRS (variable returns to scale) and CRS (constant returns to scale), input-oriented DEA model
International -Gross Domestic Expenditure on R&D
-Researchers per Million population.
-Gross Domestic Product (GDP) as input Population.
-External patents by residents.
-Patents by a country’s residents.
-National productivity.
AUTHORS DEA MODEL LEVEL INPUTS OUTPUTS
(Pan et al.,
2010) VRS (variable returns to scale), input- oriented DEA model;
Super-efficiency in DEA model; Bilateral comparisons in DEA model
International -Total public expenditure on education.
-Imports of goods and commercial services -Total expenditure on R&D.
-Direct investment stocks abroad.
-Total R&D personnel nationwide.
-Number of patents granted to residents.
-Number of patents secured abroad by national residents.
- Published
scientific articles by origin of author.
(Abbasi et
al., 2011) DEA-based innovation index using VRS (variable returns to scale) output-oriented DEA model
International -Number of scientists in R&D -Expenditure on education and R&D expenditures.
-Patent counts, royalty incomes and license fees, -High-technology export and manufacturing exports.
(Chen et al.,
2011) CRS (constant returns to scale) output- oriented DEA model
International -R&D expenditure stocks (million US dollars in year 2000).
-Total R&D manpower (full- time equivalent units).
-Patents applied for in the EPO and USPTO.
-Scientific journal articles.
-Royalty and licensing fees.
(million US dollars in year 2000).
(Guan and
Chen, 2012) CRS and VRS, Network (2-stage) output-oriented Super-efficiency model
National -Number of full-time equivalent scientists and engineers, Incremental R&D.
-Expenditure funding innovation activities, Prior accumulated knowledge stock breeding upstream knowledge production
-Consumed full-time equivalent labour for non-R&D activities.
-Number of patents granted (intermediate)
-Number of patents granted
(intermediate).
-International scientific papers, Added value of industries.
-Export of new products in high- tech industries.
AUTHORS DEA MODEL LEVEL INPUTS OUTPUTS
(Carayannis
et al., 2015) VRS multistage, multilevel (2 stages x 2 levels) model
National and
Regional -Science graduates in tertiary education.
-Participation in lifelong learning.
-Total R&D expenditures, R&D capital stock.
-Citable documents (intermediate).
-Patent applications (intermediate).
-Employment in knowledge- intensive
services/manufacturing intermediate).
-SMEs collaborating with others (intermediate).
-Venture capital investment (intermediate).
-High Tech Exports.
-Sales of new to market and new to firm innovation.
-License and patent revenues from abroad.
-Number of trademark applications in national offices.
(Carayannis,
et al., 2016) Network DEA model International -Science graduates in tertiary education (thousands).
-Eurostat Participation in lifelong learning (%).
-Eurostat Total R&D expenditure (billion euros).
-IUS, own calculations R&D capital stock.
Intermediate variables:
-Citable documents (thousands).
-SCImago Patent applications (thousands).
Employment in knowledge- intensive services/manu- facturing (% of employment). - SMEs collaborating with others (% of SMEs).
-High Tech Exports (billions USD).
-World Bank Sales of new to market and new to firm innovation (%
turnover).
-License and patent revenues from abroad (billions of euros).
-Number of trademark applications in national offices (thousands).
AUTHORS DEA MODEL LEVEL INPUTS OUTPUTS -Venture capital investment
(billions of euros).
(Kou et al., 2016)
Multi-period, multi-division DEA model
International -R&D personnel.
-R&D capital Stock.
-Technology import; patents.
-S&T_papers Export of high-tech products GDPP of employment.
(Zuo and
Guan, 2017) Parallel DEA game model
Regional Full-time equivalent Researchers, Expenditure on R&D.
-Number of granted patents.
(Broekel et
al., 2018) Shared-input DEA
model Regional R&D employment -Patent.
(Zemtsov and Kotsemir, 2019)
Long-period DEA
model Regional -Technological development
(R&D expenditures per GDP, R&D expenditures per GDP).
-Industrial specialization (share of the processing industry in GDP).
-Embeddedness -Knowledge spillovers ln -RIS inner interactions ln
(Lee et al.,
2020) SBM-DEA Local -R&D cost (US$ Billion) and
Researchers (person). -Papers and Patents.
Sharma and Thomas (2008) use the number of researchers and R&D funding as a function of GDP (%) as input variables and publications and patents as output variables. Guan and Chen (2012) use a Network DEA model with intermediate outputs such as the number of patents. One of the most recent works on innovation management in certain regions of Russia is by Zemtsov and Kotsemir (2019) where they use a dynamic DEA with variables such as R&D expenses or the potential of knowledge of the region as a function of total GDP (%). Some authors (Sharma and Thomas, 2008;
Pan et al., 2010; Lee et al., 2020) use the number of publications as final output variable.
Based on the studies undertaken in recent years that were analyzed, we can affirm that innovation is a multidimensional concept and, in order to measure efficient management in innovation
policies, the need to use models integrating factors that affect international innovation systems should be taken into account at the national, regional, and local levels (Carayannis et al., 2016).
However, although the DEA methodology is widely used to measure R&D&I efficiency, there are other methodologies that also allow it to be measured. Prokop et al. (2019) have used a logistic regression analysis to measure innovation collaboration networks in small countries, Meissner (2019) has measured innovation cooperation through a qualitative methodology, Weerakoon et al. (2019) have studied the creation of knowledge in innovation in companies using structural equations, and Prokop et al. (2021) have evaluated the efficiency in national ecosystems through a two-step DEA model, using fsQCA (Fuzzy-set Qualitative Comparative Analysis).
3. Empirical study.
3.1. Objectives
The objective of this study is to develop (i) a framework for the analysis of R&D&I efficiency based on a dynamic network optimization model, where the analyzed periods present interdependence based on the relationships between the inputs and outputs of the R&D&I of SDG 9, and (ii) a new conceptual model to measure efficiency in the management of R&D&I in countries by establishing two divisions: (1) the quantity of publications generated is indicated, or knowledge generation phase (Division 1 and Division 2 in period t in the model), and (2) the quality of these publications is measured (publication impact index), or knowledge transfer phase (Division 1 and Division 2 in the period t+1 in the model). To meet these objectives, the output-oriented Dynamic DEA with Network structure based on SBM framework (DNSBM) is used under constant returns in order to first, verify how European countries are positioned in their contribution to realizing SDG 9, considering the dynamic relationships between the resources allocated to R&D&I and their results; and, second, define the long-term relationships between them by applying the Cumulative Divisional Malmquist Index (CDMI) model.
European countries are administratively and economically independent geographical regions, and both the mobilization of the workforce and the operation of the entire innovation process occur at the national level. We have studied the R&D system in Europe in the dataset published by the European Commission and for this, panel and year data are used during the period of 2005-2019 to monitor the SDGs. In order to promote the strategy to achieve the SDGs at the European level and build a more innovative Europe, the European Commission began to record the performance of the UN SDG 9 in 2005 through indicators linked to development.
3.2. Indicators and measurements
The analysis is based on Eurostat data for the period of 2005 to 2019 for 32 European countries. SDG 9 recognizes the importance of technological progress and innovation in finding durable solutions to social, economic, and environmental challenges. Monitoring SDG 9 in the EU context focuses on the progress made in strengthening R&D&I and promoting sustainable transport.
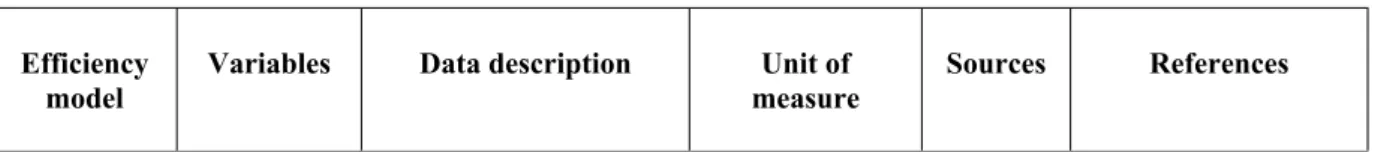
Based on these objectives, the variables used in the model are shown in Table 2.
Table 2 Study variables.
Efficiency
model Variables Data description Unit of
measure Sources References
X1: Gross domestic expenditure on R&D by sector (Input)
The indicator measures gross domestic expenditure on R&D (GERD) as a percentage of the gross domestic product (GDP). “Research and experimental
development (R&D) comprise creative work undertaken on a systematic basis in order to increase the stock of knowledge, including knowledge of man, culture and society and the use of this stock of knowledge to devise new applications”
% of GDP Eurostat Sharma and Thomas (2008); Kou et al.
(2016); Zemtsov and Kotsemir (2019).
X2: Human resources in science and technology (Input)
The indicator measures human resources in science and technology (HRST) as a share of the active population in the age group 25-64
years. HRST
encompasses people who have successfully completed tertiary education or who are employed in science and technology occupations where this education level is required.
% of active population aged 25 to 64 years.
Eurostat Sharma and Thomas (2008); Pan et al (2010); Abbasi et al.
(2011);Chen et al.
(2011); Guan and
Chen (2012);
Carayannis et al.
(2015); Carayannis et al. (2016); Kou et al.
(2016); Zuo and Guan (2017); Broekel et al. (2018); Lee et al (2020).
Inputs
X3: R&D personnel by sector (Input)
The indicator measures the share of R&D personnel broken down into the following institutional sectors:
business enterprise (BES), government
(GOV), higher
education (HES), private non-profit (PNP).
% of active
population. Eurostat Sharma and Thomas (2008); Pan et al (2010); Abbasi et al.
(2011);Chen et al.
(2011); Guan and
Chen (2012);
Carayannis et al.
(2015); Carayannis et al. (2016); Kou et al.
(2016); Zuo and Guan (2017); Broekel et al. (2018); Lee et al (2020).
Y1: Patent applications to the European Patent Office (Output)
The indicator measures the number of applications for patent protection of an invention filed with the European Patent Office (EPO) regardless of whether or not they are granted.
Number of
Patents per year. Patent applicati ons to the European Patent Office
Sharma and Thomas (2008); Pan et al (2010); Abbasi et al.
(2011);Chen et al.
(2011); Guan and
Chen (2012);
Carayannis et al.
(2015); Carayannis et al. (2016); Kou et al.
(2016); Zuo and Guan (2017); Broekel et al. (2018); Lee et al (2020).
Y2:
Documents (Output)1
Published scientific
publications for country. Number of publications per year.
Scimago Journal
&
Country Rank
Pan et al (2010);
Chen et al. (2011);
Guan and Chen (2012).
Y3: Citation (Output)2
Whole period citations
for documents
published during the year.
Number of citations for documents published.
Scimago Journal
&
Country Rank
Pan et al (2010);
Chen et al. (2011);
Guan and Chen (2012); Carayannis et
al. (2015);
Carayannis et al.
(2016).
Outputs
Y4: h-index (Output)3
The h-index is a system proposed by Jorge Hirsch, from the University of California, in 2005 to measure the professional quality of physicists and other scientists, based on the number of citations their scientific articles have received.
It is calculated by ordering the scientific articles
according to the number of citations received, the H- Index being the number for which the order number
coincides with
Scimago Journal
&
Country Rank
Guan and Gao (2009); Montazerian et al. (2019).
1 This variable (Y2) refers to the number of papers published (quantity) by European researchers.
2 This variable (Y3) is a proxy variable for quality such as the number of total citations in absolute values that these published research papers have received.
3 Scopus® also displays citations from Web and patent sources that are cited in Scopus® records in the Abstract + Citation database. Patent Citations are from key patent offices, and Web Citations are from carefully selected Web resources such as Courseware sites, theses and dissertation databases, institutional repositories, as well as other carefully selected Web resources. See page 8 of the document on SCOPUS® that has been prepared by Elsevier: {HYPERLINK https://www.elsevier.com/?a=69451} and Scimago: [HYPERLINK https://www.scimagolab.com/productos/informe- cienciometrico}.
the number of citations.
3.3. DEA methodology: Dynamic DEA with Network structure based on SBM framework (DNSBM).
The DNSBM is the composite of network SBM (NSBM) and dynamic SBM (DSBM) (Tone and Tsutsui, 2014). Mariz et al. (2018) note that there is an increase in the number of publications with Dynamic Data Envelopment Analysis (DDEA) models in recent years. We suggest using the efficiency evaluation, taking into account the vertical relationships, which consist of different efficiency models with different inputs and outputs connected through Links. We have called each of the groupings of indicators Divisions, as define by those authors. The horizontal relationships are made by combining the previous network structure with the carry-over between periods, or carry-over variables.
In this case, we measure the efficiency of the European countries, taking into account: (a) The global efficiency in the entire period under observation, (b) the dynamic change that occurs in the efficiency of the period, and (c) the dynamic change within each Division.
This model can be oriented to (i) both inputs and outputs, or (ii) both constant returns to scale (CRS) or variables (VRS).
One of the possibilities of dynamic analysis is the application of a new Malmquist Divisional index. In Fig. 1 we have collected the Dynamic DEA with Network structure (Tone and Tsutsui, 2014).
Fig. 1. Dynamic DEA with Network Structure Model. Adapted from Tone and Tsutsui (2014).
The DMUs “n” (j = 1, ..., n) of each Division “K” (k = 1, ..., K) are in each period of time T (t
= 1, ..., T ). For each link that leads from Division “k” to Division “h” by (k, h) and the set of links by
“L”, the inputs and outputs and link variables are the following:
i) Inputs and outputs:
(input resource “i” to DMUj
{
𝑋𝑡𝑖𝑗𝑘∈ 𝑅+}(𝑖= 1, K, 𝑚𝑘; 𝑗= 1, K, 𝑛;𝑘= 1, K, 𝐾;𝑡= 1, K, 𝑇)for Division “k” in period “t” ) (1)
(output product “i” from DMUj,
{
𝑌𝑡𝑖𝑗𝑘∈ 𝑅+}(𝑖= 1, 𝐾, 𝑟𝑘; 𝑗= 1, 𝐾, 𝑛;𝑘= 1, 𝐾, 𝐾;𝑡= 1, 𝐾, 𝑇)Division “k”, in period “t” ). (2)
ii) Links:
{
𝑍𝑡𝑗(𝑘h)𝑙∈ 𝑅+}(𝑗= 1, K, 𝑛; 𝑙= 1, K, 𝐿𝑘h;𝑡= 1, K, 𝐾;𝑡= 1, K, 𝑇) (3)This links the intermediate products between the DMUs from the Division “k” to Division “h”
in period “t”, where Lkh is the number of variables from “k” to “h”.
iii) Carry-overs:
{
𝑍(𝑡, 𝑡𝑗𝑘𝑙 + 1)∈ 𝑅+}(𝑗= 1, K, 𝑛; 𝑙= 1, K, 𝐿𝑘;𝑘= 1, K, 𝐾; 𝑡= 1, K, 𝑇-1) (4)From DMUj of Division “k”, from period “t” to period t+1, where LK is the number of indicators in the carry-over from Division “k”).
Related activities are treated as output from the preceding Division to the next.
(5) 𝒛𝑡𝑜(𝑘h)𝑜𝑢𝑡=𝒁𝑡(𝑘h)𝑜𝑢𝑡𝞴𝑡𝑘-𝒔𝑡𝑜(𝑘h)𝑜𝑢𝑡 ((𝑘h)𝑜𝑢𝑡= 1,…𝑙𝑖𝑛𝑘𝑜𝑢𝑡𝑘)
where 𝒔𝑡𝑜(𝑘h)𝑜𝑢𝑡∈ 𝑅𝐿(𝑘h)𝑜𝑢𝑡 is slacks-based and non-negative and linkoutk is the number of “as output”
links from Division “k”.
The overall efficiency would be equal to:
𝜃𝑜∗ =𝑚𝑖𝑛
∑𝑇
𝑡= 1𝑊𝑡
[
∑𝐾𝑘= 1𝑤𝑘[
1―𝑚𝑘+𝑙𝑖𝑛𝑘𝑖𝑛1𝑘+𝑛𝑏𝑎𝑑𝑘(
∑𝑚𝑖= 1𝑘 𝒔𝒙𝑡 ―𝑖𝑜𝑘𝑡𝑖𝑜𝑘+∑𝑙𝑖𝑛𝑘𝑖𝑛(𝑘,ℎ)𝑙= 1𝑘 𝒔𝒛𝑡𝑜(𝑘,ℎ)𝑡𝑜(𝑘,ℎ)𝑙 𝑙 𝑖𝑛𝑖𝑛+∑𝑛𝑏𝑎𝑑𝑘𝑙= 1𝑘𝒔𝒛(𝑡,𝑡𝑜𝑘(𝑡,𝑡𝑜𝑘𝑙 𝑙 𝑏𝑎𝑑𝑏𝑎𝑑+ 1)+ 1)) ] ]
∑𝑇
𝑡= 1𝑊𝑡
[
∑𝐾𝑘= 1𝑤𝑘[
1―𝑟𝑘+𝑙𝑖𝑛𝑘𝑜𝑢𝑡1𝑘+𝑛𝑔𝑜𝑜𝑑𝑘(
∑𝑟𝑖𝑘= 1𝒔𝒚𝑡𝑖𝑜𝑘𝑡𝑖𝑜𝑘+ +∑𝑙𝑖𝑛𝑘𝑜𝑢𝑡(𝑘,ℎ)𝑙= 1𝑘𝒔𝒛𝑡𝑜(𝑘,ℎ)𝑡𝑜(𝑘,ℎ)𝑙 𝑙 𝑜𝑢𝑡𝑜𝑢𝑡+∑𝑛𝑔𝑜𝑜𝑑𝑘𝑙= 1𝑘𝒔𝒛(𝑡,𝑡𝑜𝑘(𝑡,𝑡𝑜𝑘𝑙 𝑙 𝑔𝑜𝑜𝑑𝑔𝑜𝑜𝑑+ 1)+ 1)) ] ]
with ∑𝑇 , where is the
𝑡= 1𝑊𝑡= 1, ∑𝐾
𝑘= 1𝑤𝑘= 1, 𝑊𝑡≥0(∀𝑡),𝑤𝑘≥0(∀𝑘) 𝑊𝑡(𝑡= 1, K, 𝑇) weight of period t” y 𝑤𝑘(𝑘= 1, K, 𝐾) is the weight of Division “k”.
The efficiency of each period is defined as follows:
Ʈ𝑡𝑜∗=
∑𝐾
𝑘= 1𝑤𝑘
[
1―𝑚𝑘+𝑙𝑖𝑛𝑘𝑖𝑛1𝑘+𝑛𝑏𝑎𝑑𝑘(
∑𝑚𝑖= 1𝑘 𝒔𝒙𝑡 ―𝑖𝑜𝑘𝑡𝑖𝑜𝑘+∑𝑙𝑖𝑛𝑘𝑖𝑛(𝑘,ℎ)𝑙𝑘= 1𝒔𝒛𝑡𝑜(𝑘,ℎ)𝑡𝑜(𝑘,ℎ)𝑙 𝑙 𝑖𝑛𝑖𝑛+∑𝑛𝑏𝑎𝑑𝑘𝑙= 1𝑘𝒛𝒔(𝑡,𝑡𝑜𝑘(𝑡,𝑡𝑜𝑘𝑙 𝑙 𝑏𝑎𝑑𝑏𝑎𝑑+ 1)+ 1)) ]
∑𝐾𝑘= 1𝑤𝑘
[
1―𝑟𝑘+𝑙𝑖𝑛𝑘𝑜𝑢𝑡1𝑘+𝑛𝑔𝑜𝑜𝑑𝑘(
∑𝑟𝑖𝑘= 1𝒔𝒚𝑡𝑖𝑜𝑘𝑡𝑖𝑜𝑘+ +∑𝑙𝑖𝑛𝑘𝑜𝑢𝑡(𝑘,ℎ)𝑙= 1𝑘𝒔𝒛𝑡𝑜(𝑘,ℎ)𝑡𝑜(𝑘,ℎ)𝑙 𝑙 𝑜𝑢𝑡𝑜𝑢𝑡+∑𝑛𝑔𝑜𝑜𝑑𝑘𝑙= 1𝑘𝒔𝒛(𝑡,𝑡𝑜𝑘(𝑡,𝑡𝑜𝑘𝑙 𝑙 𝑔𝑜𝑜𝑑𝑔𝑜𝑜𝑑+ 1)+ 1)) ]
(𝑡)= 1,K ,𝑇)(6)
On the other hand, p, the efficiency of each Division is defined as:
𝜌𝑡𝑜𝑘∗ =
1― 1
𝑚𝑘+𝑙𝑖𝑛𝑘𝑖𝑛𝑘+𝑛𝑏𝑎𝑑𝑘
(
∑𝑚𝑘𝑖= 1𝒔𝑡 ―𝒙𝑡𝑖𝑜𝑘𝑖𝑜𝑘+∑𝑙𝑖𝑛𝑘𝑖𝑛𝑘(𝑘,ℎ)𝑙= 1𝒔𝑡𝑜(𝑘,ℎ)𝒛𝑡𝑜(𝑘,ℎ)𝑙 𝑙 𝑖𝑛𝑖𝑛+∑𝑛𝑏𝑎𝑑𝑘
𝑘𝑙= 1 𝒔(𝑡,𝑡+ 1)
𝑜𝑘𝑙 𝑏𝑎𝑑 𝒛(𝑡,𝑡+ 1) 𝑜𝑘𝑙 𝑏𝑎𝑑
)
1― 1
𝑟𝑘+𝑙𝑖𝑛𝑘𝑜𝑢𝑡𝑘+𝑛𝑔𝑜𝑜𝑑𝑘
(
∑𝑟𝑘𝑖= 1𝒔𝑡𝒚𝑡𝑖𝑜𝑘𝑖𝑜𝑘++∑𝑙𝑖𝑛𝑘𝑜𝑢𝑡𝑘(𝑘,ℎ)𝑙= 1𝒔𝑡𝑜(𝑘,ℎ)𝒛𝑡𝑜(𝑘,ℎ)𝑙 𝑙 𝑜𝑢𝑡𝑜𝑢𝑡+∑𝑛𝑔𝑜𝑜𝑑𝑘
𝑘𝑙= 1 𝒔(𝑡,𝑡+ 1)
𝑜𝑘𝑙 𝑔𝑜𝑜𝑑 𝒛(𝑡,𝑡+ 1)
𝑜𝑘𝑙 𝑔𝑜𝑜𝑑
)
(𝑘= 1,K ,𝐾;𝑡= 1,K ,𝑇)The efficiency will be different for each Division in each period. In our case, having used an output-oriented model in this study, the global efficiency will be the geometric mean of the efficiencies of all the Divisions.
3.4. New Malmquist Index based on the period-divisional efficiency score.
In this paper, we define a Malmquist index based on the period-divisional efficiency score (Keikha-Javan and Rostamy-Malkhalifeh, 2014), as follows.
i) Divisional catch-up index (DCU).
We calculate the relationship between division-period efficiencies “t” and “t+1” using the catch-up index as follows:
𝐷𝐶𝑈=𝛾𝑡→ 𝑡𝑜𝑘 + 1=𝜌
𝑡+ 1* 𝑜𝑘
𝜌𝑡𝑜𝑘* (𝑡= 1,K ,𝑇-1;𝑘= 1,K ,𝐾;𝑜= 1,K,𝑛).
DCU >1, DCU = 1, DCU and DCU <1 indicate progress, status quo and regression in catch-up effect, respectively.
ii) Divisional frontier-shift effect (DFS).
We will study the effect on each border of each Division through the indicator: the divisional frontier-shift effect of 𝜎𝑡→ 𝑡𝑜𝑘 + 1.
iii) Divisional Malmquist index (DMI), Overall Malmquist index (OMI) and Cumulative Malmquist index (CDMI).
Taking into consideration the previous indicators, we will define the Divisional Malmquist index (DMI) by their product:
𝐷𝑀𝐼=𝐷𝐶𝑈×𝐷𝐹𝑆=𝜇𝑡→ 𝑡𝑜𝑘 + 1=𝛾𝑡→ 𝑡𝑜𝑘 + 1𝜎𝑡→ 𝑡𝑜𝑘 + 1 (𝑡= 1,K ,𝑇-1;𝑘= 1,K ,𝐾;𝑜= 1,K,𝑛)
The overall Malmquist index (OMI) is obtained through the geometric mean of the Divisional Malmquist index (DMI)
𝑂𝑀𝐼=𝜇𝑜=П𝐾𝑘= 1(𝜇𝑜𝑘)𝑤𝑘 (𝑜= 1,K ,𝑛)
Where 𝜇𝑜𝑘 is the weighted geometric mean of 𝜇𝑡→ 𝑡𝑜𝑘 + 1 (𝑡= 1,K ,𝑇-1) and 𝑤𝑘≥0 is the weight of division “k” with ∑𝐾 .
𝑘= 1𝑤𝑘= 1
The Cumulative Divisional Malmquist Index (CDMI) would be:
(9)
(10)
(11)
(12) (7)
(8)(9)
𝐶𝐷𝑀𝐼=𝜉1→ 𝑇𝑜𝑘 =П𝑇𝑡= 1-1𝜇𝑡→ 𝑡𝑜𝑘 + 1 (𝑜= 1,K ,𝑛 :𝑘= 1,K , 𝐾)
and the Cumulative Overall Malmquist Index (COMI) would be:
𝐶𝑂𝑀𝐼=𝜉1→ 𝑇𝑜 =П𝐾𝑘= 1
(
𝜉1→ 𝑇𝑜𝑘)
𝑤𝑘 (𝑜= 1,K ,𝑛)CDMI turns out to be:
𝐶𝐷𝑀𝐼=𝜇1→ 𝑇𝑜𝑘 ×П𝑇𝑡= 2-1𝜑𝑡𝑜𝑘
The intertemporal efficiency change between Period 1 and Period T will be modified at each moment of the different periods.
4. Estimation of R&D&I Efficiency in Europe. Proposal for Dynamic DEA with Network structure based on SBM framework (DNSBM) and Divisional Malmquist Index (DMI).
In this section we apply the DNSBM model, obtaining both the Global Efficiency Indices (GEI) by countries, as well as the Divisional Malmquist Index (DMI) and the Cumulative Divisional Malmquist Index (CDMI). With this model we aim to measure and study R&D&I dynamically in the network over a period of 15 years (2005-2019).
Although most approaches consider the innovation system as a single system, using a deeper approach an innovation system can be considered as being composed of two sub-processes. According to Chen et al. (2018) a knowledge production process (KPP) is responsible for the transformation of inputs related to research into knowledge results. This multi-stage approach is consistent with several innovation efficiency studies (see, for example, Guan and Chen, 2012; Liu et al., 2014). In a second stage, Chen et al. (2018) recognize a knowledge commercialization process (KCP) that is transformed into knowledge results and commercial/monetary results. This process also takes place on multiple levels.
It is important to consider the intertemporal dependence that influences the production ratio of the multi-period R&D&I system. When dealing with multiple interrelated periods, overall efficiency must be measured dynamically, in consecutive periods, otherwise the resulting efficiency measures will be misleading. In terms of the multi-stage production process over multiple periods, we have used the dynamic DEA model in order to model the national R&D efficiency of multiple periods. The model used is oriented to output under constant returns.
In this study, we use simultaneous measures of general efficiency and all period-specific efficiencies; specifically, the Tone and Tsutsui model (Tone and Tsutsui, 2014) based on the traditional SBM model in which we are dealing with multiple countries connected by network structure links within each period and, horizontally, we combine the network structure by means of transfer activities between two successive periods. As Chen et al. (2018) point out, this model can evaluate (1) the general efficiency during the whole observed period, (2) the dynamic change of the efficiency of the period, and (3) the dynamic change of the efficiency by countries.
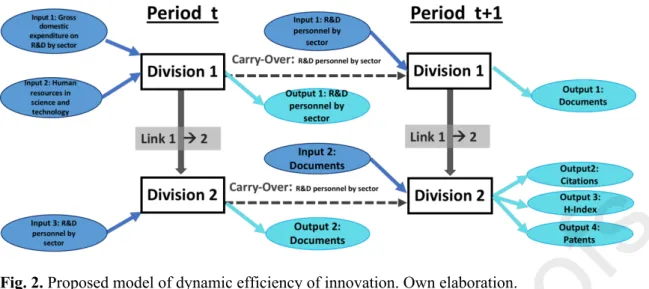
Specifically, Fig. 2 shows the dynamic network DEA model proposed in this work.
(13)
(14)
Fig. 2. Proposed model of dynamic efficiency of innovation. Own elaboration.
In the proposed model, and illustrated in Fig. 2, we represent how the efficiency of R&D&I is measured in several interconnected periods, both vertically and horizontally, where the DMUs are the 32 European countries analyzed. The horizontal network (or transfer) is composed of the input variables in period t that will be treated as outputs in period t + 1.
A knowledge production process (KPP) is responsible for the transformation of inputs related to research into knowledge results in period t. This multi-stage approach is consistent with several innovation efficiency studies (Guan and Chen, 2012; Liu et al., 2014; Carayannis et al., 2016). In a second stage, Chen et al. (2018) recognize a knowledge commercialization process (KCP) that is transformed into knowledge results and Knowledge transference in the period t+1. This process also takes place on multiple levels.
The vertical network in Period t connects the efficiency of the DMUs analyzed. In our model, Division 1 in period t is made up of the input variables: Gross domestic expenditure on R&D by sector and Human resources in science and technology, with the Output variable being the number of R&D personnel by sector. In Division 2 in period t, the input is: number of R&D personnel by sector and the output is: number of Documents.
The efficiency carry-over variable from one period to another (carry-over variable) is the
“number of R&D personnel” by sector from one period to the next. Numerous studies consider R&D&I personnel to be the real driving force behind the efficiency of these activities, and there is currently great concern in the scientific field over increasing the recruitment of researchers in Europe (Çağlar and Gürel, 2019; Revuelta-Bordoy et al., 2021).
In Period t+1 we will consider this variable to be the scientific production of the country analyzed in the global R&D&I system and, therefore, the variable that carries efficiency from one period to another. In the first Division in period t+1, the quantity of published research papers is indicated, while in the second Division in period t+1, the quality of these publications is measured:
Patents, Citations, and the h-index of researchers at the national level.
The divisions correspond to the R&D&I production system of each country and in each period, from t and t + 1… t + n. The production system corresponds, therefore, to each relationship between the set of inputs in period t and the production outputs in period t + 1 (in our study the link between the inputs and outputs will again be the number of R&D personnel by sector).
5. Results.
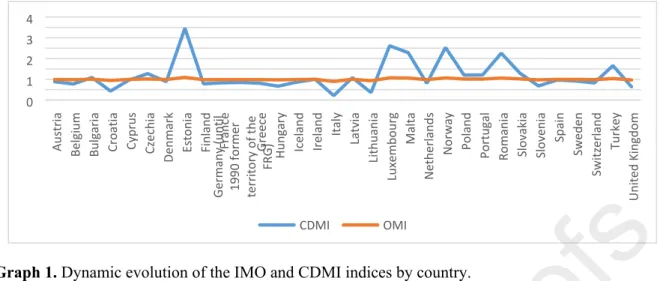
The results are presented, taking into account that the Malmquist productivity index is an index representing Total Factor Productivity (TFP) of growth of each country, reflecting: a) The
progression or regression in efficiency along with b) The progression or regression of the frontier technology.
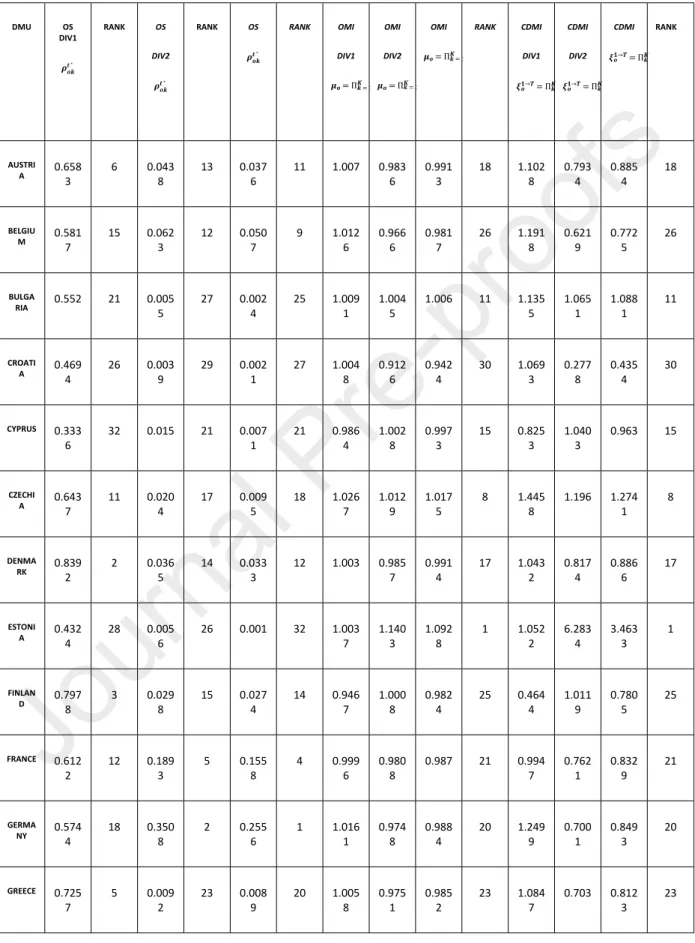
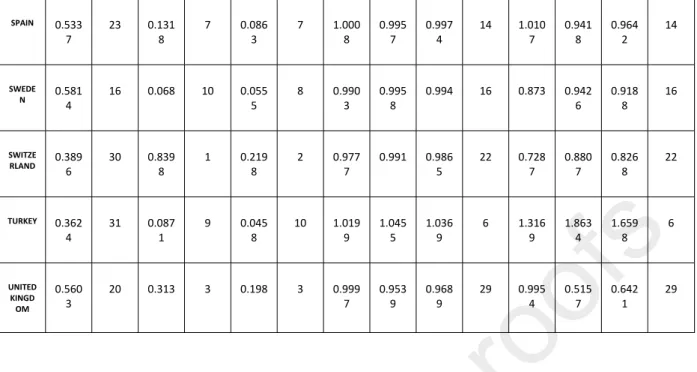
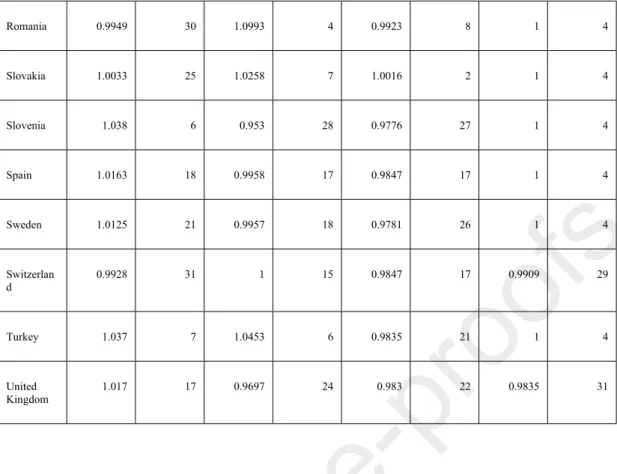
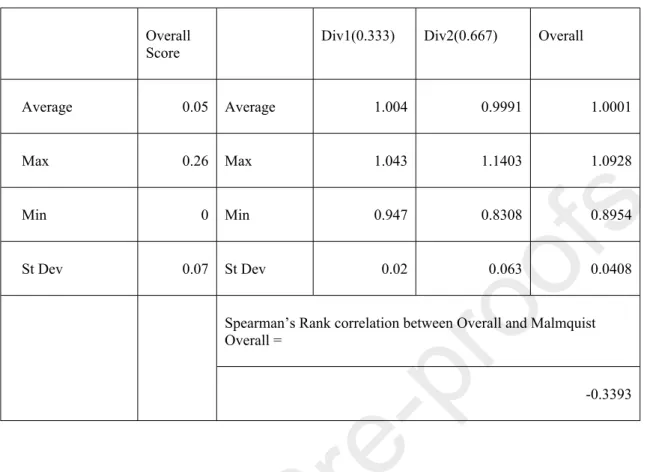
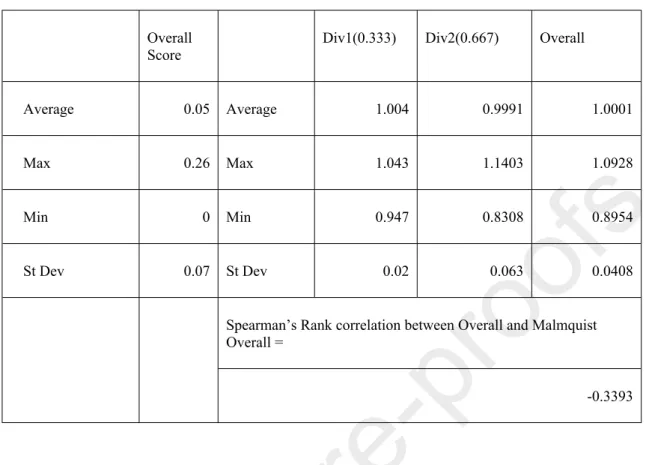
Table 3 shows the Overall Malmquist Index (OMI), equation (13) and, the Cumulative Divisional Malmquist Index (CDMI) (equation 14) in the complete period of fifteen years and for Divisions 1 and 2. The ranking by countries for each indicator is also reflected. The Overall Scores (OS) are also collected (equation 6).
Table 3. OS: Overall Scores (Divisions 1 and 2); OMI: Overall Malmquist Divisional Score (Divisions 1 and 2); CDMI: Cumulative Divisional Malmquist Index (Divisions 1 and 2)
DMU OS
DIV1 𝝆𝒕𝒐𝒌∗
RANK OS
DIV2 𝝆𝒕𝒐𝒌∗
RANK OS
𝝆𝒕𝒐𝒌∗
RANK OMI DIV1 𝝁𝒐=П𝑲𝒌=𝟏(𝝁𝒐𝒌)𝒘𝒌
OMI DIV2 𝝁𝒐=П𝑲𝒌=𝟏(𝝁𝒐𝒌)𝒘𝒌
OMI 𝝁𝒐=П𝑲𝒌=𝟏(𝝁𝒐𝒌)𝒘𝒌
RANK CDMI
DIV1
𝝃𝟏→𝑻𝒐 =П𝑲𝒌=𝟏(𝝃𝟏→𝑻𝒐𝒌 )𝒘𝒌 CDMI DIV2
𝝃𝟏→𝑻𝒐 =П𝑲𝒌=𝟏(𝝃𝟏→𝑻𝒐𝒌)𝒘𝒌 CDMI
𝝃𝟏→𝑻𝒐 =П𝑲𝒌=𝟏(𝝃𝟏→𝑻𝒐𝒌 )𝒘𝒌 RANK
AUSTRI
A 0.658
3 6 0.043
8 13 0.037
6 11 1.007 0.983
6 0.991
3 18 1.102
8 0.793
4 0.885
4 18
BELGIU
M 0.581
7 15 0.062
3 12 0.050
7 9 1.012
6 0.966
6 0.981
7 26 1.191
8 0.621
9 0.772
5 26
BULGA
RIA 0.552 21 0.005
5 27 0.002
4 25 1.009
1 1.004
5 1.006 11 1.135
5 1.065
1 1.088
1 11
CROATI
A 0.469
4 26 0.003
9 29 0.002
1 27 1.004
8 0.912
6 0.942
4 30 1.069
3 0.277
8 0.435
4 30
CYPRUS 0.333
6 32 0.015 21 0.007
1 21 0.986
4 1.002
8 0.997
3 15 0.825
3 1.040
3 0.963 15
CZECHI
A 0.643
7 11 0.020
4 17 0.009
5 18 1.026
7 1.012
9 1.017
5 8 1.445
8 1.196 1.274
1 8
DENMA RK 0.839
2 2 0.036
5 14 0.033
3 12 1.003 0.985
7 0.991
4 17 1.043
2 0.817
4 0.886
6 17
ESTONI
A 0.432
4 28 0.005
6 26 0.001 32 1.003
7 1.140
3 1.092
8 1 1.052
2 6.283
4 3.463
3 1
FINLAN
D 0.797
8 3 0.029
8 15 0.027
4 14 0.946
7 1.000
8 0.982
4 25 0.464
4 1.011
9 0.780
5 25
FRANCE 0.612
2 12 0.189
3 5 0.155
8 4 0.999
6 0.980
8 0.987 21 0.994
7 0.762
1 0.832
9 21
GERMA NY 0.574
4 18 0.350
8 2 0.255
6 1 1.016
1 0.974
8 0.988
4 20 1.249
9 0.700
1 0.849
3 20
GREECE 0.725
7 5 0.009
2 23 0.008
9 20 1.005
8 0.975
1 0.985
2 23 1.084
7 0.703 0.812
3 23