nutrients
ISSN 2072-6643 www.mdpi.com/journal/nutrients Article
Energy Intake, Profile, and Dietary Sources in the Spanish Population: Findings of the ANIBES Study
Emma Ruiz 1, José Manuel Ávila 1, Teresa Valero 1, Susana del Pozo 1, Paula Rodriguez 1, Javier Aranceta-Bartrina 2, Ángel Gil 3, Marcela González-Gross 4, Rosa M. Ortega 5, Lluis Serra-Majem 6 and Gregorio Varela-Moreiras 1,7,*
1 Spanish Nutrition Foundation (FEN), C/General Álvarez de Castro 20, 1ªpta, 28010 Madrid, Spain;
E-Mails: [email protected] (E.R.); [email protected] (J.M.Á.); [email protected] (T.V.);
[email protected] (S.P.); [email protected] (P.R.)
2 Department of Preventive Medicine and Public Health, University of Navarra, C/Irunlarrea 1, 31008 Pamplona, Spain; E-Mail: [email protected]
3 Department of Biochemistry and Molecular Biology II and Institute of Nutrition and Food Sciences, University of Granada, Campus de la Salud, Avda. del Conocimiento, 18100 Armilla, Granada, Spain; E-Mail: [email protected]
4 ImFINE Research Group, Department of Health and Human Performance, Technical University of Madrid, C/Martín Fierro 7, 28040 Madrid, Spain; E-Mail: [email protected]
5 Department of Nutrition, Faculty of Pharmacy, Complutense University of Madrid, Plaza Ramón y Cajal s/n, 28040 Madrid, Spain; E-Mail: [email protected]
6 Research Institute of Biomedical and Health Sciences, Universidad de Las Palmas de Gran Canaria, Facultad de Ciencias de la Salud, C/Doctor Pasteur s/n Trasera del Hospital, 35016 Las Palmas de Gran Canaria, Spain; E-Mail: [email protected]
7 Department of Pharmaceutical and Health Sciences, Faculty of Pharmacy, CEU San Pablo
University, Urb. Montepríncipe, Crta. Boadilla Km. 5.3, 28668 Boadilla del Monte, Madrid, Spain
* Author to whom correspondence should be addressed; E-Mail: [email protected] or [email protected]; Tel.: +34-913724726; Fax: +34-913510496.
Received: 29 April 2015 / Accepted: 28 May 2015 / Published: 12 June 2015
Abstract: Energy intake, and the foods and beverages contributing to that, are considered key to understanding the high obesity prevalence worldwide. The relative contributions of energy intake and expenditure to the obesity epidemic, however, remain poorly defined in Spain. The purpose of this study was to contribute to updating data of dietary energy intake and its main sources from food and beverages, according to gender and age. These data were derived from the ANIBES (“Anthropometry, Intake, and Energy Balance in Spain”) study,
a cross-sectional study of a nationally representative sample of the Spanish population (from 9–75 years old). A three-day dietary record, collected by means of a tablet device, was used to obtain information about food and beverage consumption and leftovers. The final sample comprised 2009 individuals (1,013 men, 996 women). The observed mean dietary energy intake was 7.6 ± 2.11 MJ/day (8.2 ± 2.22 MJ/day for men and 6.9 ± 1.79 MJ/day for women).
The highest intakes were observed among adolescents aged 13–17 years (8.4 MJ/day), followed by children 9–12 years (8.2 ± 1.80 MJ/day), adults aged 18–64 (7.6 ± 2.14 MJ/day) and older adults aged 65–75 years (6.8 ± 1.88 MJ/day). Cereals or grains (27.4%), meats and derivatives (15.2%), oils and fats (12.3%), and milk and dairy products (11.8%) contributed most to daily energy intake. Energy contributions from non-alcoholic beverages (3.9%), fish and shellfish (3.6%), sugars and sweets (3.3%) and alcoholic beverages (2.6%) were moderate to minor. Contributions to caloric profile were 16.8%E from proteins; 41.1%E from carbohydrates, including 1.4%E from fiber; 38.5%E from fats; and 1.9%E from alcohol intake. We can conclude that energy intake is decreasing in the Spanish population. A variety of food and beverage groups contribute to energy intake; however, it is necessary to reinforce efforts for better adherence to the traditional Mediterranean diet.
Keywords: energy intake; dietary energy sources; dietary surveys; food intake; ANIBES study
1. Introduction
In Europe, national and regional lifestyle practices, including dietary habits, have been changing over the past 50 years, becoming less distinct and moving towards a more homogeneous “Western diet” [1–3].
Spain has undergone dramatic social and socioeconomic change since the 1960s, including massive rural–urban migration, rapid urbanization processes during the 1980s, and generalized incorporation of females into the active workforce [4]. As a result of these transitions, the Spanish population has partially turned away from its traditional Mediterranean diet. The changes in diet, physical activity, and lifestyle seem to have had potentially negative consequences for both present and future populations. Overweight and/or obesity affect more than 50% of the adult population and nearly 30% of the population of infants and children [5]. It has been suggested that excessive energy intake is the primary cause of overweight and obesity. However, a sedentary lifestyle and lack of physical activity are thought to have at least as important a role as diet in the etiology of obesity [4,6].
The methodologies and procedures used in dietary surveys have been widely developed with the aim of evaluating the nutritional status of a population [7,8]. Problems associated with such studies are difficulties in terms of methodology, relative participation (high level of respondent commitment, biased sampling, and others), collecting intake data (truthfulness, forgetfulness, and others) and quantifying amounts consumed (portion size, ingredients in recipes, and others) [9]. Therefore, using new available methodologies (e.g., “real-time” recording of eating/drinking events) to avoid the usual bias is challenging, but urgently needed [10–12]. Moreover, there is consensus that determinants of diet, food composition, and consumption remain largely unknown, a fact that has become more true as related factors have become more complex, such as origin, production, availability, gastronomic trends, and
others [7,12]. In this regard, there is a need to improve tools such as food composition tables and databases that include detailed information on composition of the different food and beverage groups and subgroups representative of the current Spanish food basket, as well as to update energy requirements and serving sizes. We first stated this need in 2013, in the consensus document and conclusions on “Obesity and Sedentarism in the 21st Century: what can be done and what must be done?” [4] and, more recently, in the “Consensus Meeting on the Methodology of Dietary Surveys, Classification of Physical Activity and Healthy Lifestyles” [13].
Many valuable dietary surveys have been previously conducted in Spain [14–20], although to the best of our knowledge, no one has approached energy intake and its determinants using new, more accurate technologies. To fill this gap, the ANIBES (“Anthropometry, Intake, and Energy Balance in Spain”) study was specifically designed to focus on energy balance and its determinants in Spain. The main objective of the present study was to analyze energy intake in a nationally representative sample of the Spanish population, its distribution by sex and age groups, and to identify those food and beverages sources that contribute to energy intake.
2. Materials and Methods
The design, protocol, and methodology of the ANIBES study have been already described in detail elsewhere [21,22].
2.1. Sample
The ANIBES study was conducted using stratified multistage sampling. To guarantee better coverage and representativeness, the fieldwork was performed at 128 sampling points all across Spain. No pre-recruitment was considered so as to minimize the risk of bias in responses. The design of the ANIBES study aimed to define a sample size that is representative of all individuals living in Spain, aged 9 to 75 years, and living in municipalities of at least 2000 inhabitants. The initial potential sample consisted of 2634 individuals, and the final sample comprised 2009 individuals (1013 men, 50.4%;
996 women, 49.6%). In addition, for the youngest age groups (9–12, 13–17, and 18–24 years), a boost sample was included to have at least n = 200 per age group (error +/−6.9%). Therefore, the random sample plus booster comprised 2285 participants.
The sample quotas according to the following variables were: age groups (9–12, 13–17, 18–64, and 65–75 years); sex (men/women); geographical distribution (Northeast, Levant, Southwest, North-Central, Barcelona, Madrid, Balearic and Canary Islands); and locality size: 2000 to 30,000 inhabitants (rural population); 30,000 to 200,000 inhabitants (semi-urban population) and over 200,000 inhabitants (urban population). Additionally, other factors for sample adjustment were considered:
unemployment rate, percentage of foreigners (immigrant population), physical activity level, and education or economic level.
The fieldwork for the ANIBES study was conducted from mid-September 2013 to mid-November 2013, and two previous pilot studies were also performed. To equally represent all days of the week, subjects participated during two weekdays and one weekend day. The final protocol was approved by the Ethical Committee for Clinical Research of the Region of Madrid (Spain).
2.2. Food and Beverage Record
Study participants were provided with a tablet device (Samsung Galaxy Tab 2 7.0) and trained in how to record information by taking photos of all food and drinks consumed during the three days of the study, both at home and outside the home. Photos had to be taken before beginning to eat and drink, and again after finishing, so as to record the actual intake. Additionally, a brief description of meals, recipes, brands, and other data was recorded using the device. Participants who declared or demonstrated that they were unable to use the tablet device were offered other options, such as using a digital camera and paper record and/or conducting telephone interviews. A total 79% of the sample used a tablet, 12% a digital camera, and 9% opted for a telephone interview. In addition to details of what and how much was eaten, for each eating/drinking event participants recorded where they were, who they were eating with, and whether they were watching television and/or sitting at a table. After each survey day, participants recorded if their intake was representative for that day (or the reason why if it was not), and details of any dietary supplements taken. The survey also contained a series of questions about participants’
customary eating habits (e.g., the type of milk or fat spread usually consumed) to facilitate further coding. Food records were returned from the field in real time, to be coded by trained coders who were supervised by dieticians. An ad hoc central server software/database was developed for this purpose, to be able to work in parallel with the codification and verification processes. The software was developed to receive information from the field tablets every 2s, and the database was updated every 30 min. Food, beverages, energy and nutrient intakes were calculated from food consumption records using this software (VD-FEN 2.1), which was newly developed for the ANIBES study by the Spanish Nutrition Foundation and is based mainly on Spanish food composition tables [23], with several expansions and updates. Data obtained from food manufacturers and nutritional information provided on food labels were also included. A food photographic atlas was used to assist in assigning gram weights to portion sizes. Energy distribution objectives for the Spanish population were used to analyze the overall quality of the diet [24].
2.3. Statistical Analysis
Once all dietary intake information was transformed into energy and nutrient data, these data were processed using different statistical analysis tools and packages. The following statistics were calculated to qualify each variable in the analysis: average, standard deviation, and variance to measure dispersion in the values; minimum and maximum values, median, quartiles (as well as interquartile range), and deciles to describe the shape of the distribution. The Kolmogorov–Smirnoff test was used to test normality of the distribution. In addition, the intake data were grouped into 14 food groups, 45 subgroups and 754 ingredients for in-depth analysis.
Table 1. Total daily energy intake, by sex and age group, in the ANIBES survey of the Spanish population aged 9–75 years, expressed as kilocalories and megajoules.
ENERGY (kcal/day)
Total * Children 9–12 Years * Adolescents 13–17 Years * Adults 18–64 Years * Elderly 65–75 Years *
n Mean SD SEM n Mean SD SEM n Mean SD SEM n Mean SD SEM n Mean SD SEM
Total 2009 1810 504.4 11.25 213 1960 431.3 29.6 211 2018 508.1 35.0 1655 1816 512.0 12.6 206 1618 448.4 31.2 Men 1013 1957 531.0 16.68 126 2006 456.1 40.6 137 2124 514.6 44.0 798 1966 543.2 19.2 99 1771 484.7 48.7 Women 996 1660 426.7 13.52 87 1893 385.5 41.3 74 1823 435.7 50.6 857 1675 436.9 14.9 107 1476 359.9 34.8 ENERGY
(MJ/day)
Tota l * Children 9–12 Years * Adolescents 13–17 Years * Adults 18–64 Years * Elderly 65–75 Years *
n Mean SD SEM n Mean SD SEM n Mean SD SEM n Mean SD SEM n Mean SD SEM
Total 2009 7.6 2.11 0.05 213 8.2 1.80 0.12 211 8.4 2.13 0.15 1655 7.6 2.14 0.05 206 6.8 1.88 0.13
Men 1013 8.2 2.22 0.07 126 8.4 1.91 0.17 137 8.9 2.15 0.18 798 8.2 2.27 0.08 99 7.4 2.03 0.20
Women 996 6.9 1.79 0.06 87 7.9 1.61 0.17 74 7.6 1.82 0.21 857 7.0 1.83 0.06 107 6.2 1.51 0.15
* Denotes statistical difference (p ≤ 0.05) by sex; SD: mean standard deviation; SEM: mean standard error.
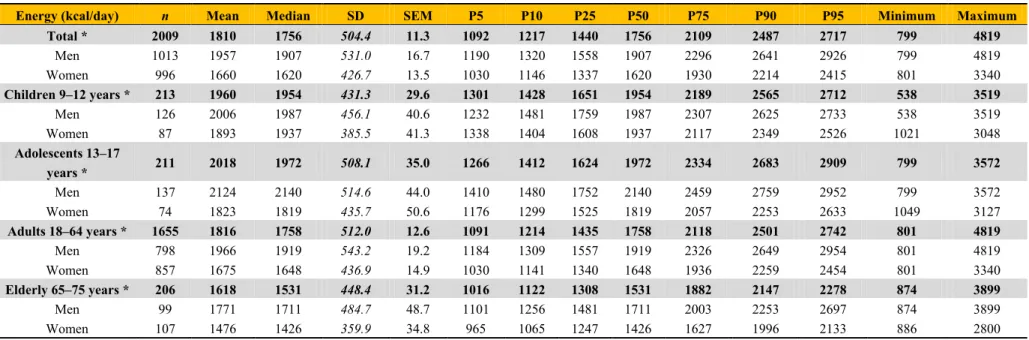
Table 2. Energy distribution (kcal/day; MJ/day), by age group and sex, in the ANIBES survey of the Spanish population aged 9–75 years.
Energy (kcal/day) n Mean Median SD SEM P5 P10 P25 P50 P75 P90 P95 Minimum Maximum
Total * 2009 1810 1756 504.4 11.3 1092 1217 1440 1756 2109 2487 2717 799 4819
Men 1013 1957 1907 531.0 16.7 1190 1320 1558 1907 2296 2641 2926 799 4819
Women 996 1660 1620 426.7 13.5 1030 1146 1337 1620 1930 2214 2415 801 3340
Children 9–12 years * 213 1960 1954 431.3 29.6 1301 1428 1651 1954 2189 2565 2712 538 3519
Men 126 2006 1987 456.1 40.6 1232 1481 1759 1987 2307 2625 2733 538 3519
Women 87 1893 1937 385.5 41.3 1338 1404 1608 1937 2117 2349 2526 1021 3048
Adolescents 13–17
years * 211 2018 1972 508.1 35.0 1266 1412 1624 1972 2334 2683 2909 799 3572
Men 137 2124 2140 514.6 44.0 1410 1480 1752 2140 2459 2759 2952 799 3572
Women 74 1823 1819 435.7 50.6 1176 1299 1525 1819 2057 2253 2633 1049 3127
Adults 18–64 years * 1655 1816 1758 512.0 12.6 1091 1214 1435 1758 2118 2501 2742 801 4819
Men 798 1966 1919 543.2 19.2 1184 1309 1557 1919 2326 2649 2954 801 4819
Women 857 1675 1648 436.9 14.9 1030 1141 1340 1648 1936 2259 2454 801 3340
Elderly 65–75 years * 206 1618 1531 448.4 31.2 1016 1122 1308 1531 1882 2147 2278 874 3899
Men 99 1771 1711 484.7 48.7 1101 1256 1481 1711 2003 2253 2697 874 3899
Women 107 1476 1426 359.9 34.8 965 1065 1247 1426 1627 1996 2133 886 2800
* Denotes statistical difference (p ≤ 0.05) by sex; SD: mean standard deviation; SEM: mean standard error.
Table 3. Energy and lipid profile (%) in the ANIBES survey of the Spanish population aged 9–75 years, by sex and age group.
Total Children Adolescents Adults Elderly
9–75 Years 9–12 Years 13–17 Years 18–64 Years 65–75 Years
Total Men Women Total Men Women Total Men Women Total Men Women Total Men Women
n 2009 1013 996 213 126 87 211 137 74 1655 798 857 206 99 107
Mean energy intake
(kcal/day) 1810 1957 1660 1960 2006 1893 2018 2124 1823 1816 1966 1675 1618 1771 1476
(%) Proteins 16.8 * 16.7 17.0 16.0 16.3 15.6 16.2 16.4 15.9 16.9 16.8 17.0 17.1 16.9 17.3
(%) Carbohydrates 41.1 41.0 41.2 43.8 43.4 44.4 44.4 43.9 45.2 40.7 40.6 40.9 40.7 * 39.6 41.7
(%) Sugars 17.0 * 16.3 17.8 18.8 18.8 18.8 17.7 * 16.9 19.2 16.7 * 16.0 17.3 18.3 * 16.7 19.8
(%) Lipids 38.5 38.2 38.7 38.9 39.0 38.6 38.1 38.4 37.5 38.6 * 38.2 39.0 37.2 37.0 37.4
(%) SFA 11.7 11.6 11.7 13.1 13.2 12.9 12.5 12.6 12.2 11.7 11.5 11.8 10.6 10.5 10.7
(%) MUFA 16.8 16.6 16.9 16.0 16.1 15.8 15.7 15.9 15.4 16.8 * 16.6 17.0 17.1 17.0 17.2
(%) PUFA 6.63 6.6 6.6 6.4 6.3 6.5 6.4 6.4 6.5 6.7 6.6 6.7 6.2 6.2 6.1
(%) n-6 5.40 5.43 5.37 5.44 5.36 5.55 5.53 5.53 5.54 5.45 5.48 5.43 4.90 4.87 4.92
(%) n-3 0.63 0.72 0.55 0.44 0.43 0.45 0.45 0.45 0.46 0.66 0.77 0.55 0.62 0.66 0.57
(%) Alcohol 1.9 * 2.5 1.4 0.0 0.0 0.0 0.0 0.0 0.1 2.1 * 2.8 1.5 2.7 * 4.1 1.4
(%) Fiber 1.4 * 1.4 1.5 1.2 * 1.2 1.3 1.2 1.2 1.2 1.4 * 1.4 1.5 1.8 1.8 1.9
* Denotes statistical difference (P ≤ 0.05) by sex; SD: mean standard deviation; SEM: mean standard error.
3. Results
3.1. Total Energy Intake, Profile, and Distribution
Mean daily energy intakes for total energy for the entire Spanish population aged 9–75 years are shown in Table 1. Males had statistically higher intakes than females (p < 0.05) for the whole sample.
By age group, adolescents and elderly males had higher intakes than females (p < 0.05).
Table 2 shows the energy intake distribution (median, percentiles, and maximum/minimum) according to age group and sex. In terms of the contribution of macronutrients to dietary energy (Table 3), carbohydrates contributed the highest proportion (41.1%), followed by fats (38.5%) and proteins (16.8%); other minor energy sources were alcohol (1.9%) and fiber (1.4%). Women had higher sugar and fat intakes (p < 0.05) and men higher alcohol intakes (p < 0.05). Concerning the energy provided by fatty acids, monounsaturated fatty acids (MUFA) contributed 16.8%, saturated fatty acids (SFA) 11.7%, and polyunsaturated fatty acids (PUFA) 6.6% (5.40% n-6 class; 0.63% n-3). No gender differences were observed for the lipid profile. However, there were differences according to age group: SFA contribution to energy intake was highest for children (13.1%) and lowest for the oldest age group (10.6%). The opposite was seen for MUFA, with the highest contribution for elderly adults. There were no differences for PUFA between age groups (Table 3).
3.2. Contribution of Food and Beverage Groups to Total Intake
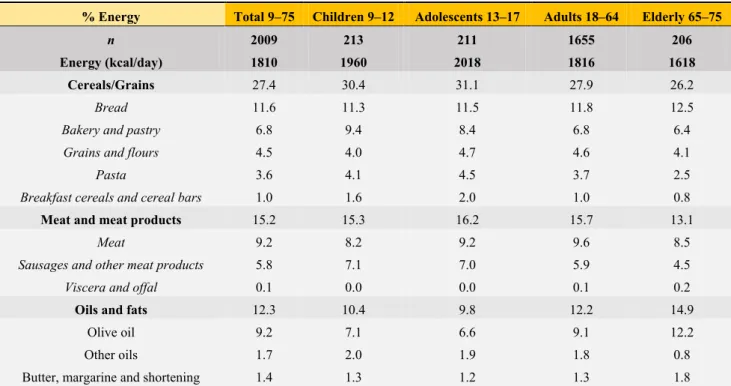
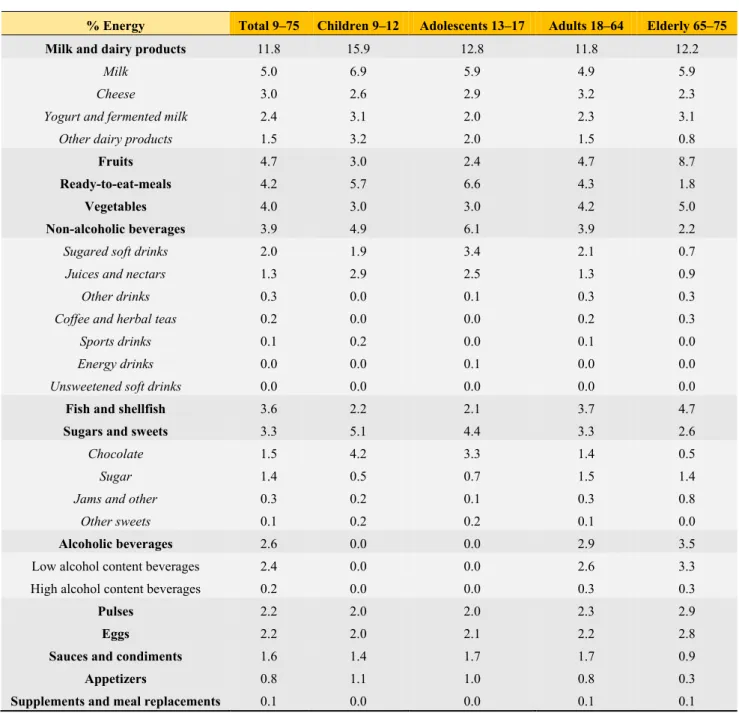
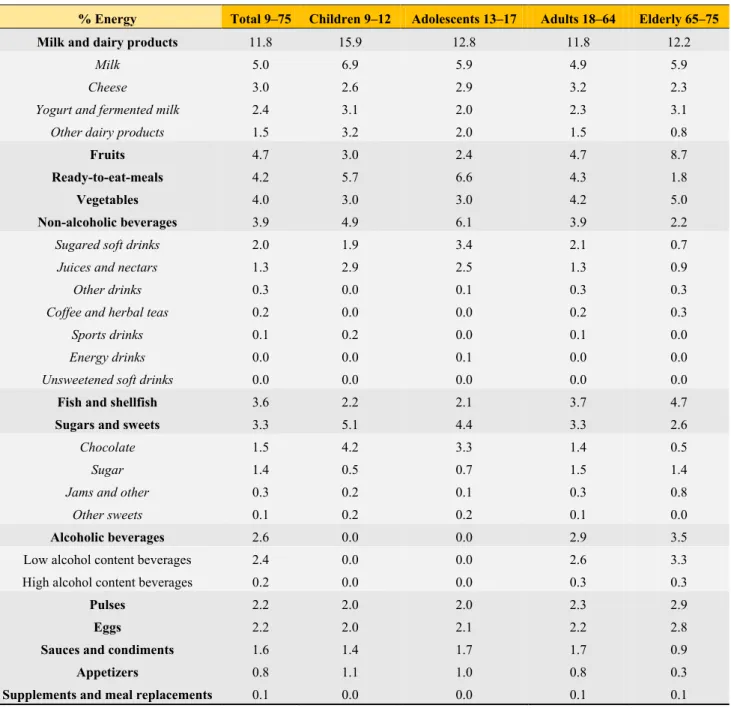
The contribution (%) of food and beverage categories to the daily energy intake is shown in Table 4, ranked from high to low, and categorized by age group.
Table 4. Dietary sources of energy (%) from food groups/subgroups in the ANIBES survey of the Spanish population aged 9–75 years.
% Energy Total 9–75 Children 9–12 Adolescents 13–17 Adults 18–64 Elderly 65–75
n 2009 213 211 1655 206
Energy (kcal/day) 1810 1960 2018 1816 1618
Cereals/Grains 27.4 30.4 31.1 27.9 26.2
Bread 11.6 11.3 11.5 11.8 12.5
Bakery and pastry 6.8 9.4 8.4 6.8 6.4
Grains and flours 4.5 4.0 4.7 4.6 4.1
Pasta 3.6 4.1 4.5 3.7 2.5
Breakfast cereals and cereal bars 1.0 1.6 2.0 1.0 0.8
Meat and meat products 15.2 15.3 16.2 15.7 13.1
Meat 9.2 8.2 9.2 9.6 8.5
Sausages and other meat products 5.8 7.1 7.0 5.9 4.5
Viscera and offal 0.1 0.0 0.0 0.1 0.2
Oils and fats 12.3 10.4 9.8 12.2 14.9
Olive oil 9.2 7.1 6.6 9.1 12.2
Other oils 1.7 2.0 1.9 1.8 0.8
Butter, margarine and shortening 1.4 1.3 1.2 1.3 1.8
Table 4. Cont.
% Energy Total 9–75 Children 9–12 Adolescents 13–17 Adults 18–64 Elderly 65–75
Milk and dairy products 11.8 15.9 12.8 11.8 12.2
Milk 5.0 6.9 5.9 4.9 5.9
Cheese 3.0 2.6 2.9 3.2 2.3
Yogurt and fermented milk 2.4 3.1 2.0 2.3 3.1
Other dairy products 1.5 3.2 2.0 1.5 0.8
Fruits 4.7 3.0 2.4 4.7 8.7
Ready-to-eat-meals 4.2 5.7 6.6 4.3 1.8
Vegetables 4.0 3.0 3.0 4.2 5.0
Non-alcoholic beverages 3.9 4.9 6.1 3.9 2.2
Sugared soft drinks 2.0 1.9 3.4 2.1 0.7
Juices and nectars 1.3 2.9 2.5 1.3 0.9
Other drinks 0.3 0.0 0.1 0.3 0.3
Coffee and herbal teas 0.2 0.0 0.0 0.2 0.3
Sports drinks 0.1 0.2 0.0 0.1 0.0
Energy drinks 0.0 0.0 0.1 0.0 0.0
Unsweetened soft drinks 0.0 0.0 0.0 0.0 0.0
Fish and shellfish 3.6 2.2 2.1 3.7 4.7
Sugars and sweets 3.3 5.1 4.4 3.3 2.6
Chocolate 1.5 4.2 3.3 1.4 0.5
Sugar 1.4 0.5 0.7 1.5 1.4
Jams and other 0.3 0.2 0.1 0.3 0.8
Other sweets 0.1 0.2 0.2 0.1 0.0
Alcoholic beverages 2.6 0.0 0.0 2.9 3.5
Low alcohol content beverages 2.4 0.0 0.0 2.6 3.3
High alcohol content beverages 0.2 0.0 0.0 0.3 0.3
Pulses 2.2 2.0 2.0 2.3 2.9
Eggs 2.2 2.0 2.1 2.2 2.8
Sauces and condiments 1.6 1.4 1.7 1.7 0.9
Appetizers 0.8 1.1 1.0 0.8 0.3
Supplements and meal replacements 0.1 0.0 0.0 0.1 0.1
A detailed analysis of the food and beverage groups and subgroups, by sex, is shown in Tables 5–9.
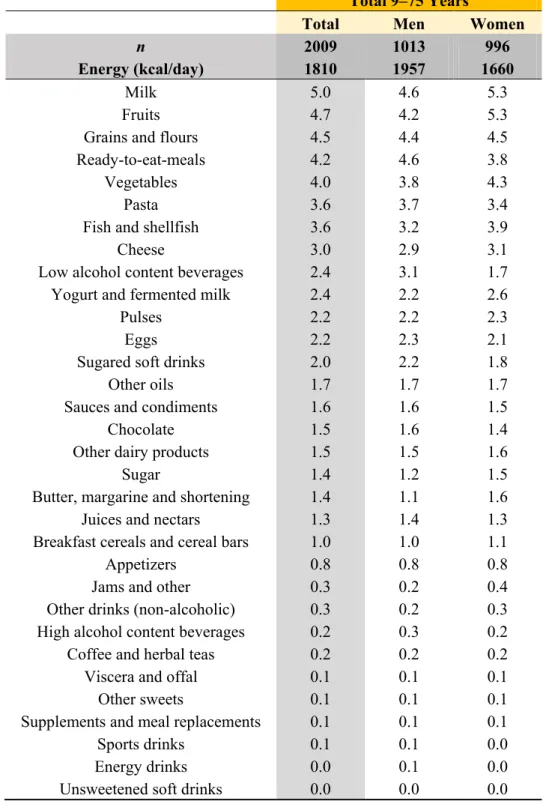
Table 5. Dietary sources of energy (%) from food subgroups in the ANIBES survey of the Spanish population aged 9–75 years, by sex.
Total 9–75 Years
Total Men Women
n 2009 1013 996
Energy (kcal/day) 1810 1957 1660
Bread 11.6 12.2 11.0
Meat 9.2 9.7 8.8
Olive oil 9.2 8.7 9.8
Bakery and pastry 6.8 6.5 7.1
Sausages and other meat products 5.8 6.3 5.2
Table 5. Cont.
Total 9–75 Years
Total Men Women
n 2009 1013 996
Energy (kcal/day) 1810 1957 1660
Milk 5.0 4.6 5.3
Fruits 4.7 4.2 5.3
Grains and flours 4.5 4.4 4.5
Ready-to-eat-meals 4.2 4.6 3.8
Vegetables 4.0 3.8 4.3
Pasta 3.6 3.7 3.4
Fish and shellfish 3.6 3.2 3.9
Cheese 3.0 2.9 3.1
Low alcohol content beverages 2.4 3.1 1.7
Yogurt and fermented milk 2.4 2.2 2.6
Pulses 2.2 2.2 2.3
Eggs 2.2 2.3 2.1
Sugared soft drinks 2.0 2.2 1.8
Other oils 1.7 1.7 1.7
Sauces and condiments 1.6 1.6 1.5
Chocolate 1.5 1.6 1.4
Other dairy products 1.5 1.5 1.6
Sugar 1.4 1.2 1.5
Butter, margarine and shortening 1.4 1.1 1.6
Juices and nectars 1.3 1.4 1.3
Breakfast cereals and cereal bars 1.0 1.0 1.1
Appetizers 0.8 0.8 0.8
Jams and other 0.3 0.2 0.4
Other drinks (non-alcoholic) 0.3 0.2 0.3
High alcohol content beverages 0.2 0.3 0.2
Coffee and herbal teas 0.2 0.2 0.2
Viscera and offal 0.1 0.1 0.1
Other sweets 0.1 0.1 0.1
Supplements and meal replacements 0.1 0.1 0.1
Sports drinks 0.1 0.1 0.0
Energy drinks 0.0 0.1 0.0
Unsweetened soft drinks 0.0 0.0 0.0
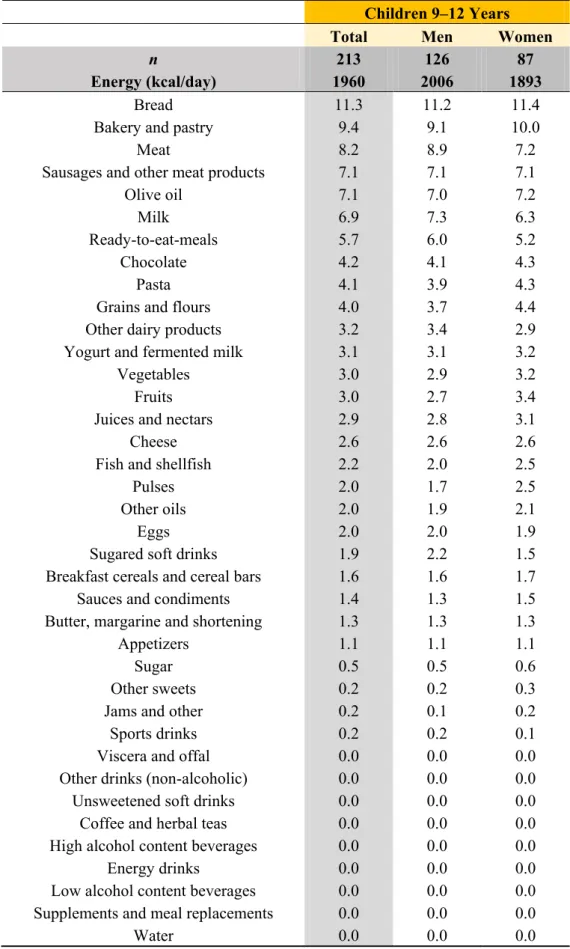
Table 6. Dietary sources of energy (%) from food subgroups in children from the ANIBES survey of the Spanish population.
Children 9–12 Years
Total Men Women
n 213 126 87
Energy (kcal/day) 1960 2006 1893
Bread 11.3 11.2 11.4
Bakery and pastry 9.4 9.1 10.0
Meat 8.2 8.9 7.2
Sausages and other meat products 7.1 7.1 7.1
Olive oil 7.1 7.0 7.2
Milk 6.9 7.3 6.3
Ready-to-eat-meals 5.7 6.0 5.2
Chocolate 4.2 4.1 4.3
Pasta 4.1 3.9 4.3
Grains and flours 4.0 3.7 4.4
Other dairy products 3.2 3.4 2.9
Yogurt and fermented milk 3.1 3.1 3.2
Vegetables 3.0 2.9 3.2
Fruits 3.0 2.7 3.4
Juices and nectars 2.9 2.8 3.1
Cheese 2.6 2.6 2.6
Fish and shellfish 2.2 2.0 2.5
Pulses 2.0 1.7 2.5
Other oils 2.0 1.9 2.1
Eggs 2.0 2.0 1.9
Sugared soft drinks 1.9 2.2 1.5
Breakfast cereals and cereal bars 1.6 1.6 1.7
Sauces and condiments 1.4 1.3 1.5
Butter, margarine and shortening 1.3 1.3 1.3
Appetizers 1.1 1.1 1.1
Sugar 0.5 0.5 0.6
Other sweets 0.2 0.2 0.3
Jams and other 0.2 0.1 0.2
Sports drinks 0.2 0.2 0.1
Viscera and offal 0.0 0.0 0.0
Other drinks (non-alcoholic) 0.0 0.0 0.0
Unsweetened soft drinks 0.0 0.0 0.0
Coffee and herbal teas 0.0 0.0 0.0
High alcohol content beverages 0.0 0.0 0.0
Energy drinks 0.0 0.0 0.0
Low alcohol content beverages 0.0 0.0 0.0
Supplements and meal replacements 0.0 0.0 0.0
Water 0.0 0.0 0.0
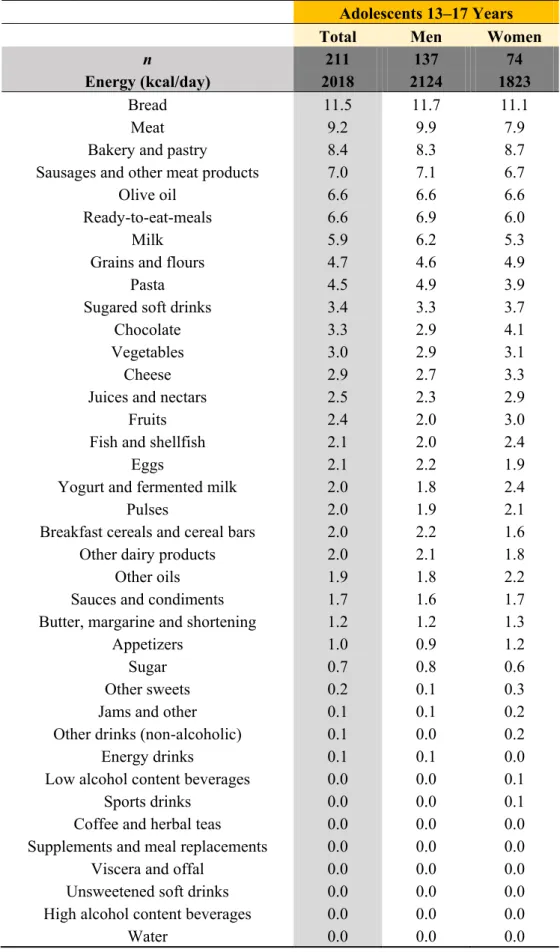
Table 7. Dietary sources of energy (%) from food subgroups in adolescents from the ANIBES survey of the Spanish population.
Adolescents 13–17 Years
Total Men Women
n 211 137 74
Energy (kcal/day) 2018 2124 1823
Bread 11.5 11.7 11.1
Meat 9.2 9.9 7.9
Bakery and pastry 8.4 8.3 8.7
Sausages and other meat products 7.0 7.1 6.7
Olive oil 6.6 6.6 6.6
Ready-to-eat-meals 6.6 6.9 6.0
Milk 5.9 6.2 5.3
Grains and flours 4.7 4.6 4.9
Pasta 4.5 4.9 3.9
Sugared soft drinks 3.4 3.3 3.7
Chocolate 3.3 2.9 4.1
Vegetables 3.0 2.9 3.1
Cheese 2.9 2.7 3.3
Juices and nectars 2.5 2.3 2.9
Fruits 2.4 2.0 3.0
Fish and shellfish 2.1 2.0 2.4
Eggs 2.1 2.2 1.9
Yogurt and fermented milk 2.0 1.8 2.4
Pulses 2.0 1.9 2.1
Breakfast cereals and cereal bars 2.0 2.2 1.6
Other dairy products 2.0 2.1 1.8
Other oils 1.9 1.8 2.2
Sauces and condiments 1.7 1.6 1.7
Butter, margarine and shortening 1.2 1.2 1.3
Appetizers 1.0 0.9 1.2
Sugar 0.7 0.8 0.6
Other sweets 0.2 0.1 0.3
Jams and other 0.1 0.1 0.2
Other drinks (non-alcoholic) 0.1 0.0 0.2
Energy drinks 0.1 0.1 0.0
Low alcohol content beverages 0.0 0.0 0.1
Sports drinks 0.0 0.0 0.1
Coffee and herbal teas 0.0 0.0 0.0
Supplements and meal replacements 0.0 0.0 0.0
Viscera and offal 0.0 0.0 0.0
Unsweetened soft drinks 0.0 0.0 0.0
High alcohol content beverages 0.0 0.0 0.0
Water 0.0 0.0 0.0
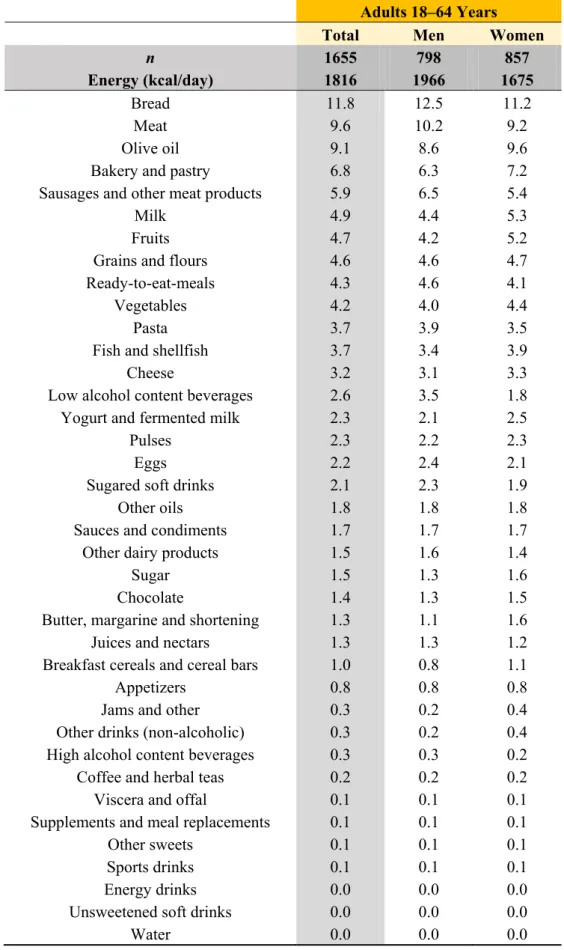
Table 8. Dietary sources of energy (%) from food subgroups in adults from the ANIBES survey of the Spanish population.
Adults 18–64 Years
Total Men Women
n 1655 798 857
Energy (kcal/day) 1816 1966 1675
Bread 11.8 12.5 11.2
Meat 9.6 10.2 9.2
Olive oil 9.1 8.6 9.6
Bakery and pastry 6.8 6.3 7.2
Sausages and other meat products 5.9 6.5 5.4
Milk 4.9 4.4 5.3
Fruits 4.7 4.2 5.2
Grains and flours 4.6 4.6 4.7
Ready-to-eat-meals 4.3 4.6 4.1
Vegetables 4.2 4.0 4.4
Pasta 3.7 3.9 3.5
Fish and shellfish 3.7 3.4 3.9
Cheese 3.2 3.1 3.3
Low alcohol content beverages 2.6 3.5 1.8
Yogurt and fermented milk 2.3 2.1 2.5
Pulses 2.3 2.2 2.3
Eggs 2.2 2.4 2.1
Sugared soft drinks 2.1 2.3 1.9
Other oils 1.8 1.8 1.8
Sauces and condiments 1.7 1.7 1.7
Other dairy products 1.5 1.6 1.4
Sugar 1.5 1.3 1.6
Chocolate 1.4 1.3 1.5
Butter, margarine and shortening 1.3 1.1 1.6
Juices and nectars 1.3 1.3 1.2
Breakfast cereals and cereal bars 1.0 0.8 1.1
Appetizers 0.8 0.8 0.8
Jams and other 0.3 0.2 0.4
Other drinks (non-alcoholic) 0.3 0.2 0.4
High alcohol content beverages 0.3 0.3 0.2
Coffee and herbal teas 0.2 0.2 0.2
Viscera and offal 0.1 0.1 0.1
Supplements and meal replacements 0.1 0.1 0.1
Other sweets 0.1 0.1 0.1
Sports drinks 0.1 0.1 0.1
Energy drinks 0.0 0.0 0.0
Unsweetened soft drinks 0.0 0.0 0.0
Water 0.0 0.0 0.0
Table 9. Dietary sources of energy (%) from food subgroups in elderly adults from the ANIBES survey of the Spanish population.
Elderly 65–75 Years
Total Men Women
n 206 99 107
Energy (kcal/day) 1618 1771 1476
Bread 12.5 12.6 12.3
Olive oil 12.2 12.0 12.5
Fruits 8.7 8.1 9.4
Meat 8.5 8.7 8.3
Bakery and pastry 6.4 6.1 6.8
Milk 5.9 5.3 6.4
Vegetables 5.0 4.7 5.2
Fish and shellfish 4.7 4.3 5.0
Sausages and other meat products 4.5 5.1 3.9
Grains and flours 4.1 4.3 3.9
Low alcohol content beverages 3.3 4.8 1.9
Yogurt and fermented milk 3.1 2.5 3.7
Pulses 2.9 3.2 2.5
Eggs 2.8 2.7 2.8
Pasta 2.5 2.1 2.8
Cheese 2.3 1.9 2.6
Butter, margarine and shortening 1.8 1.5 2.2
Ready-to-eat-meals 1.8 2.1 1.6
Sugar 1.4 1.3 1.4
Juices and nectars 0.9 0.9 0.9
Sauces and condiments 0.9 0.7 1.1
Other dairy products 0.8 0.7 1.0
Other oils 0.8 0.8 0.8
Breakfast cereals and cereal bars 0.8 0.7 0.9
Jams and other 0.8 0.6 0.9
Sugared soft drinks 0.7 0.6 0.7
Chocolate 0.5 0.6 0.4
Appetizers 0.3 0.3 0.3
Other drinks (non-alcoholic) 0.3 0.4 0.3
Coffee and herbal teas 0.3 0.2 0.4
High alcohol content beverages 0.3 0.5 0.0
Viscera and offal 0.2 0.2 0.1
Supplements and meal replacements 0.1 0.2 0.0
Sports drinks 0.0 0.0 0.0
Other sweets 0.0 0.0 0.0
Unsweetened soft drinks 0.0 0.0 0.0
Energy drinks 0.0 0.0 0.0
Water 0.0 0.0 0.0
Cereals and cereal products were the main source of energy for the entire sample and all age groups.
Within this food group, bread was the major contributor in all age groups (11.6%); this was followed by baked goods and pastries (6.8%), which ranked highest for children and adolescents and much lower for elderly adults. Other minor contributors were grains and flours (4.5%), pasta (3.6%), and breakfast cereals and cereal bars (1.0%). Meat and meat products were the second largest contributor (15.2%), with the lowest ranking for the elderly population (13.1%) and the highest for adolescents (16.2%).
Within this category, meat contributed 9.2% of total energy, whereas the sausage and meat derivative subgroup supplied 5.8%. Oils and fats (12.3%) were the third major contributor; these came mainly from olive oil (9.2%) with only 1.7% for other oils and 1.4% for butter, margarine and shortenings. Milk and dairy products contributed 11.8% of total energy intake, and this was higher in children (15.9%) than in adults (11.8%). The different types of milk represented about half the energy intake within this group, followed by cheeses (3.0%), and then closely by yogurt and fermented milk (2.4%). Interestingly, these four food and beverage groups contributed roughly two-thirds (66.7%) of the total energy intake. Much lower contributors included fruits (4.7%), except for in the elderly population (8.7%); ready-to eat meals (4.2%), ranking from 6.6% in adolescents to 1.8% in elderly adults; vegetables (4.0%: 5.0% in elderly adults and 3.0% in children); and non-alcoholic beverages (3.9%: 4.9% in children, 6.1% in adolescents, 3.9% in adults, and 2.2% in elderly adults). Within this category, sugared soft drinks contributed 2% of total daily energy intake (1.9% in children, 3.4% in adolescents, 2.1% in adults, and 0.7% in elderly adults), followed by juices and nectars (1.3%). Fish and shellfish contributed 3.6% of total daily energy intake (2.2%–4.7%, increasing with age group). Sugars and sweets contributed 3.3% for the entire population, and ranked from 4.2% in children to 2.6% in the elderly population. Alcoholic beverages contributed 2.6%, being highest in elderly adults (3.5%). Finally, pulses (2.2%) and eggs (2.2%) had minor contributions to energy intake.
4. Discussion
4.1. Energy Intake and Profile
There is consensus in the literature that society as a whole is currently in a nutritional transition and there is a need for accurate and updated dietary intake data. Total mean daily energy intake in the ANIBES study is lower than in other surveys like the ENIDE study (“Encuesta Nacional de Ingesta Dietética Española”) [20], a nationwide survey carried out in 2011 with people aged 18–64 where leftovers were not considered as in the ANIBES study. The Food Consumption Survey (FCS), conducted in Spain since 1987, revealed that mean energy consumption for the Spanish adult population in 2010 was 2609 kcal/person/day, which was clearly lower than in 1964 (3008 kcal/person/day) [19,25,26]. However, it should be considered that overestimation may exist in this survey since discards were not recorded.
Therefore, our present findings confirm a decreasing trend in energy intake, which has been observed in Spain from different surveys [19,26–28] and is consistent with a similar pattern that is occurring in most European countries [29–32]. When compared with EFSA (European Food Safety Authority 2013) dietary reference values for energy [33] and current (2013) Spanish dietary recommendations for energy [23], intake in the ANIBES study population was only adequate for boys and girls, whereas it was below the average requirement (AR) considering a physical activity level of 1.6 (moderate), for
adolescent males (80% of the AR), adult males (78.0% of the AR), and elderly males (77.9% of the AR).
In adolescent men, P75 and higher was necessary to guarantee the established AR, and similar was observed for adolescent women. For females, these were 82.6% of the established AR for adolescent women, 82.0% in the case of adult women, and 80.5% for elderly women. It should be considered of special concern that P50 of elderly women in the ANIBES study consumed only 1,426 kcal/day, which may compromise an adequate nutrient-dense diet during the ageing process. In addition, the nutritional status of elderly men (65 to 75 years) may be compromised since only those above P75 reached the adequate AR for energy intake. When national current (2013) dietary recommendations for energy [23]
were used for comparison, the results were even more marked in terms of potential insufficient energy intake, with boys only able to cover 81.9% of the recommended dietary intake (RDI); this was 82.3% in the case of girls. Of special note are adolescent men (75.9% of RDI) and women (76.0% of RDI), and particularly adults (69.0% of RDI for men; 79.5% for women) and the elderly population (73.8% of RDI for men; 78.7% for women). It should be considered, however, that these RDI may be insufficiently up to date with respect to stratification of current physical activity levels for the Spanish population.
One of the main dietary quality indices is the energy/caloric profile. In the ANIBES study, protein intake was 16.8%E, well above the upper recommended limit (<15%E). The ENIDE study showed a similar percentage of energy from protein, 18%E, and trends in the Spain FCS are similar [19,20].
Protein intake as a percent of total energy intake ranged from 11.1%E to 17.6%E in the different European countries included in the European Nutrition Health Report (2009) [14]. Fat intake for the total ANIBES study population was 38.5%E, being significantly higher for women. However, there were no age differences in terms of fat contribution to energy, which ranged from 37.2%E in elderly adults to 38.9%E in children. Fat is an important dense source of energy and facilitates the absorption of fat- soluble dietary components, such as vitamins. Fats and oils are also important sources of essential fatty acids. However, high-fat diets may decrease insulin sensitivity and are positively associated with increased cardiovascular risk [34–36], although a precise dose-response relationship has not been defined. There is evidence that moderate fat intake (<35%E) is accompanied by reduced energy intake and therefore, moderate weight reduction and/or prevention of weight gain may be better achieved.
However, EFSA has concluded that there are insufficient data to define a lower threshold intake (LTI) or tolerable upper intake level (UL) for total fat [37]. Presently, at a European level, a lower boundary for the reference intake range of 20%E and an upper boundary of 35%E have been proposed [37]. A similar range has been recently proposed by WHO and FAO [36].
The SFA intake in the ANIBES study was above the recommendations for all age groups and both genders. SFA are synthetized by the body and are not required in the diet; therefore, no dietary reference intakes have been set. However, there is a positive dose-dependent relationship between intake of a mixture of saturated fatty acids and blood low density lipoprotein (LDL) cholesterol concentrations, when compared with carbohydrates [36]. There is also evidence from dietary intervention studies that decreasing the intake of products rich in saturated fatty acids by replacing them with products rich in n-6 PUFA (without changing total fat intake) decreased the number of cardiovascular events [38–40].
Because the relationship between increased saturated fatty acid intake and increased LDL cholesterol concentrations is continuous, no threshold of saturated fatty acid intake can be defined below which there is no adverse effect; therefore, no UL can be set, as EFSA has recently established [37]. Even so, the WHO/FAO have recommended that a maximum intake of 10%E for saturated fatty acids should be
set [36]. This limit for SFA has also been proposed very recently in the FESNAD Consensus Document on Dietary Fats and Oils for the Adult Spanish Population [41]. Interestingly, the American Heart Association (AHA) has recommended a maximum intake of <7%E for SFA to reduce cardiovascular risk [42]. More recently (2013), the dietary guidelines launched jointly by the AHA and American College of Cardiology proposed a lower amount of energy from SFA (5%–6%E) [43], although there is insufficient scientific evidence proving an association between SFA and cardiovascular and/or diabetes risk.
It is agreed that one positive aspect of the dietary patterns in Spain that should be maintained is the relatively high proportion of MUFA, mostly owing to the common use of olive oil in the Spanish diet [44,45]. In our ANIBES population, MUFA contributed 16.8%E; this was slightly higher in the elderly group and lower in children and adolescents. MUFA intake from energy across Europe ranged from 22% in Greece to 11% in non-olive-oil-consuming countries [37]. The 2011 goals of the Spanish Society of Community Nutrition (SENC) [24] recommended that MUFA should contribute >20%E of total energy. In 2010, an EFSA panel [37] proposed not setting any dietary reference value for MUFA based on the following: MUFA are synthesized by the body, have no known specific role in preventing or promoting diet-related diseases, and are therefore not indispensable constituents of the diet. This assumption by EFSA, however, is untenable as MUFA are among the most abundant fatty acids in most tissue cells and contribute to maintaining membrane fluidity and enzymatic activities. Additionally, there is convincing evidence that MUFA lower both total and LDL plasma cholesterol levels, and replacement of PUFA with MUFA decreases the risk of cardiovascular disease (CVD). Indeed, the FAO/WHO have recommended a MUFA intake of about 16%–19% (obtained by the difference in intake between SFA and PUFA) [36]. Moreover, in the PREDIMED intervention study [46], intake of virgin olive oil (high in MUFA content) was associated with a lower risk of CVD events and total mortality. Interestingly, participants who followed the olive oil-rich Mediterranean diet had a mean MUFA intake of 22%E.
Therefore, from the PREDIMED study findings, a MUFA intake target of 20%E–25%E (with virgin olive oil as a main source) is desirable. As for PUFA, in view of the different metabolic effects of the various dietary PUFA [45,47], EFSA has proposed not to formulate a dietary reference value for the intake of total PUFA [37]. Other organizations, such as WHO/FAO in 2010 [36] and SENC (2011) [24], have suggested that PUFA should contribute 6%–10% and 5%, respectively, of total energy intake. In the present study, PUFA contributed roughly 6.6%E, with no gender or age differences. In addition, total n-3 PUFA intake expressed as the percentage of energy intake was 0.63%E for the ANIBES study population and increased with age. The WHO/FAO [36] have recommended a minimum intake for adults of 250 mg/day for n-3 long-chain PUFA and up to 2 g/day to help prevent CVD.
Intervention studies have provided evidence that high fat (>35%E), low carbohydrate (<50%E) diets are associated with adverse short- and long-term effects on body weight, although the data are insufficient to define an LTI for carbohydrates [47,48]. An EFSA panel [47] therefore reached the conclusion that only a reference intake range can be given, 45%E–60%E, where monosaccharides plus disaccharides should be below 10% of the total energy intake. Data from different dietary surveys have shown that average carbohydrate intakes for children and adolescents in European countries varied between 43%E and 58%E, and from 38%E to 56%E in adults, whereas average sugar intakes varied between 16%E and 36%E in children and adults [14,47]. In the present study, a low energy intake of 41.1% from carbohydrates was seen (17.0% from sugars); a trend was observed according to age, with