9
Documentos de Trabajo
9
Documentos de Trabajo
2008
Francisco Pérez García Lorenzo Serrano Martínez
Juan Fernández de Guevara Radoselovics
Estimation
of Social Capital in the World
Time Series by Country
Gran Vía, 12 48001 Bilbao España
Tel.: +34 94 487 52 52 Fax: +34 94 424 46 21
Estimation of Social Capital in the World
Time Series by Country Francisco Pérez García
1,2Lorenzo Serrano Martínez
1,2Juan Fernández de Guevara Radoselovics
1,21U N I V E R S I T Y O F V A L E N C I A
2I N S T I T U T O V A L E N C I A N O D E I N V E S T I G A C I O N E S E C O N Ó M I C A S (Ivie)
Abstract
This working paper presents a new database cov- ering an extensive set of countries from all over the world, compiled by the BBVA Foundation and the Instituto Valenciano de Investigaciones Económicas (Ivie) using the methodology developed in Pérez García et al. (2005). It also updates the database previously presented in the above-mentioned monograph corre- sponding to Organisation for Economic Co-operation and Development (OECD) countries. The new data- base comprises an unbalanced panel of 78 countries for the period 1970-2005, the same period covered by the OECD database. This working paper describes the theoretical and empirical methodology on which the measure of social capital is based. Finally, we include an appendix with the new series.
Resumen
Este documento de trabajo presenta una nueva base de datos elaborada por la Fundación BBVA y el Insti- tuto Valenciano de Investigaciones Económicas (Ivie) de acuerdo con la metodología desarrollada en Pérez García et al. (2005) correspondiente a un con- junto de países de todo el mundo, así como la actua- lización de la base de datos ya presentada previa- mente en la citada monografía, referida a los países de la Organización para la Cooperación y el Desarro- llo Económicos (OCDE). La nueva base de datos re- coge un panel incompleto de 78 países de todo el mundo para el período 1970-2005. La base de da- tos de la OCDE se ha actualizado de forma que in- cluye también el período 1970-2005. Este docu- mento describe la metodología teórica y empírica sobre la cual está basada la medida del capital social aquí desarrollada. Por último, se presentan las nue-
ponsabilidad alguna sobre su contenido ni sobre la inclusión en el mismo de documentos o información complementaria facilitada por los autores.
The BBVA Foundation’s decision to publish this working paper does not imply any re- sponsibility for its content, or for the inclusion therein of any supplementary documents or information facilitated by the authors.
La serie Documentos de Trabajo tiene como objetivo la rápida difusión de los resultados del trabajo de investigación entre los especialistas de esa área, para promover así el intercambio de ideas y el debate académico. Cualquier comenta- rio sobre sus contenidos será bien recibido y debe hacerse llegar directamente a los autores, cuyos datos de contacto aparecen en la Nota sobre los autores.
The Working Papers series is intended to disseminate research findings rapidly among specialists in the field concerned, in order to encourage the exchange of ideas and academ- ic debate. Comments on this paper would be welcome and should be sent direct to the authors at the addresses provided in the About the authors section.
Todos los documentos de trabajo están disponibles, de forma gratuita y en for- mato PDF, en la web de la Fundación BBVA. Si desea una copia impresa, puede solicitarla a través de [email protected].
All working papers can be downloaded free of charge in pdf format from the BBVA Foundation website. Print copies can be ordered from [email protected].
Estimation of Social Capital in the World:
Time Series by Country
© Francisco Pérez García, Lorenzo Serrano Martínez and Juan Fernández de Guevara Radoselovics, 2008
© de esta edición / of this edition: Fundación BBVA, 2008
EDITA/ PUBLISHED BY
Fundación BBVA, 2008 Plaza de San Nicolás, 4. 48005 Bilbao
DEPÓSITO LEGAL/ LEGAL DEPOSIT NO.: M-40.559-2008
IMPRIME/ PRINTED BY: Rógar, S. A.
Impreso en España – Printed in Spain
La serie Documentos de Trabajo de la Fundación BBVA está elaborada con papel 100% reciclado, fabricado a partir de fibras celulósicas recuperadas (papel usado) y no de celulosa virgen, cumplien- do los estándares medioambientales exigidos por la legislación vigente.
La serie Documentos de Trabajo, así como información sobre otras publicaciones de la Fundación BBVA, pueden consultarse en: http://www.fbbva.es
The Working Papers series, as well as information on other BBVA Foundation publications,
can be found at: http://www.fbbva.es
1. Introduction . . . 5
2. Methodology for the Estimation of Social Capital: Theoretical Model . 9 3. Empirical Estimation of Social Capital. Statistical Sources Used . . . 15
3.1. Degree of connection in the social network, c . . . 16
3.2. Marginal cost of investment in social capital, C’ (Is) . . . 19
3.3. Social capital depreciation rate d and survival rate δ . . . 20
3.4. Size of the social network, N . . . 21
3.5. Income inequality rate, G . . . 25
3.6. Time during which a person belongs to the society, T – t . . . 27
3.7. Time discount rate, ρand degree of reciprocity in the society (λ) . . . 28
3.8. Population . . . 28
4. Main Results for the Organisation for Economic Co-operation and Development (OECD) Countries . . . 29
5. Main Characteristics of World Social Capital . . . 39
6. Conclusions . . . 54
Appendix: Database . . . 56
References . . . 73
About the Authors . . . 75
1. Introduction
T
HE high degree of complexity in all types of relationships in modern de- veloped societies, not only in the economic context, but also in social, la- bour and other spheres, is combined with remarkable efficiency in such a way that these complexities do not prevent the economy from functioning properly. While this efficiency may stem from various factors, such as im- proved technologies, it may also derive from behaviours of cooperation in firms, institutions or markets. These behaviours are fostered by the trust among individuals that their commitments will be met. The level of trust achieved in social and economic relationships therefore acts as an intangi- ble factor of production, and represents real social capital. This type of capi- tal leads to improved efficiency at work and in other productive assets, such as physical or human capital.In general terms, social capital may be said to stem from social rela- tionships, and consists of the expectation of benefits deriving from prefer- ential treatment and cooperation between individuals and groups. The role social capital plays in development has received a great deal of atten- tion over recent years in various areas of the social sciences. Sociologists, so- cial psychologists, political scientists and economists have all taken an inter- est in its characteristics, measurement and effects. Institutions look for ways of developing policies that will favour the accumulation of this capital, which is dependent on the social climate and the institutional environment.
The commonly used measures of social capital are based on association- al membership, following the works of Putnam (Putnam et al., 1983; Put- nam, Leonardi and Nanetti, 1993; Putnam, 1995), or on surveys, in which the target population responds to the question of whether, in general, others can be trusted (see, for example, the World Values Survey by Inglehart et al., 2004 or the North American General Social Survey [see Davis, Smith and Marsden, 2004]). Although these indicators are widely used in the economic literature as well as by other social scientists, they generally attempt to quantify social capital either through its antecedents or causes, or through the consequences resulting from attitudes of cooperation. On the whole, their theoretical groundings as measures of capital are not solid and they do not allow a clear causal relation to be established between the concept and its measure.
In numerous studies, social capital is regarded as a result of experi- ences of cooperation in non-economic spheres, such as the family, voluntary associations or citizens’ movements. However, Pérez García et al. (2005) consider that the economic sphere is also a medium that can foster the accumulation of social capital, particularly when individuals personally experience sustained economic growth and can therefore benefit from the improvements this growth brings. This consideration forms one of the cornerstones of our methodology, which is detailed in the following section.
The reason why relationships of trust are generated in these experiences, widespread in developed countries, is that individuals recognise that the efficiency attained in economic activity in advanced societies cannot be reached without the cooperation, albeit self-interested, of the majority. And it is easier to cooperate when one trusts others.
The most important differences between the approach used in the BBVA Foundation-Instituto Valenciano de Investigaciones Económicas (Ivie) project and the indicators most commonly used in the literature are twofold. First of all, there is the recognised role of economic relationships in the generation of cooperation experiences. In this context, the expecta- tions of cooperation in economic activities are extremely important for the generation and generalisation of trust. The second difference lies in the procedure used to measure social capital stock, which is similar to that used by economists to measure other types of capital. According to this approach, the value of assets is based on the flow of expected future payments that possession of these assets will yield, once the costs associated with obtaining them have been deducted. This criterion explains the reason for investing:
investors expect to recover their initial investment.
For a good to be considered as capital, it is assumed to have three characteristics that distinguish it from other available goods and services.
First, it must be produced. This means that it is not a natural resource, but rather, it has been created through the costly investment of resources in a good that is accumulated. Second, it must be productive; in other words, it must contribute to the generation of positive outcomes; in the case of social capital, this productivity operates through a network of trust relationships that reduce transaction costs. Finally, it must be lasting; this requirement means that the service the capital provides must continue through various time periods, and not be consumed on one single occasion, although it will usually depreciate with use. Hence, a sound measure of social capital must be based on a modelling of the investment process and must explain both how individual decisions of trust are integrated, and the aggregate effect of cooperation. This modelling is done by means of a methodology similar
to that used to measure physical capital (Organisation for Economic Co- operation and Development [OECD], 2001).
In our opinion, these two economic dimensions form an important grounding for any measure of social capital. Some studies, not only by econ- omists, have considered social capital as a productive asset (see Bordieu, 1980, 1985; Coleman, 1988, 1990; Putnam, 1995), and many others have highlighted the beneficial effects it has on economic growth and productiv- ity (Knack and Keefer, 1996; La Porta et al., 1997; Zak and Knack, 2001;
Alesina and La Ferrara, 2002; Sobel, 2002, among others) or on the function- ing of institutions (Williamson, 1993). However, hardly any research pres- ents a theoretical development that allows us to identify the determinants of what creates social capital.
Pérez García et al. (2005) model the process by which social capital is created and accumulated from a perspective that stresses these two econom- ic aspects. This formal modelling is used to specify an empirical model that allows social capital to be estimated, using proxies of determinant vari- ables for it. Unfortunately, there are no indicators that directly measure all the concepts we want to quantify, and consequently the selected variables are only approximations. The databases presented here should therefore be considered tentative, and subject to revision as new information and better proxies become available. Despite these limitations, the series presented allow us to begin to assess the characteristics of social capital as we under- stand them here—both in terms of their evolution over time and of the differ- ences between economies—, to analyse the sensitivity of the estimations giv- en by the selected proxies, and to evaluate their capacity to explain econo- mic growth (see Pérez et al., 2006).
The main innovation in this document is a new database that cov- ers 78 countries from all over the world (81% of the total world popula- tion), in the form of an unbalanced panel spanning the period 1970- 2005. The research also updates, to 2005, and improves the database of OECD countries presented in the monograph by Pérez García et al.
(2005). The improvements we introduce are due primarily to the publica- tion of new data on some of the variables used and enhancements to the demographic information required to calculate the life expectancy of the average population age for the set of OECD countries. Other improve- ments are methodological and consist of differentiating between the in- come elasticities of social capital and other productive factors for differ- ent geographical areas, since we consider these may vary among
countries rather than remaining constant for the whole sample, as was the case in the first version.
The working paper is structured as follows. Section 2 briefly outlines the theoretical model on which the measure of social capital is based. In section 3 we describe the empirical application of the theoretical model and revise the proxies of the relevant variables. The main results of the estima- tion of social capital for the OECD database are presented in section 4. The new database of countries from all over the world is presented in section 5.
Finally, conclusions are drawn in section 6.
2. Methodology
for the Estimation of Social Capital:
Theoretical Model
A
S mentioned above, Pérez García et al. (2005) formulate a model based on two key principles: first, the consideration that economic relations are an essential channel in the generation of social capital; and second, that this is the result of a process of accumulation of costly investments which generate economic returns. Social capital is therefore evaluated in the same way as any other type of economic activity: according to its expected future profit- ability. This dual-perspective approach to social capital has two immediate consequences. First, as indicated by Glaeser, Laibson and Sacerdote (2002), similar quantification to any other asset requires an optimal decision model in which an individual will invest in social capital if the future payments as- sociated with this asset are greater than the investment costs. This invest- ment flow accumulates to form social capital stock, which also undergoes processes of depreciation.The second consequence that can be deduced is that once the invest- ment decision and its accumulation in net social capital stock (or wealth capi- tal stock, according to Organisation for Economic Co-operation and Develop- ment [OECD] terminology) have been analysed, its contribution to the production process must be evaluated. To do this, following the same meth- odology as that used to measure physical capital (see OCDE, 2001), the flow of social capital services must be calculated. In the same way that physical capital flow depends on the extent to which it is used (capacity utilisation), social capital flow also depends on the intensity with which the asset is used; in other words, the degree of connection in the social relationships network. This means that an individual’s contribution of social capital to the production pro- cess will be higher, the denser his or her individual relationship network and that of the rest of society are. In contrast, if an individual is completely isolated and has no trust relationships with others, the social capital he or she may have will not contribute to generating positive economic results.
Finally, the aggregation of individual social capital presents similar problems to those existing in the aggregation of physical capital assets,
which can be resolved with the help of a suitable price system, in other words, with the corresponding user cost for social capital.
From these elements, an indicator is constructed that is a function of a set of variables which facilitate a more reliable approach to the empirical estimation of social capital than traditional measures do. To formalise these ideas, Pérez García et al. (2005), following Glaeser, Laibson and Sacerdote (2002), consider social capital to be directly associated with the individual, resulting from a process of investment and accumulation. Hence, the opti- mal investment, Is, in social capital, ks, made by an individual i derives from the problem of maximising the future (net) income expected by the inves- tor. It is therefore necessary to develop hypotheses on the income an individ- ual receives and the costs borne as a result of his or her investment in so- cial capital.
At this point, we introduce the second basic assumption underlying the methodology: the consideration that economic relations are essential to the generation of social capital. Hence, in a context of abundant social capital, transaction and supervision costs, together with uncertainty, will be low- er than in other societies, or other moments in time, with lower social cap- ital. This favourable environment will generate higher income levels than those that would correspond to the contribution of production factors (cap- ital and labour) individuals make. Individuals will associate these higher in- come levels with the fact that they belong to the society, in which—as long as they are not excluded for reasons of existing inequality—their attitudes of cooperation will be remunerated. In contrast, if these expectations are disappointed and the expected incomes are not obtained, social capital will depreciate at rate d.
In sum, the problem of profit (π) maximisation for the representative individual, in order to reach the optimal level of investment in social capital, is determined by the following expression:
MaxIsit [0, ..., T]π=
S
Tt = 0
[
(1 + ρ)1 t(
yit(
1 – G)
– rkit– w¯t(
1 + C (Isit)) ) ]
(2.1)s.t. ksit + 1= δksit+ Isit (2.2) where k is the physical capital stock per worker, r is the return of capital, G an inequality index, w¯ salary and C (Is) the costs associated with social capi- tal investment.
The objective function of the individual shown in expression (2.1) shows that he or she will invest in social capital in such a way as to maximise
the difference between the value of future net incomes, y, which exceeds the remuneration corresponding to his or her contribution to production fac- tors rk + w¯ , duly discounted by the factor ρ, from the present moment t through a period T, derived from the investment in this asset. The duration of the future period, T – t, will be given by the time the person is expected to remain in the society. In addition, when evaluating expected net incomes, the individual will take into account the risk that these may not be obtained.
The risks considered will include that of being excluded from the results of the society and not reaching the average income, due to existing inequality.
The average incomes are therefore corrected with the Gini inequality index (G), by calculating the income that all individuals would receive if no in- equality existed: y (1 – G).
The individual will also bear costs associated with investment in social capital. These costs are represented by the increasing and convex function C (Is) that quantifies the cost of cooperating in terms of its opportunity cost (the time devoted to cooperating), evaluated by the wage w¯ .
Equation (2.2) establishes that social capital, like other capitals, can- not follow just any path, but will depend on past and present investments and on its survival rate (δ = 1 – d).
The productive nature of social capital is reflected in the part it plays in production, in which it intervenes like any other production factor. Assum- ing a Cobb-Douglas technology with constant returns to scale, the per capita production function at a moment in time t can be written according to the following expression.
yt= Atktαhφ KStβ
(2.3) Ltβ
where h is the human capital stock per worker, and α, φ, and βare the in- come elasticities of the physical, human and social capital, respectively. KS is the flow of services of the aggregate social capital and depends on two fac- tors: first, on the contribution of individual social capital to production; and second, on how individual social capitals are aggregated. In the first case we assume that, unlike physical capital, social capital does not lose efficiency over time, although it will depreciate at rate d. We also assume that the de- gree of use of social capital depends on how extensive trust networks among individuals are. Based on graph theory, an indicator, c, is proposed for the degree of connection in the social network. This indicator is bounded be- tween zero and one, in such a way that the larger c is, the greater the contri- bution of social capital to production will be, due to both a greater connec-
tion among the participants in the social network and to the fluidity of in- formation within it. Therefore, the flow of individual social capital services (fksi) will be given by the following expression:
fksi= ciksi (2.4)
With regard to the aggregation of social capital of each of the N indi- viduals who belong to the society, the size of the social network is consid- ered and a Tornqvist index is used. The individual social capital is aggregated multiplicatively through this index, using as weighting factors the weight of the value of the productive services of each individual’s social capital (vi) in the total 1. Thus, the flow of services of aggregated social capital is given by equation (2.5).
KS = N
P
Ni = 1
civiksivi (2.5)
All the above allows us to rewrite the individual’s maximisation prob- lem using equations (2.1)-(2.5) as follows:
MaxIsit [0, ..., T]π=
S
Tt = 0
[
(1 + ρ)1 t(
yit(
1 – G)
– rkit– w¯t(
1 + C (Isit)) ) ]
s.t. ksit + 1= δksit+ Isit (2.6)
The first order conditions are, for each period t considered, as fol- lows:
where is the conjectural variation that measures the expectation individual i has about the change that will occur in the social capital invest-
1. For further details on the aggregation of individual social capital, see Pérez García et al.
(2005), section 3.6.
( P
j = 1N cjvjksjtvj)
βyt= Atktαhφ KStβ
= AtktαhφNβ
Ltβ Ltβ
1 w¯tC’ (Isit) = β(1 – G)T– t –1l = 0
S
d yit + l + 1[
j = 1S
N vj λij]
(2.7)(1 + ρ)t (1 + ρ)t + l + 1 ksjt + l + 1
λij= Isjt
Isit
l
ment decision taken by another individual j, against changes in his or her own social capital investment.
According to this condition, investment in ks is made until the point in which the marginal cost attributed to the effort of cooperating in the pe- riod (reflected on the left hand side of the expression) is equal, at the pres- ent value to the marginal income expected over time (right hand side).
Depending on how we assume the reaction of the other individuals will be to the variations in the deciding agent’s social capital investment, the first order condition may take a different form. If we assume the case of an agent rep- resentative of a society in which all individuals have equal endowments of social capital (ksj= ks j), bear equal costs of use (vj= 1/N j) and respond in the same way to variations in one individual’s social capital (λij= λj ≠i), the con- dition defined by equation (2.7) can be written as follows:
This expression will give us the social capital stock aggregated to the economy:
Social capital therefore depends on the following factors. First, the cost of investing in social capital, measured as working time equivalent to the effort involved in cooperating, and the opportunity cost of this time, proxied by the wage w¯ . Second, the benefits expected from the investment, determined by the well-being associated with the mean income workers ex- pect (y) corrected for inequality (1 – G). It is also influenced by the contri- bution of social capital to income (β); the survival rate of social capital stock (δ); the time horizon of the flow of net income from social capital (T – t);
the discount rate to be applied to future incomes (ρ); the degree of connec- tion in the social network (c) and finally, the variation in other individuals’
social capital investment against changes in one individual’s social capital in- vestment (λ).
Expression (2.9), which defines the optimal stock of social capital, can be expressed as a function of the income-elasticities of the production function:
1 –
(
δ)
T – tw¯tC’ (Isit) = β
(
1 + λN(N – 1))
ksytit(1 – G) 1 + ρ(1 + r)– δ (2.8)1 –
(
δ)
T – tKSt*= βc
(
1 + λ(N – 1))
w¯yt (1 – G) (1 + r) (2.9)t C’ (Isit) 1 + ρ– δ
Equation (2.10) is the base for estimating social capital stock. Since this depends on the parameters of the production function, these can be as- sumed to be constant over time and, if suitable proxies are used for the re- maining variables included in this equation, the volume indexes of social capital can be constructed. Taking year b as the base year, the volume index of so- cial capital can be expressed as follows:
IVKSt*= KSt*
100 (2.11)
KSb*
This expression allows us to compare the paths of social capital over time for a specific geographical area. However, comparisons between countries, while plausible—taking a geographical area in a given moment in time as a reference—involves assuming that all countries present production functions with the same coefficients. To do this, the data presented in the annex to this document are calculated as volume indexes, based on the val- ue in each country in 1990 (or the first available year after this date).
1 –
(
δ)
T – tKSt*= β
c
(
1 + λ(N – 1))
(1 – G) (1 + r) (2.10)γ C’ (Isit) 1 + ρ– δ
3. Empirical Estimation of Social Capital.
Statistical Sources Used
E
QUATIONS (2.10) and (2.11), and the proxies specified for each of the variables in the theoretical model described in the previous section allow us to calculate the value of social capital. In this section, we describe the vari- ables used, their statistical sources and their construction. We focus on the methodological novelties introduced with respect to the previous version of the Organisation for Economic Co-operation and Development (OECD) database in Pérez García et al. (2005). The database now includes all OECD countries with the exception of Iceland for the years 1970 to 2005, and ex- ploits the abundant statistical information available for this set of countries.Among the methodological improvements it is worth mentioning that the population data used in the previous version of the database to calculate some of the variables have been updated, particularly the variable used to proxy the time horizon during which an individual belongs to the society (T – t). The Gini indexes for OECD countries estimated from United Nations data have also been revised in accordance with the updated version of the UN inequality database.
However, the main innovation in this document is the world data- base. The new international database comprises an unbalanced panel of 78 countries from all over the world for the period 1970-2005. The countries and the time periods for each of them included in this new data- base were determined by the availability of information on the variables used.
To guarantee the widest possible geographical and temporal scope of the new database, each variable has been worked on for all the countries in the world between 1970 and 2005. The final scope of the database corresponds to the intersection of the availability of all the necessary variables. Because it covers a wider range of countries, statistical sources other than those provided by the OECD were used, with the result that on occasions, higher levels of heteroge- neity in the statistical information had to be accepted.
We now detail the proxies and the methodology used to calculate them for the two databases considered.
3.1. Degree of connection in the social network, c
In accordance with the methodology proposed in the previous section, the degree of connection in the social network is just one of the elements that must be considered when measuring social capital, even though much of the literature considers it to be a direct indicator of social capital. The de- gree of connection in the social network can be proxied in various ways:
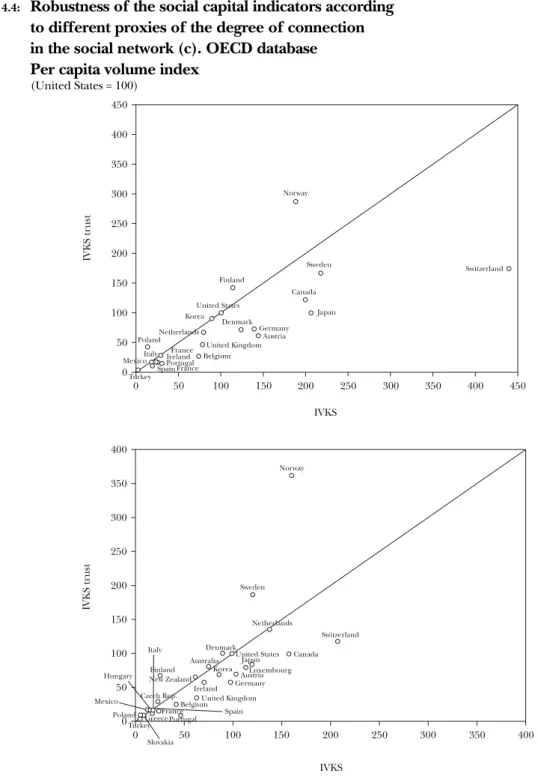
using density of voluntary associations, asking people about the extent of their social networks, or by a widely used question in the social capital litera- ture of whether, in general, others can be trusted. However, when creating a database of various countries covering a protracted time period, complete and thorough data on this aspect is not available. Consequently, to measure the degree of connection in the network, Pérez García et al. (2005) pro- pose the use of the Credit/GDP ratio. That is to say, the relation between the volume of credit with respect to the total amount of economic transactions (GDP). However, later on in this document we analyse the robustness of the indexes obtained against the use of trust as a proxy variable for degree of connectedness in the network.
The importance of bank credit as a percentage of GDP is used because financing activities in general, and credit in particular, are highly intensive in trust relationships 2. Hence, the volume of extended credit as a per- centage of all economic transactions is considered as a proxy of the level of trust connections in the network of economic relations. A great deal of in- formation is available on this indicator over time, with wide geographical dis- aggregation.
Two statistical sources were essentially used for the data on the OECD.
The credit variable was taken from the International Monetary Fund Inter- national Financial Statistics database, specifically, the Domestic Credit series (codes 32..ZF and 32..ZW) included in the Monetary Survey. Because the vol-
2. The term relationship lending is frequently used in the banking literature to refer to the impor- tance of repeated interaction and the establishment of trust relationships between clients and banking entities to solve the problems of uncertainty and asymmetric information typical of fi- nancial activity. It is therefore a concept that is very similar to that of social capital, yet tied to a specific type of economic transaction. A summary of the literature on relationship banking and its links with the concept of social capital can be found in Pérez García and Fernández de Gue- vara (2006).
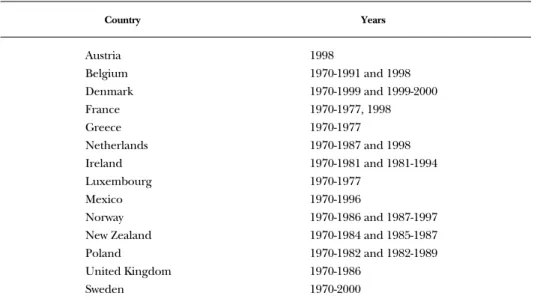
ume of domestic credit in the database has discontinuities for certain countries, it was adjusted by assuming that in the year where there was a break in the series, the variation rate corresponded to the mean of the two previous and the two subsequent years. The variation rates were retained for the years previous to the adjustment, and were used to adjust the levels. The countries and years for which data were corrected appear in table 3.1.
In the case of Luxembourg, the procedure differed from that used for other countries, and also from the procedure used in the previous ver- sion of the database, since the version of the International Monetary Fund’s International Financial Statistics consulted does not provide information for the period 1998-2005. As a result, alternative information sources were sought; specifically, for the period 1978-2005, we used data published in the United Nations World Development Indicators. Previous years were obtained from the rates of variation in the predictions of an exponential regression model where the credit volume was dependent on a constant and a ten- dency. In the Netherlands, since the IMF only provide credit data up to 2004, the credit/GDP ratio for 2005 was estimated from the variation rates for this ratio from the World Bank’s World Development Indicators.
Because the credit/GDP ratio provides values above unity for some of the sample countries, the ratios were rescaled for all countries to the maxi- mum ratio in the sample (Switzerland in 1999).
TABLE 3.1: Adjustments made to the International Monetary Fund credit series in the OECD database
Country Years
Austria 1998
Belgium 1970-1991 and 1998
Denmark 1970-1999 and 1999-2000
France 1970-1977, 1998
Greece 1970-1977
Netherlands 1970-1987 and 1998
Ireland 1970-1981 and 1981-1994
Luxembourg 1970-1977
Mexico 1970-1996
Norway 1970-1986 and 1987-1997
New Zealand 1970-1984 and 1985-1987
Poland 1970-1982 and 1982-1989
United Kingdom 1970-1986
Sweden 1970-2000
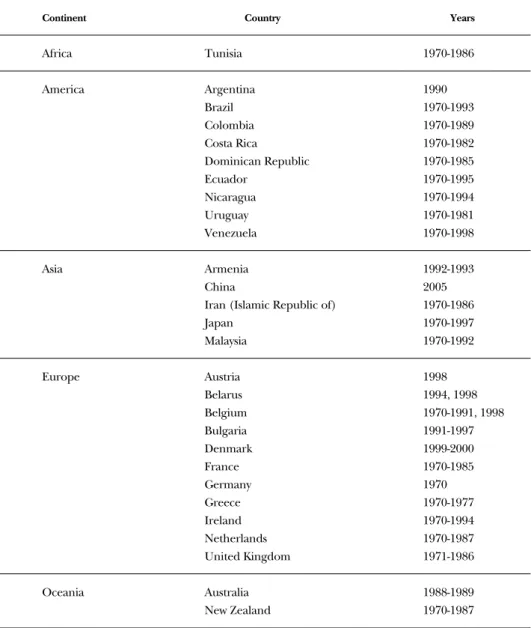
The source of information for the world database is the World Develop- ment Indicators published by the World Bank. Domestic credit granted by the banking sector to the private sector as a percentage of GDP was used as an indi- cator of the degree of connection in the social network. As discontinuities in the credit/GDP ratio also appear in this database, due to methodological changes in the original series, the same adjustment procedure was used as for the OECD database. The countries and periods adjusted are presented in table 3.2.
TABLE 3.2: Adjustments to the Credit/GDP variable in the world database
Continent Country Years
Africa Tunisia 1970-1986
America Argentina 1990
Brazil 1970-1993
Colombia 1970-1989
Costa Rica 1970-1982
Dominican Republic 1970-1985
Ecuador 1970-1995
Nicaragua 1970-1994
Uruguay 1970-1981
Venezuela 1970-1998
Asia Armenia 1992-1993
China 2005
Iran (Islamic Republic of) 1970-1986
Japan 1970-1997
Malaysia 1970-1992
Europe Austria 1998
Belarus 1994, 1998
Belgium 1970-1991, 1998
Bulgaria 1991-1997
Denmark 1999-2000
France 1970-1985
Germany 1970
Greece 1970-1977
Ireland 1970-1994
Netherlands 1970-1987
United Kingdom 1971-1986
Oceania Australia 1988-1989
New Zealand 1970-1987
Domestic credit extended by the banking sector was not available for Bo- tswana, Canada, the United States, Mexico, Trinidad and Tobago, Turkey, Luxembourg, Sweden or Ukraine, and other information sources therefore had to be sought (either total credit extended to the private sector—WDI—
or the IMF Domestic Credit data). Once again, the data were adjusted to stan- dardise the variable in the interval (0,1).
3.2. Marginal cost of investment in social capital, C’ (Is)
A society’s human capital was used as a proxy for the indicator of the marginal cost of social capital investment. The education system is as- sumed to transmit values, norms and attitudes shared by the whole society, increasing the underlying commonality of all the individuals who partici- pate in it and facilitating communication among its members. It would therefore seem reasonable to suppose that the higher the population’s lev- el of education, the closer individuals in the same society will be in terms of understanding of life, common values and preferences, thus leading to lower cooperation costs. Given the fact that the model requires a measure of the cost of investing in social capital, it is calculated as the value 100 minus the percentage of the population with secondary level edu- cation or above.
We used the information provided by Barro and Lee (2000) available at http://www.cid.harvard.edu/ciddata/ciddata.html in both the OECD and world databases. This database provides five-yearly data, available only for the years 1970, 1975, 1980, 1985, 1990, 1995 and 2000. The observations for intermediate years were interpolated, as this variable does not present sharp oscillations. The values for 2000 were also used for subsequent years.
Specific attention was required on data for certain countries. The United States series showed discontinuity between the data for 1975 and 1980. In- formation was therefore taken directly from the US Census Bureau
(http://www.census.gov/population/www/socdemo/educ-attn.html). Be- cause the Barro and Lee (2000) database does not include information on Luxembourg, we chose to use values from the Netherlands for this country.
It was also necessary to construct the series for Germany in the years pre- vious to 1991, when the Federal Republic and the Democratic Republic were unified. Information was also lacking for some former Soviet Union, now independent, republics. Barro and Lee (2000) do however provide in- formation for the USSR, which we used for Armenia, Azerbaijan, Belarus, Georgia, Russia, Ukraine and Moldavia.
3.3. Social capital depreciation rate d and survival rate δ
Other types of capital, as in the case of physical capital, are assumed to lose value through use or with the passing of time. In the case of social capital, as argued by Pérez García et al. (2005), it is not appropriate to assume that trust will be lost simply because of the passing of time or according to a de- termined depreciation function. However, it would seem logical to assume that events in the lives of individuals that lead to loss of trust will lead to the depreciation of social capital. Given the economic approach we take to mea- sure social capital, it would seem appropriate to assume that being unem- ployed, particularly if this continues for a long period, or if the unemployment rate is high, would be one of the main causes leading to loss of trust in others and in society as a whole. This assumption is based on the fact that unemployed status excludes individuals from the basic source of income, and the main form of social relationship (economic) in developed societies, namely the labour relationship. Therefore, the rate of unemployment is used as a proxy for the rate of depreciation.
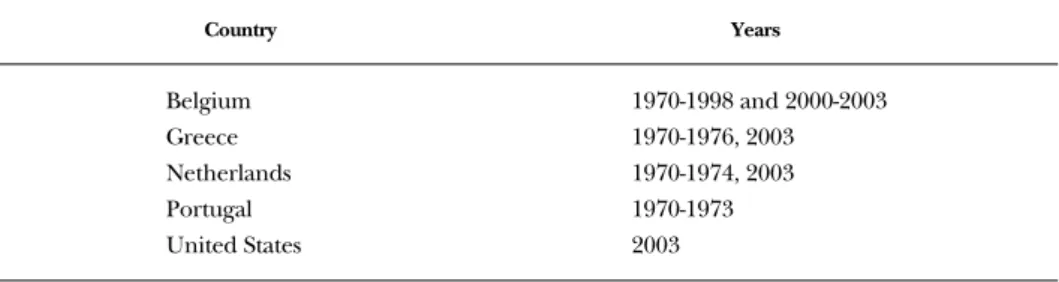
Unemployment rates for the countries covered in the OECD sample were obtained from information on the number of unemployed and of the active population in the OECD Labour Force Statistics database. Gaps in infor- mation for certain countries, particularly for the initial sample years, led us to complete data using the growth rates for unemployment rates published in the Economic Outlook (OECD) database. Table 3.3 shows the periods and countries for which unemployment rates were estimated. Both the unem- ployed and active population series in Germany present discontinuities after 1991, due to German reunification. Prior to this year, only data on the Feder- al Republic was computed, whereas following unification, the two were com- puted together and adjustment was required.
TABLE 3.3: Adjustments to the unemployed and active population series to estimate the unemployment rate for the OECD database
Country Years
Belgium 1970-1998 and 2000-2003
Greece 1970-1976, 2003
Netherlands 1970-1974, 2003
Portugal 1970-1973
United States 2003
In order to obtain a larger number of countries and years to construct the world database, data were taken from the International Labour Organi- zation (ILO) database Laborsta (http://laborsta.ilo.org/). This database gathers a vast amount of information on practically all the world’s labour markets from a variety of national sources (labour force surveys, employ- ment registers, official estimates, etc.). Economically Active Population surveys were taken from the Laborsta database as our primary information source for each country. Other sources were used only when no information was available in these primary sources. Therefore, the International Labour Organization unemployment rate data was completed with the growth rate (or directly the date) of these alternative sources of information, if there was no information in the Economically Active Population Surveys. The al- ternative statistical sources used are International Financial Statistics (IMF), World Development Indicators (World Bank), and the OECD’s Labour Force Sta- tistics and Economic Outlook. Furthermore, the methodological notes to the International Labour Organization data indicate the existence of methodo- logical discontinuities in the series for certain countries. To construct the so- cial capital database, these discontinuities were corrected by following a sim- ilar procedure to that explained for the case of credit. In table 3.4 we present the countries and periods for which adjustments were made.
3.4. Size of the social network, N
It is assumed that the social network is made up of the individuals who partic- ipate in the production process, the workers, as from the basic assumptions presented in the previous section, economic relationships are considered to be the main source of social capital generation, and the workforce is the group with the most active participation in these relationships.
In the OECD database, the same data source and the same procedure to complete information gaps were used as those employed to construct the proxy for the depreciation rate of social capital stock. Specifically, these were the Labour Force Statistics (OECD), completed in the same years as the unemployment rate with Economic Outlook (OECD). The German series also required adjustments due to the reunification. In the world database, the same statistical sources were used as for the case of the unemployment rate, with the exception of the World Development Indicators, which do not provide information on employment. As with the unemployment rate, adjustments were required because of methodological changes that led to discontinuities in the series. Table 3.5 shows the adjusted countries and periods.
TABLE 3.4: Adjustments to the International Labour Organization (ILO) unemployment rate series
Continent Country Years Source used in adjustment
Africa Algeria 1988-2000, 2005 IMF
Botswana 1997, 1999, 2002 Interpolation
Egypt 1976, 1985-1988, 1996 Interpolation
2004 IMF
Mauritius 1995-2003 IMF
Tunisia 1994 IMF
1990-1993, 1995-1996, 1998 Interpolation
America Argentina 1970-1996 Methodological change
Bolivia 2003 IMF
Brazil 1980, 1991, 1994, 2000 Interpolation
Previous adjustment to 1992
Canada 1970-1983 OECD
Colombia 1970-2001 Methodological change
Dominican Republic 1991-1995 IMF
El Salvador 1981-1984, 1987 Interpolation
Honduras 1983-1985,1988-1989, 1993-1994 y 2000 Interpolation
Jamaica 1970-1971 Interpolation
Mexico 1989-1990,1992,1994 Interpolation
Nicaragua 1992-1994 Interpolation
Panama 1980, 1981, 1990 Interpolation
Paraguay 1981, 1995, 1997-1998, 2001 Interpolation
Peru 1988-1990 Interpolation
Trinidad and Tobago 1972, 1976 Interpolation
2003-2005 IMF
Uruguay 1985 Interpolation
1984 WDI (World Development Indicators -UN-)
Venezuela 2003-2005 IMF
Asia Bangladesh 1987-1988,1991-1995,2001-2002 Interpolation
China 1979 Interpolation
2005 IMF
Georgia 1997 IMF
India 1999 Interpolation
Indonesia 2003-2004 WDI
Iran (Islamic Republic of) 2003 Interpolation
1999-2001 WDI
Malaysia 1991-1994 Interpolation
2004-2005 IMF
Philippines 1970 Interpolation
Singapore 1990, 2000 Interpolation
Turkey 1970-1984 OECD
1982, 1986, 1987 Interpolation
TABLE 3.4 (continuation): Adjustments to the International Labour Organization (ILO) unemployment rate series
Continent Country Years Source used in adjustment
Europe Austria 1970-1986 OECD
Belgium 1970-1982 OECD
Bulgaria 1990-1992, 2003-2005 IMF
Croatia 1981-1995 ILO
Czech Republic 1990-1992 OECD
Denmark 1970-1993 OECD
France 1970-1990 ILO
2005 OECD
Germany 1970-2005 OECD
Greece 1970-1980 OECD
Ireland 1970-1982 OECD
Italy 2004-2005 IMF
Luxembourg 1970-1975 OECD
Netherlands 1970-1986 OECD
Norway 1970,1971 OECD
Poland 1990, 1991 IMF
1992 WDI
Portugal 1988 Interpolation
1970-1973 OECD
Romania 1991-1993 ILO
Slovakia 1991-1993 ILO
Slovenia 1986-1992 ILO
Spain 1970-1972 OECD
Switzerland 1970-1990, 2005 OECD
United Kingdom 1970-1986 OECD
Oceania New Zealand 1970-1985 OECD
TABLE 3.5: Adjustments to the International Labour Organization (ILO) employment series
Continent Country Years Source used in adjustment
Africa Algeria 1980-2000 IMF
Botswana 1985-1997 IMF
1999,2002 Interpolation
Egypt 1976, 1985-1988,1996 Interpolation
2004 IMF
Mauritius 1985-2003 IMF
Tunisia 1986-1994 IMF
America Argentina 1985-1989 Interpolation
Bolivia 2001 Interpolation
Brazil 1974-1975, 1980,1991, 1994, 2000 Interpolation
Canada 1970-1985 OECD
Dominican Republic 1991-1995 IMF
El Salvador 1976-1977, 1981-1984, 1986-1991,1993 Interpolation
Honduras 1970-1985 ILO
1986-1987, 1993-1994, 2000 Interpolation
Jamaica 1970-1971 Estimation
Mexico 1990-1994 Interpolation
Nicaragua 2002 Instituto Nacional de Estadísticas y Censos of Nicaragua
Panama 1980-1981, 1990 ILO
Paraguay 1994-1999 IMF
2001-2004 Interpolation
Trinidad and Tobago 1972-1976 Interpolation
Uruguay 1981, 1984-2005 Interpolation
Venezuela 2003 Interpolation
Asia Armenia 1993-2005 ILO
Bangladesh 1987-1988,1991-1995,2001-2002 Interpolation
China 2003-2004 IMF
Georgia 1997-2005 IMF
India 1985-1993, 2001-2002 IMF
Indonesia 1981,1993, 1984 Interpolation
Malaysia 1991-1994 Interpolation
Singapore 2000, 1990, 1971, 1972 Interpolation
Sri Lanka 1991-1994, 1982-1984 Interpolation
2005 IMF
Turkey 1970-1984 OECD
3.5. Income inequality rate, G
The task of obtaining information on the degree of inequality in the econo- mies analysed was complicated and estimations had to be used. This is due to the fact that no research has been conducted which calculates, using uni- form methodology, the degree of inequality in all the countries included here, and less so for such a protracted time period.
The base information used for the estimation comes from the Gini in- dexes on inequality of income distribution provided in the database World
TABLE 3.5 (continuation): Adjustments to the International Labour Organization (ILO) employment series
Continent Country Years Source used in adjustment
Europe Belarus 2004 Interpolation
Belgium 1970-1983, 2005 OECD
Bulgaria 1997-2000 Interpolation
1981-1992 Official estimates obtained from ILO
Denmark 1980-1982 Interpolation
France 1970-1990, 2005 OECD
Greece 1970-1980 OECD
Germany 1970-1991 OECD
Hungary 1991 OECD
Ireland 1969-1982 ILO
Italy 2004 Interpolation
Luxembourg 1992-1993 Interpolation
2004-2005 OECD
Netherlands 1986-1970 OECD
Norway 1970,1971 OECD
Poland 1970-1992 OECD
Portugal 1970-1973 OECD
Republic of Moldova 1989-1998 IMF
Romania 1971-1993 ILO
Slovenia 1992 IMF
Sweden Previous to 1993 OECD
Switzerland 1970-1990, 2005 ILO
Ukraine 1987-1994 ILO
United Kingdom 1986-1970 OECD
Oceania Australia 1970-1977 OECD
New Zealand 1970-1986 OECD
Income Inequality Database, V 2.0a 3(WIDER 2.0a) published by the United Nations. This database comprises a compilation of the results from a diverse range of studies related to income distribution. It therefore lacks a common methodology on statistical sources, the income indicator used, and the refer- ence population group (individuals, households, families, etc.), to calculate the Gini indexes. This limitation is recognised in the database methodology.
Thus, as the only possible solution, we propose that the conceptual base used to calculate all data included in the database should be detailed and specified with complete accuracy. In version 2.0a of the database, a revi- sion process was carried out on the indexes it contains, and observations included in the previous version (v1.0) were eliminated if they offered only limited guarantees on the quality of their calculations. Furthermore, new observations have been included that both improve and update the database.
Given the abovementioned limitations to the base information used, comparisons, both among countries and over time, should be read with cau- tion. Furthermore, periods cannot be thoroughly completed, as there are years and countries for which no information exists. We proceeded as fol- lows to obtain an annual series on the degree of inequality from the data contained in the database. A regression model was specified for each of the two samples we are working with (OECD and world database), in which the Gini indexes selected from WIDER 2.0a were dependent on four variables:
a trend; public expenditure as a percentage of the GDP in each country; GDP per capita (in prices and purchasing power parity for 2000) and the unem- ployment rate. Fixed effects for each country were also included in the re- gression. The Gini index predictions obtained in this way are those used to estimate the volume index of social capital. All the variables used in this spec- ification are described in this section, with the exception of public expen- diture. In the case of the public expenditure variable for the OECD data- base, the series was taken from the Government final consumption expenditure section of the OECD National Accounts. The main source of information for the world database is the World Bank’s World Development Indicators. Where information is not available for a country for a certain year, data were esti- mated using the variation rates for the same variable, but provided by the International Monetary Fund (International Financial Statistics) or the OECD (National Accounts). The GDP per capita data for the world database are mainly taken from the United Nations WDI, although they were also com-
3. The database can be consulted at http://www.wider.unu.edu/wiid/wiid.htm.
pleted with the International Monetary Fund International Financial Statistics and the OECD National Accounts databases.
3.6. Time during which a person belongs to the society, T – t
Life expectancy at the average age of the population is the variable used to proxy the time horizon for the period a person belongs to a society and in- vests resources to generate social capital.
In the case of the OECD database, various statistical sources were used to estimate the variable. There are certain methodological differences from the database presented in Pérez García et al. (2005), essentially because new data have been published since the previous version was compiled, which modify the data previously used.
Given the problems of proxying this variable, we used the information provided by the OECD on life expectancy for the population at the age of 40 published in Health Data (OECD). Since this information is presented sep- arately for men and women, the weighted average of the two was calculat- ed. The proportion of the total number of men and women at 35 and 44 years old in each country and year (Labour Force Statistics, OECD) was used as the weighting factor. Where this information was not available, the distribu- tion of men and women in the total population of the country was used.
In order to account for the differences in age structures among countries, the difference between 40 years and the average age was added to the life expectation of individuals at the age of 40. The following statistical sources were used to estimate the average age. Eurostat was the source for most of the countries analysed. Data for the United States and Korea were constructed from the population by simple age groups provided by the US Census Bureau (US Population Estimates by Age, Sex, Race, and Hispanic Origin) and by the Korea National Statistical Office (population projections for five-yearly groups from 1970 to 2005), respectively. Data on the average age of New Zealand’s population is taken from the publication Demographic Trends 2005 (Statistics New Zealand), which is available on its website. However, the infor- mation necessary to construct the average age series for other countries was not available and assumptions had to be made. The average age for Canada, Japan and Turkey was taken as the mean of the average age of all the OECD countries for which this information existed. Finally, the average age for Mex- ico was taken as the mean of the quintile comprising the countries with the lowest average age in the sample OECD countries.
The United Nations population statistics were used to construct the world database, for which a different calculation procedure was employed.
In this case, two large blocks of data were used, taken from the information contained in the Demographic Yearbooks (United Nations Statistics Division).
The first block refers to life expectancy according to age groups. The sec- ond contains information on the country’s population, also according to age groups. This latter information is used to calculate the average age of population. Because the age groups for life expectancy and for population are not the same, life expectancy could not be calculated as explained above.
Moreover, information on life expectancy was not always available for the same years as for information on population by age groups.
The procedure used is based on the calculation of the average age of the population in each country and year for which data are available. Sec- ondly, using this data, the life expectancy for this average age is calculated from the life expectancy table by age groups for the closest year within the five previous or five subsequent years. Because the UN statistics provide more information for life expectancy at birth than for different age groups, a third phase estimated the regression model where the life expectancy of the average age in each country and year estimated in the first stages were dependent on the life expectancy at birth and dummy variables for the country and year. This model provided estimations of life expectancy for the average age.
3.7. Time discount rate, ρ and degree of reciprocity in the society (λ)
A social discount rate was assumed to be constant and equal to 4%. Like- wise, because we assume the degree of reciprocity in the society (λ) to be constant, we can give it an arbitrary value, for instance, equal to one.
3.8. Population
In addition, the population of each country is used to express the volume of social capital in per capita terms. The National Accounts data published by the OECD is used for the OECD country sample; these data present the evo- lution of the populations of its member countries since 1970. Finally, the population data provided in the United Nations Statistical Division World De- velopment Indicators are used in the world database.
4. Main Results for the Organisation for Economic
Co-operation and Development
(OECD) Countries
T
HE two databases estimated allow us to analyse the evolution of social cap- ital in different geographical areas and to compare countries with varying socio-demographic characteristics, and different legal, institutional, histori- cal and lifestyle frameworks. The first of these databases is described in this section and comprises all the OECD countries (with the exception of Ice- land) for the period between 1970 and 2005. Although differences are ob- served in the OECD context, most OECD member countries share a similar level of development and to a certain extent, a common history. In contrast, the database we present in the following section is more heterogeneous, as it includes a wider set of countries with very different levels of development and per capita income, as well as deep cultural and historical differences.Graphic 4.1 presents the evolution of social capital for the OECD countries, and graphic 4.2, the rate of variation over all the years analysed and three sub-periods (1970-1985, 1985-1995, 1995-2005). The reference used to construct the volume index of social capital was the value of social capital per inhabitant in each country in 1990, or if this year was not avail- able, in the first year for which it could be calculated.
The data in graphic 4.1 evidence the sharp differences in the countries’ profiles. Pronounced oscillations in social capital can be observed, with periods of great expansion followed at times by periods of contraction and reduction. These variations, larger than for other types of capital, such as physical or human, follow the conception of social capital as an asset of trust that is transmitted through the network of social relations. If trust breaks down or is betrayed, it is to be expected that social capital will depreci- ate faster than other assets. In contrast, at times when individuals are shown
1970 700 600 500 400 300 200 100 0
1972 1975
1978 1981
1984 1987
1990 1993
1996 1999
2002 Belgium Australia
2005
1970 700 600 500 400 300 200 100 0
1972 1975
1978 1981
1984 1987
1990 1993
1996 1999
2002
Canada Denmark
2005
1970 700 600 500 400 300 200 100 0
1972 1975
1978 1981
1984 1987
1990 1993
1996 1999
2002
Finland Germany
20