Informes Técnicos Ciemat 1199
Marzo, 2010
Departamiento deMedio Ambiente
Geochemical and Mineralogical Changes in Compacted MX-80 Bentonite Submitted to Heat and Water Gradients
R. Gómez-Espina
Mª. V. Villar
Toda correspondencia en relación con este trabajo debe dirigirse al Servicio de In- formación y Documentación, Centro de Investigaciones Energéticas, Medioambientales y Tecnológicas, Ciudad Universitaria, 28040-MADRID, ESPAÑA.
Las solicitudes de ejemplares deben dirigirse a este mismo Servicio.
Los descriptores se han seleccionado del Thesauro del DOE para describir las ma- terias que contiene este informe con vistas a su recuperación. La catalogación se ha hecho utilizando el documento DOE/TIC-4602 (Rev. 1) Descriptive Cataloguing On-Line, y la cla- sificación de acuerdo con el documento DOE/TIC.4584-R7 Subject Categories and Scope publicados por el Office of Scientific and Technical Information del Departamento de Energía de los Estados Unidos.
Se autoriza la reproducción de los resúmenes analíticos que aparecen en esta pu- blicación.
Depósito Legal: M -14226-1995 ISSN: 1135 - 9420
NIPO: 471-10-015-3
Editorial CIEMAT
Catálogo general de publicaciones oficiales http://www.060.es
CLASIFICACIÓN DOE Y DESCRIPTORES
S58GEoCHEMICal SuRVEyS; BEnTonITE; MInERaloGy; GEoloGIC dEpoSITS; HIGH lEVEl RadIoCTIVE WaSTES; WaTER; CaTIonS
Geochemical and Mineralogical Changes in Compacted MX-80 Bentonite Submitted to Heat and Water Gradients
Gómez-Espina, R.; Villar, M. V.
35 pp. 31 fig. 41 refs.
Abstract:
a 20-cm high column of MX80 bentonite compacted at dry density 1.70 g/cm3 with an initial water content of 16 percent was submitted to heating and hydration by opposite ends for 496 days (TH test). The temperature at the bottom of the column was set at 140°C and on top at 30°C, and deionised water was injected on top at a pressure of 0.01 Mpa. upon dismantling water content, dry density, mineralogy, specific surface area, cation exchange capacity, content of exchan- geable cations, and concentration of soluble salts and pH of aqueous extracts were determined in different positions along the bentonite column. The pore water composition was modelled with a geochemical software. The test tried to simulate the conditions of an engineered barrier in a deep geological repository for high-level radioactive waste.
The water intake and distribution of water content and dry density along the bentonite were conditioned by the thermal gradient. liquid water did not penetrate into the column beyond the area in which the temperature was higher than 100°C. a convection cell was formed above this area, and liquid water loaded with ions evaporated towards cooler bentonite as it reached the area where the temperature was too high. In this area precipitation of mineral phases took place, Advection, interlayer exchange and dissolution/precipitation processes conditioned the composition of the pore water along the column. In most of the column the pore water was na-So42- type, and changed to na-Cl near the heater.
TH treatment did not cause significant changes in the smectite content or the other mineral phases of the bentonite.
Modificaciones Geoquímicas y Mineralógicas de la Bentonita MX-80 Sometida a Gradientes Termo-Hidráulicos
Gómez-Espina, R.; Villar, M. V.
35 pp. 31 fig. 41 refs.
Resumen:
una probeta cilindrica de 20 cm de altura de bentonita MX-80 compactada a densidad seca 1,72 g/cm3 con humedad inicial del 16% se sometió a calentamiento e hidratación por extremos opuestos durante 496 días (ensayo TH). La temperatura en la parte inferior de la probeta se fijó en 140°C y en la parte superior en 30°C, mientras se inyectaba agua desionizada por la parte superior. al desmontar el ensayo se muestreó la bentonita y se determinaron en diferentes posiciones a lo largo de la probeta su densidad seca, humedad, mineralogía, superficie específica, capacidad de cambio catiónico, contenido de cationes intercambiables, y pH y concentración de sales solubles en extractos acuosos. La composición química del agua de poro se modelizó con un código geoquímico. Este ensayo simulaba las condiciones de la barrera de bentonita en un almacenamiento geológico profundo de residuos radiactivos de alta actividad.
El gradiente térmico condicionó la toma de agua y la distribución de humedad y densidad a lo largo de la probeta. El agua líquida no penetró en aquellas zonas de temperatura mayor de 100°C. Sobre esta zona se formó una célula de convección por la que el agua líquida cargada con iones y transportada por advección se evaporaba hacia zonas menos calientes. En esta zona se produjo la precipitación de especies minerales. los procesos de advección, intercambio catiónico y disolución/precipitación condicionaron la composición del agua de poro a lo largo de la probeta. En la mayor parte de ésta el agua era tipo na-So42- y cambió a tipo na-Cl hacia el calentador. El tratamiento TH no provocó alteraciones significativas en la esmectita y las otras fases minerales.
–CONTENTS–
1 INTRODUCTION ... 1
2 MATERIAL ... 2
3 METHODOLOGY ... 3
3.1 THERMO-HYDRAULIC TEST... 3
3.2 POSTMORTEM ANALYSES... 5
4 RESULTS... 7
4.1 ON-LINE MEASUREMENTS... 7
4.2 POSTMORTEM ANALYSES... 11
4.2.1 Dry density and water content... 12
4.2.2 Specific surface area ... 12
4.2.3 Mineralogical composition... 13
4.2.4 Soluble salts... 16
4.2.5 Cation exchange capacity and exchangeable cations ... 19
5 PORE WATER CHEMISTRY MODELLING... 21
6 DISCUSSION... 26
7 SUMMARY AND CONCLUSIONS... 29
8 ACKNOWLEDGEMENTS ... 30
9 REFERENCES ... 30 ANNEX: TABLES OF DATA
GEOCHEMICAL AND MINERALOGICAL CHANGES IN COMPACTED MX-80 BENTONITE SUBMITTED TO HEAT AND WATER GRADIENTS
R. Gómez-Espina & M.V. Villar
1 INTRODUCTION
The design of deep geological repositories for high-level radioactive waste (HLW) includes the construction of a barrier around the waste containers constituted by a sealing material.
Bentonite has been chosen as sealing material in most disposal concepts because of its low permeability, swelling capacity and retention properties, among other features. The behaviour of a HLW repository is determined, to a large extent, by the characteristics of the design and construction of the engineered barriers and especially by the changes that may occur in their mechanical, hydraulic, and geochemical properties as a result of the combined effects of the heat generated by the radioactive decay of the wastes and the water and solutes supplied by the surrounding rock. Therefore, it is considered of fundamental importance for the evaluation of the long-term behaviour of the repository that the processes taking place in the near-field be understood and quantified.
Much attention has been paid since the 1980s to the performance of tests at different scales, in both the laboratory and the field, in order to observe the thermo-hydro-mechanical and geochemical (THM-G) processes taking place in the engineered barriers and the geological medium. The purpose of these experiments has been the direct observation of the phenomena occurring in the barrier and of the behaviour of the system, this providing the information required for the verification and validation of the mathematical models of the coupled processes and their numerical implementation. However, the performance of large-scale in situ tests is complicated and time-consuming and the boundary conditions in them are not always well controlled. For this reason, laboratory tests at different scales in which the conditions of the bentonite in an engineered barrier for HLW disposal are simulated are very useful to identify and quantify processes.
In particular, the thermo-hydraulic tests (TH), such as the one described in this report, submit the clay to conditions close to those at the barrier with respect to the thermal and hydraulic gradients and serve to analyse its behaviour in a controlled way. The bentonite is compacted to densities similar to those in the barrier and put into cylindrical cells. The bentonite is heated on the bottom while hydration with deionised water takes place by the upper part to simulate the thermal gradient created by the heat generated by the radionuclide decay and the hydraulic gradient generated by the groundwater coming from the host rock into the bentonite barrier.
This study was developed in the framework of the Temperature Buffer Test (TBT project), which is a full-scale test for HLW disposal that aims at improving the current understanding of the thermo-hydro-mechanical (THM) behaviour of buffers with a temperature around and above 100°C during the water saturation transient. The principle of the TBT test is to observe, understand and model the behaviour of the components in the deposition hole, starting from an initial unsaturated state under thermal transient and ending with a final saturated state with a stable heat gradient. The French organisation ANDRA is running this test in cooperation with SKB (Svensk Kärnbränslehantering AB 2005). Two electrical heaters simulating the waste containers were placed in a vertical hole drilled in granitic rock. The heaters were surrounded by annular blocks of MX-80 bentonite. To manufacture the blocks, water was
INTRODUCTION
added to the bentonite until reaching a water content of 17.5 percent and it was compacted at dry densities of 1.69 and 1.79 g/cm3 (Hökmark & Fälth 2003). In this way the initial degree of saturation of the barrier was very high. The infiltration test analysed in this report was designed to reproduce these conditions and is also described in Gómez-Espina & Villar (2010).
Similar tests were performed with columns of compacted bentonite submitted to simultaneous heating and hydration by other authors (Karnland & Pusch 1995; Cuevas et al. 1997, 2002;
Poinssot et al. 1998; Martín et al. 2000). In particular, the results reported in Villar et al.
(2008a,b) and Fernández & Villar (in press) were performed in an experimental setup analogous to the one presented here but using FEBEX bentonite. Important bentonite water content and dry density changes were reported to have been created as a consequence of the thermal and hydraulic gradients. The geochemical processes observed were linked to the water movement and the temperature. Specifically, hydration caused dissolution of soluble salts and advective transport of ions, in particular chlorides and sodium. The transport of these ions was controlled by the solubility of the mineral phases, such as gypsum for the sulphate transport. In the hot bentonite, local increases in salt content and other mineral phases were observed, as well as dissolution of dolomite and silicate minerals. Apart from the transport of soluble salts along the bentonite columns during the saturation of the bentonite, a modification of the average cation exchange population in the smectite was observed.
However, no mineralogical alterations were produced, either concerning the minerals present or the smectite characteristics.
Tests like the one presented in this work, in which the expansive clay and the THM conditions are very similar to the ones in large-scale tests, are very useful for a better understanding of the behaviour of expansive clays under controlled thermal and hydraulic gradients similar to those expected in a HLW repository. This kind of experiments is also very helpful for the validation of mathematical formulation and computer codes (Villar 2008b).
2 MATERIAL
The MX-80 bentonite is extracted from Wyoming (USA), and has been selected in many disposal concepts as backfilling and sealing material (Sweden, Finland, Germany, France). It is a worldwide known material supplied in the form of powder homoionised to sodium (SKB reports, Müller-Vonmoss & Kahr 1983, Madsen 1998). The MX-80 batch used in this investigation was composed mainly by montmorillonite (83%) and it also contained cristobalite (6%), quartz (4%), feldspars (7%), and smaller quantities of calcite, gypsum, dolomite, halite and pyrite. The smectitic phases were actually made up of a smectite-illite mixed layer, with 6-7 % of illite layers. The number of stacked TOT layers in the smectite, determined by X-ray diffraction in oriented aggregates, was 6 or 7 depending on the particle size.
Table I shows the elements solubilised in an aqueous extract of dry solid:liquid ratio 1:8. The CEC was 65 meq/100g, and the major exchangeable cations were: Na (46 meq/100g), Ca (23 meq/100g) and Mg (6 meq/100g).
Table I: Solubilised elements and pH in a 1:8 aqueous extract (meq/100g, dried at 110ºC) pH Cl- SO42- CO32- HCO3- Na+ K+ Mg2+ Ca2+
MATERIAL
The less than 2 µm fraction of this bentonite was 80-90% of the total. The liquid limit was 526 percent and the plastic limit was 46 percent, resulting in a plasticity index of 480. The specific weight of the solid particles –determined with pycnometers using deionised water as suspension medium– was 2.82. The hygroscopic water content of the bentonite under the CIEMAT laboratories conditions was around 11 percent. The BET specific surface area was 19.2 ± 0.1 m2/g.
The swelling pressure of the bentonite compacted at dry density 1.70 g/cm3 was about 13 MPa and the hydraulic conductivity for the same dry density was on the order of 10-14 m/s (Villar 2005).
The values given in this section are considered as the “reference” or “initial” values and named so hereafter.
3 METHODOLOGY 3.1 Thermo-hydraulic test
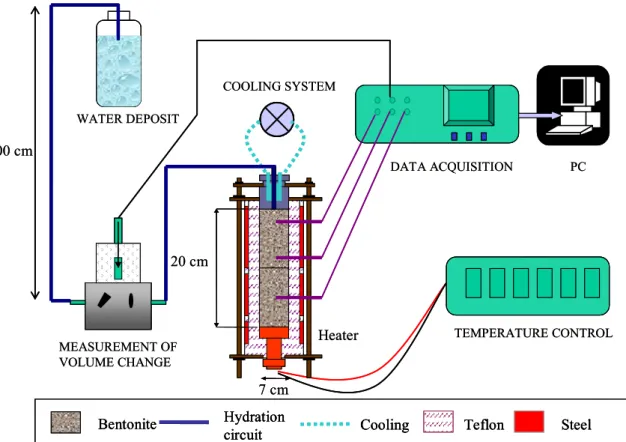
The test was performed in a cylindrical cell whose internal diameter is 7 cm and inner length 20 cm (Villar et al. 2005, Villar et al. 2006a). It was made out of Teflon, whose thermal conductivity is 0.25 W/m·K, to prevent as much as possible lateral heat conduction. The thickness of the cell wall was 15 mm. The watertightness of the contacts was guaranteed by means of Viton® o-rings capable of withstanding temperatures of up to 180°C. The wall of the cell was provided with drillings for the installation of instrumentation. Several steel braces were placed around the cell body to withstand the swelling pressure of the bentonite. Special care was taken to seal any pathway for possible leak, in particular the sensor connections in the cell wall.
The upper closing of the cell was made by means of a set made out of 316L stainless steel, consisting of a plug with lateral o-rings to close the cell that included a chamber for water circulation. A central perforation allowed the passage of the hydration water through the chamber screwed cap and through the plug. The upper steel plug had concentric grooves machined on its bottom.
The cell was instrumented with capacitive-type sensors placed inside the clay at three different levels, at 4, 9 and 14 cm from the hydration surface. The transmitters used were VAISALA HMP237, which included a humidity sensor (HUMICAP®) that changed its dielectrical characteristics with extremely small variations in humidity (capacitive-type relative humidity (RH) sensor). They included also a temperature sensing element (Pt 100).
The accuracy of the humidity sensor was ±1 percent over the range 0-90 percent RH and ±2 percent over the range 90-100 percent RH. The RH and T values could be converted to suction through the psychrometric law. The transmitters were protected by cylindrical stainless steel filters whose diameter was 13.5 mm. The length of the sensors inserted in the clay was 64 mm.
The bottom part of the cell was a plane stainless steel heater set at a temperature of 140ºC, which is the temperature on the surface of the heater of the large-scale TBT test. Inside the deposit in the upper steel plug of the cell water circulated at a constant temperature of 30°C.
In this way, a constant gradient between top and bottom of the sample was imposed. The tightening of all the pieces was made by means of six external steel threaded bars and plates on top and bottom. These bars served as well as support of the cell. A schematic diagram of the setup is shown in Figure 1.
METHODOLOGY
MEASUREMENT OF VOLUME CHANGE
TEMPERATURE CONTROL COOLING SYSTEM
DATA ACQUISITION PC
Heater 7 cm
20 cm
Bentonite Hydration
circuit Cooling Teflon Steel
WATER DEPOSIT
100 cm
MEASUREMENT OF VOLUME CHANGE
TEMPERATURE CONTROL COOLING SYSTEM
DATA ACQUISITION PC
Heater 7 cm
20 cm
Bentonite Hydration
circuit Cooling Teflon Steel
Bentonite Hydration
circuit Cooling Teflon Steel
WATER DEPOSIT
100 cm
Figure 1: Experimental setup for the infiltration tests
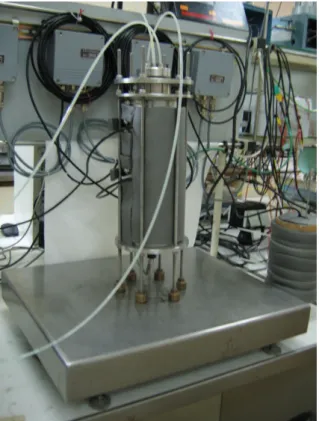
The hydration was made through the upper lid of the cell with deionised water taken from a deposit placed 1 m above the upper part of the bentonite. A stainless steel porous sinter and a filter paper were placed in contact with the bentonite to help a better water distribution. An electronic equipment for the measurement of water intake volume was placed at the entrance of the cell. It had an LVDT displacement transducer that allowed measuring changes of volume with an accuracy of 0.001 cm3. The mounted cell was placed over a balance to check the water intake by a means other than the volume change measurement apparatus (Figure 2).
The cell was laterally surrounded during the TH test with a 15-mm thick dense foam material whose thermal conductivity was 0.04 W/m·K.
Two 10-cm long blocks of MX-80 bentonite compacted with a water content of 16 percent at a nominal dry density of 1.70 g/cm3 were piled up inside the cell (actual density 1.72 g/cm3).
A uniaxial pressure of 43 MPa was applied to manufacture the blocks. Once the assemblage mounted and the sensors connected, the starting off sequence of the test was as follows:
1. The temperature of the heater was set to 100°C.
2. After 190 h the temperature of the heater was increased to the final target value of 140°C.
3. The upper cooling at 30°C was launched after 647 h.
4. Hydration with a 1-m deionised water column started after 667 h and continued for 11903 h (496 days).
METHODOLOGY
Figure 2: Experimental setup for test TBT20_2 (the cell is placed on a balance)
3.2 Postmortem analyses
At the end of the thermo-hydraulic treatment, the cell was dismantled and the clay blocks extracted. Special care was taken to avoid any disturbance in the conditions of the clay, particularly its dry density and water content. Once extracted, the bentonite column was sawed in 10 cylindrical sections of 2 cm in thickness (numbered from 1, near the hydration surface, to 10, close to the heater). They were used for the determination of dry density, water content, mineralogy, specific surface area, soluble salts content and exchangeable cations.
The gravimetric water content (w), defined as the ratio between the mass of water and the mass of dry solid, was determined by oven drying at 110°C for 24 hours. Dry density (ρd) is defined as the ratio between the mass of the dry sample and the volume occupied by it prior to drying. The volume of the specimens was determined by immersing them in a recipient containing mercury and by weighing the mercury displaced, as established in UNE Standard 7045 “Determination of soil porosity.”
To determine the basal spacing, i.e. the d(001) distance, of the smectite immediately after the test and without further treatment, subsamples taken from sections 1 and 10 were preserved in paraffined foil immediately after trimming, and later, a sufficiently flat surface of them was X-rayed at laboratory temperature without any further treatment. A Phillips X’Pert-MPD diffractometer was used with a Cu anticatode and a graphite monocromathor at 45 kV and 50 mA. XRD patterns were obtained with a 0.1000 mm receiving slit and a scanning rate of 0.02
°2θ/s. Data were collected from 3 to 20 °2θ, which is enough to obtain the main peak of the smectite, which may fall between 5 and 9 °2θ (depending on the degree of hydration), corresponding to basal spacings between 18 and 10 Å.
In order to identify the mineralogical species in the bentonite samples, X-ray diffraction (XRD) patterns were obtained in random powders and in oriented aggregates of the less than 2 µm fraction and the fraction between 2 and 20 µm. The powders were obtained by grinding the samples in an agate mortar to a size of less than 53 µm after having dried them at 65°C for
METHODOLOGY
24 h. The small fractions were obtained by dispersion and sedimentation in deionised water.
After drying, these fractions were ground again, mixed with deionised water in a proportion 5 mg/cm2, ultrasounded and poured out onto glass slides. Prior to XRD, the samples were air- dried for 24 h and some of these mounts were saturated with ethylene glycol. The random- oriented powders were examined on a Siemens Kristalloflex 810 diffractometer, using an anticatode Cu-Kα at 30 kV and 40 mA and a scan rate of 0.03 º2θ/s in the range from 2 to 80 º2θ. For the oriented aggregates a slower scan rate (0.02 º2θ/s) was used between 2 and 20 º2θ in order to get better defined peaks. The identification of mineral phases was done using the Powder Diffraction File 2002 (International Center for Diffraction Data) and the semi- quantification was performed by measuring in the diffractograms the area of the diagnostic peak of each mineral and correcting it by taking into account the reflecting factors given in Bradley y Grim (1961), Schultz (1964) and Barahona (1974). The error of this quantification method is about 5 percent.
The external specific surface area of the samples was measured by nitrogen gas adsorption using a volumetric vacuum apparatus (Micromeritics Gemini V). Approximately 0.2 g of sample were ground in an agate mortar for the measurements. The samples were dried at 90°C during at least 24 h before the tests. Prior to the nitrogen adsorption, the samples were outgassed at 90°C for 1 hour using a mixture of helium and nitrogen. The tests were performed at the boiling point of liquid nitrogen (77 K). Surface areas were calculated with the BET method, using a series of nine data points over the P/P0 range of 0.05 to 0.25 on the nitrogen adsorption isotherm and considering a molecular cross section area of 0.162 nm2 for the nitrogen molecule. The determination was accomplished on two aliquots of each subsample.
Soluble salts can be either in solid phase or dissolved in the pore water. To determine them, aqueous extracts with a solid/liquid ratio of 1:8 were prepared by dispersing 5 g of oven-dried sample in 40 mL of deionised water. The solution was kept rotating for 24 h and afterwards it was centrifuged and the supernatant was filtered by 0.45 µm. Immediately afterwards the pH of the aqueous extract was measured whit a digital pH-meter. To determine the carbonate and bicarbonate content in the aqueous extract an automatic titration instrument (Metrohm 702 SM Titrino) was used. The rest of the ions were analysed by means of a cromatograph Metrohm 861 Advanced Compact IC. In both cases the concentrations were given in mg/L and then converted to meq/100g. Triplicates of each bentonite section were prepared and analysed; in some sections a fourth analysis was performed.
To determine the cation exchange capacity (CEC) the exchange sites of the oven-dried samples were saturated using a cooper solution, and the variations in the absorbance of the aqueous extracts, measured by spectrophotometry, with respect to the absorbance in the initial cooper solution, gave the CEC value. Duplicates from every column section were prepared and analysed.
The exchangeable cations were analysed by means of aqueous extracts, obtained adding to the bentonite a 0.5 N solution of CsNO3 with a solid/liquid ratio of 1:8. The caesium displaced the cations in the interlayer and these could be measured in the aqueous extract. Sodium and potassium were measured with a Perkin Elmer 2280 spectrophotometer and calcium and magnesium with an ICP mass spectrometer (Jobin Yvon JY48-JY38). The value obtained for each soluble cation content of every particular section was subtracted from the exchangeable cation content in that section in order to obtain a reliable value. Duplicates from every bentonite section were prepared and analysed.
RESULTS
4 RESULTS
4.1 On-line measurements
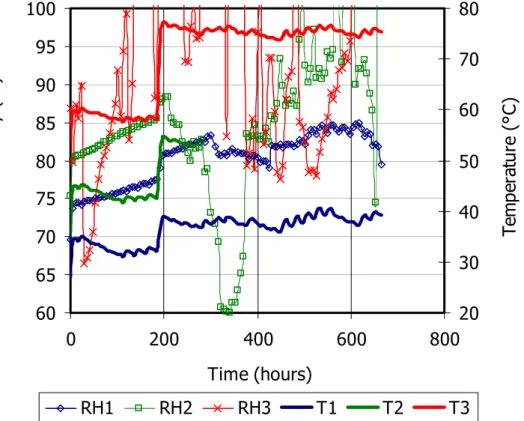
Temperature and relative humidity inside the bentonite and water intake were measured during the TH test (Villar et al. 2006a, test TBT20_2). According to the procedure described above, the bentonite was initially heated during 28 days. The mass of the assemblage was checked daily so that to assure that no changes –and consequently leaks– took place. Figure 3 shows the recordings of the sensors during this initial heating phase. In less than 6 h after switching on the heater the temperatures inside the bentonite were stabilised. The initial relative humidity recorded by the sensors was 67-68 percent, and upon heating it steadily increased in the areas in which sensors 1 and 2 were placed (at 16 and 11 cm from the heater).
The relative humidity recorded by sensor 3, placed at 6 cm from the heater, increased sharply after a transitory drop and after 138 h the sensor stopped working, what could be caused by its flooding. When the temperature of the heater was set to 140°C, the three sensors quickly recorded the corresponding increase in temperature, values of around 75°C being measured at 6 cm from the heater. Sensor 3, at 6 cm from the heater, recorded erratic values of relative humidity but with a trend to be lower than before (but always higher than 80 percent). Upon the increase in temperature of the heater, sensor 2 –at 11 cm from the heater– recorded a drop of relative humidity that was later recovered. Fluctuating values higher than 80 percent were subsequently recorded by sensor 2. Sensor 1 –at 16 cm from the heater– displayed relative humidity values fluctuating between 80 and 85 percent.
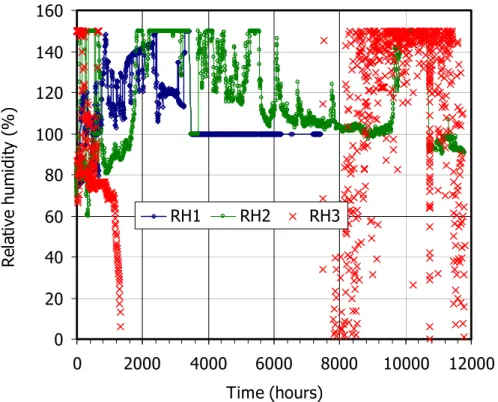
After 667 h of heating, the hydration system was connected. This was considered as time 0 for the rest of the test. Figure 4 and Figure 5 show the evolution of temperature and relative humidity recorded by the sensors during the test. The two upper sensors measured temperatures around 40 and 55°C, reflecting the changes in the laboratory temperature. The sensor closest to the heater started to give negative or 0 values quite soon. The relative humidity values seemed to correspond to sensors flooded (values higher than 100 percent).
This was clear in sensor 1, whose transmission of the relative humidity failed very early.
Sensor 3 provided erratic values of relative humidity due to the lack of temperature measurement, which the sensor needs to calculate the relative humidity (Equation 1). The values given by this sensor are thus not reliable.
The steady temperatures (T, °C) are shown in Figure 6 as a function of the distance from the heater (x, cm). The thermal gradient was not linear, and very steep near the heater. A polynomial curve was fitted so that to interpolate values at different positions (Equation 2):
T = -0.02 x3 + 0.88 x2 -14.97 x +139.8 [2]
At time 10643 h a blackout caused the heater, the cooling system in the upper part of the cell and the data acquisition to stop working. The power failure remained for four days and thus the whole system cooled to room temperature. Figure 7 shows the recovery of temperature and relative humidity when the heater and upper cooling were switched on again. It took 12 h to get the same temperatures in the bentonite as before the blackout. With respect to relative humidity, sensor 3 continued giving the non reliable, erratic values observed before; and sensor 2, that was recording values higher than 100 percent –attributed to flooding– started recoding values around 94 percent and remained so until the end of the tests. If water was condensed inside the sensor filter, cooling could have made it get out and allow the sensor to work properly afterwards.
RESULTS
60 65 70 75 80 85 90 95 100
0 200 400 600 800
Time (hours)
Temperature (°C)
20 30 40 50 60 70 80
Relative humidity (%)
RH1 RH2 RH3 T1 T2 T3
Figure 3: Evolution of relative humidity and temperature during the initial heating phase of the TH test (sensor 1 placed at 4 cm from the hydration surface, sensor 2 at 9 cm and sensor 3 at 14 cm)
30 35 40 45 50 55 60 65 70 75 80
0 2000 4000 6000 8000 10000 12000 Time (hours)
Temperature (°C)
T1 T2 T3
RESULTS
0 20 40 60 80 100 120 140 160
0 2000 4000 6000 8000 10000 12000 Time (hours)
Relative humidity (%)
RH1 RH2 RH3
Figure 5: Evolution of relative humidity during the hydration/heating phase of the TH test (sensor 1 placed at 4 cm from the hydration surface, sensor 2 at 9 cm and sensor 3 at 14 cm)
0 20 40 60 80 100 120 140 160
0 5 10 15 20
Distance from the heater (cm)
Temperature (°C)
Figure 6: Equilibrium temperatures measured along the bentonite block during the TH test
Figure 8 shows the water intake during hydration as measured by the volume change apparatus and by the balance (mass change). Despite the oscillations in mass, the trend of both curves was initially quite coherent. Towards time 5534 h, the hydration tube was accidentally disconnected from the cell, and the upper perforation for water intake remained open to atmosphere for 16 days. It is assumed that this fact did not yield a major lost of water through the upper perforation, since the temperature in the upper part of the bentonite was not high and the bentonite there was highly saturated. However, after reconnection of the hydration system, the water intake measured by the volume change apparatus changed its trend, displaying a sharp linear increase with a constant slope. This does not reflect any expected behaviour of bentonite hydration and in addition was not reflected in the mass
RESULTS
changes. Therefore, this part of the water intake measurement performed by the volume change apparatus is considered faulty. With respect to the mass measurements, they presented significant oscillations and were very much affected by temperature. Both facts made the mass measurement neither too reliable. The final trend of mass drop observed could be due to the spring-time increase in temperature in the laboratory.
25 30 35 40 45 50 55 60
10640 10660 10680 10700 10720 10740 Time (hours)
Temperature (°C)
T1 T2
0 20 40 60 80 100 120 140 160
10640 10660 10680 10700 10720 10740 Time (hours)
Relative humidity (%) RH2 RH3
Figure 7: Recovery of temperature and relative humidity after the cooling caused by a power failure (sensor 1 placed at 4 cm from the hydration surface, sensor 2 at 9 cm and sensor 3 at 14 cm)
0 10 20 30 40 50 60 70 80 90 100
0 2000 4000 6000 8000 10000 12000 Time (h)
Water intake (cm3 )
volume mass
Figure 8: Water intake during the TH test as measured by the volume change apparatus and by the balance
Summarising, the performance of the TH test presented three major difficulties: the maintenance of the airtightness of the cell, the measurement of water intake and the proper functioning of the capacitive sensors, which became quickly flooded as a consequence of the intense water vapour generation.
RESULTS
4.2 Postmortem analyses
The test was dismantled after 11903 hours (496 days) of operation (heating+hydration). It was checked by mass differences that the actual water intake had been of just 32 g, what means that the overall final water content was 18.4 percent. The two blocks were not sealed between them. The height of the upper block had increased from 9.80 to 10.36 cm, whereas that of the lower block had decreased from 9.85 to 9.55 cm. The diameter in the upper part of the bentonite was of 7.17 cm and in the lower part, close to the heater, of 6.95 cm, the initial one being 7.02 cm. These changes in dimensions were a consequence of the swelling of the bentonite in the hydrated zones and of its shrinkage due to heating. Consequently there was an overall decrease in the dry density of the bentonite (from 1.72 to 1.68 g/cm3) caused by the swelling of the clay, that was able to slightly deform the Teflon cell, and its expansion on dismantling. Accordingly, the final overall degree of saturation was 76 percent.
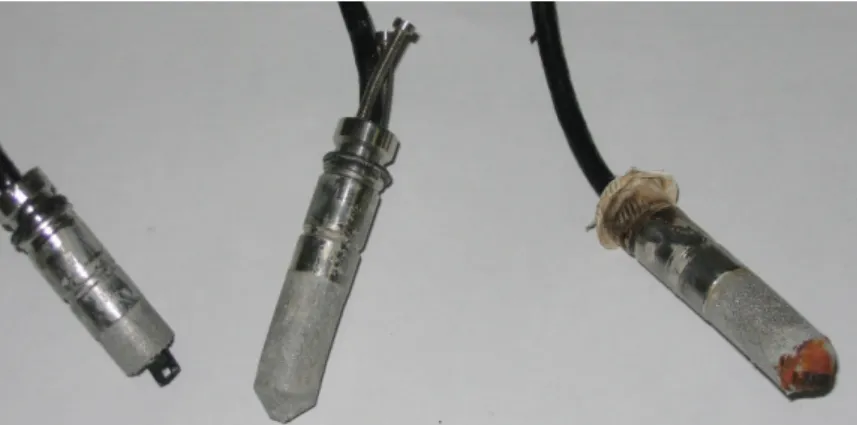
The lower 2 cm of bentonite closest to the heater had turned black. The lower block developed vertical fissures upon extraction and cooling. In the upper block, near the stainless steel filter, an orange halo had developed in the lateral part of the block (Figure 9).
Figure 9: Appearance of the extracted lower (left) and upper (right) bentonite blocks of test TBT20_2
It was difficult to extract the sensors, specially the upper one, whose stainless steel filter broke during extraction. This was due to the huge swelling pressure developed by the saturated bentonite (Sr=94% in this area), since for a dry density of 1.56 g/cm3, which was the one measured close to the sensor at the end of the test, the swelling pressure is higher than 7 MPa (Villar 2005). The lower sensor, placed at 6 cm from the heater, presented corrosion marks on its tip (Figure 10).
Figure 10: Final appearance of the sensors inserted in the bentonite during the TH test (left: upper sensor (broken during extraction), right: lower sensor with corrosion evidences)
RESULTS
4.2.1 Dry density and water content
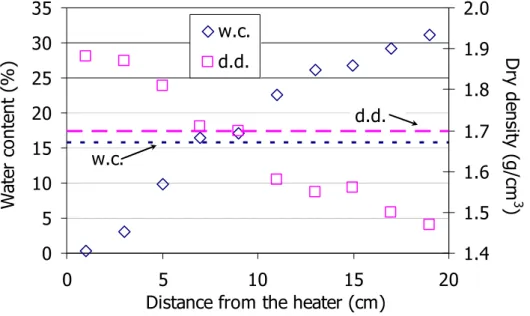
The final distributions of water content and dry density along the bentonite column are shown in Figure 11 (Villar et al. 2006a, Gómez-Espina & Villar 2009). The final water content distribution was linear, from 31 percent near the hydration surface, to 0 percent near the heater, with an average value of 18 percent, which agrees with the final mass increase. The final average was not much higher than the initial value, which was 17 percent. The dry density along the bentonite changed accordingly, decreasing in the hydrated areas (1.47 g/cm3) and increasing near the heater (1.88 g/cm3), as the dimensions of the blocks reported above confirm as well.
Additionally, the state of hydration of the smectite can be studied by determining the number of layers of water in the interlamellar region through measurement of the basal spacing of the smectite, i.e. the d(001) distance, by means of X-ray diffraction. This was done in subsamples taken from sections 1 and 10, i.e. farthest and closest from the heater. The d(001) reflection was 15.5 Å near the hydration surface and 9.5 Å near the heater, reflecting a change in the interlayer hydration state from the 2- to the 0-layer hydrate, the latter corresponding to conditions drier than in the initial bentonite.
0 5 10 15 20 25 30 35
0 5 10 15 20
Distance from the heater (cm)
Water content (%)
1.4 1.5 1.6 1.7 1.8 1.9 2.0
Dry density (g/cm 3) w.c.
d.d.
w.c.
d.d.
Figure 11: Final distribution of water content (w.c.) and dry density (d.d.), the initial values are indicated by horizontal lines
4.2.2 Specific surface area
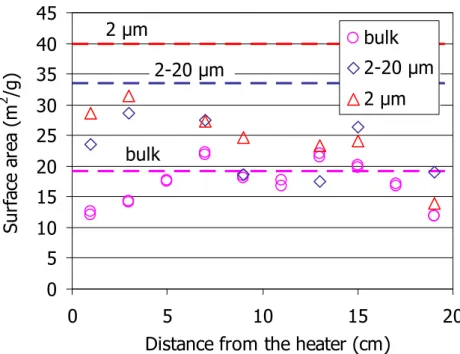
The external specific surface area of the samples taken along the column was determined by nitrogen adsorption in the bulk, less than 2 µm and between 2 and 20 µm fractions (Figure 12). For the bulk size two subsamples of each section were analysed, and the values obtained were on the order of those for the reference sample, except for the samples taken from the column ends, where the values measured were lower. In the small fractions the values found are on average quite lower than for the reference sample, especially towards the column end where the bentonite was more intensely hydrated and where the reduction amounts to 70 percent with respect to the initial value. A slight decrease in the specific surface area of the
RESULTS
0 5 10 15 20 25 30 35 40 45
0 5 10 15 20
Distance from the heater (cm) Surface area (m2 /g)
bulk 2-20 µm 2 µm 2 µm
2-20 µm
bulk
Figure 12: BET specific surface area of different size fractions of samples taken from the bentonite column after TH treatment (points) and of the reference bentonite (horizontal lines)
4.2.3 Mineralogical composition
The mineralogy of 9 samples taken at different distances from the heater was analysed by X- ray diffraction. The minerals identified in the powder samples (Figure 13) were the same of the reference bentonite and they were found in the same relative proportions, except for a slight decrease in quartz and cristobalite content and an increase in calcite and feldspars content, although these changes were difficult to assert due to the low accuracy of the quantification method. No significant changes along the column were observed, except for a trend to find smaller contents of quartz near the hydration area (Figure 14). Halite was identified near the heater and in other locations. This mineral phase could have precipitated during the preparation of the samples for X-ray diffraction, which included drying at 65°C and caused some water loss and consequently possible precipitation of solubilised salts.
Oriented aggregates of the less than 2 µm fraction and the fraction between 2 and 20 µm of 9 samples taken along the column were analysed by means of X-ray diffraction. For both fractions the basal spacing of the smectite was on average 11.45±0.14 Å, on the order of that for the reference smectite (11.43 Å). There was a slight trend for these values to decrease towards the heater, more significant in the clay fraction between 2 and 20 µm. The basal spacing of the glicolated smectite remained in values 15.53±0.10 Å. The number of TOT units per crystallite was calculated using the Scherrer expression and the basal spacing (Brindley 1980). Although in the treated samples it slightly decreased with respect to that for the reference smectite (especially for the particle size between 2 and 20 µm), the observation was not related to the position of the sample along the column (Figure 15). The content of illite interstratified in the smectite was also calculated by the Reynolds method (1980). The average content was 7.5%, on the order of that of the reference sample, with no significant changes along the column (Figure 16).
RESULTS
Figure 13: Powder diffractograms of the reference sample (MX-80) and of different sections along the column (from 1 to 10), their positions being indicated as distance from the heater
RESULTS
81 82 83 84 85 86 87
0 5 10 15 20
Distance from the heater (cm)
Smectite (%)
0 1 2 3 4 5 6 7 8 9
Cc, Qz, Fd, Cb (%)
Sm Cc Qz Fd Cb
Qz
Cc Sm
Fd
Cb
Figure 14: Bulk mineralogical composition as determined by X-ray diffraction in powder samples taken along the bentonite column after TH treatment (points) and in the reference sample (horizontal
lines). Sm: smectite, Cc: calcite; Qz: quartz; Fd: feldspar; Cb: cristobalite
5.0 5.5 6.0 6.5 7.0 7.5
0 5 10 15 20
Distance from the heater (cm)
TOT units
< 2 μm 2-20 μm 2-20 µm
2 µm
Figure 15: Number of TOT units per cristallite in samples taken from different positions along the column after the TH treatment (points) and in the reference sample (horizontal lines)
RESULTS
4 5 6 7 8 9 10 11 12
0 5 10 15 20
Distance from the heater (cm)
Illite content (%)
<2 μm 2-20 μm
2-20 µm
2 µm
Figure 16: Content of illite interstratified in the smectite in samples taken from different positions along the column after the TH treatment (points) and in the reference sample (horizontal lines)
4.2.4 Soluble salts
The soluble salts content was determined by aqueous extraction. Due to the low solid:liquid ratio of the aqueous extracts in which the concentration of soluble ions was measured, it is very likely that the content of soluble salts in the aqueous extract be higher than in the actual pore water, since some solid phases will be solubilised during the aqueous extract preparation, in particular thenardite, nahcolite, halite, fluorite and even calcite and dolomite. This has to be taken into account when analysing the results obtained. Nevertheless, changes in aqueous extract ion concentration along the column with respect to the reference value of the bentonite would indicate dissolution of solid phases during the TH test or transport to other areas, mainly by advection.
The main ions present in the aqueous extracts were sodium and sulphate, which in the reference sample correspond to 93 percent and 53 percent of the cation and anion equivalents, respectively, and after the TH test correspond on average to 95 percent and 75 percent of the cation and anion equivalents, respectively. The average content of ions in the aqueous extracts after the TH test was higher than that for the reference bentonite (Table II). The main responsible ions for this increase were chloride, which increases an average of 219 percent, followed by sulphate, which increases a 107 percent. Sodium and potassium ions also experienced average increases (35 and 33 percent, respectively) whereas the average content of carbonate, bicarbonate, calcium and magnesium ions in the aqueous extracts decreased after the TH treatment between 30 and 50 percent, depending on the ion. Figure 17 shows the distribution of cations and anions along the bentonite column as measured in the aqueous extracts. Overall they were balanced, except in the 5 cm closest to the heater, where the concentration of anions was higher. In the 5 more hydrated cm the concentration of ions decreased with respect to the initial one, what would indicate they were transported, possibly by advection.
RESULTS
Table II: Average content of soluble ions measured in 1:8 aqueous extracts after the TH test (meq/100g) and variation with respect to the reference values shown in Table I (%)
Cl- SO42- HCO3- CO32- Na+ K+ Ca2+ Mg2+
After TH 0.51 10.62 2.43 0.37 12.60 0.12 0.39 0.06 Variation 224 107 -31 -49 35 36 -29 -32
0 5 10 15 20 25
0 5 10 15 20
Distance from the heater (cm)
Concentration (meq/100g)
cations anions
Figure 17: Concentration of cations and anions in the 1:8 aqueous extracts along the bentonite column after the TH test (each point is the average of three measurements), and average values for the
reference bentonite (horizontal lines)
Figure 18 to Figure 20 show the distribution of the different ions along the column after the TH test. The concentration of sulphate ion (Figure 18) decreased with respect to the initial in the 5 cm closest to the hydration surface, whereas in the rest of the column its concentration significantly increased, what gave place to a final average content much higher than the initial (107% higher). Chloride ion was the most mobile species, being transported along the column until reaching a peak of concentration at 3 cm from the heater (Figure 18). The distribution of carbonates and bicarbonates was related to pH, which decreased in the 10 cm closest to heater (Figure 19), possibly due to the increase in the CO2 partial pressure towards the hotter zones.
Additionally, the pH in the aqueous extract could change during the analysis with respect to the pH in the bentonite during the TH test, due to changes in the CO2 partial pressure, and this would change the carbonate and bicarbonate relations. For this reason, it seems better to evaluate alkalinity changes along the column. Overall the alkalinity decreased with respect to the initial values, especially in the central part of the column (Figure 20).
The concentration of sodium ion, which is the main soluble cation, slightly decreased in the 5 cm closest to the hydration surface, but it considerably increased in the rest of the column, the average value along the column being 35 percent higher than the initial one (Figure 18). Its behaviour seems to be coupled to that of sulphate. The concentration of potassium ions followed a similar pattern. On the contrary, the final average calcium ion concentration decreased with respect to the initial value, especially near the more hydrated area. The magnesium ion concentration decreased all along the column with respect to the initial value, without following any particular pattern (Figure 21).
RESULTS
0 2 4 6 8 10 12 14 16 18
0 5 10 15 20
Distance from the heater (cm)
Sulphate, sodium (meq/100g)
0.0 0.5 1.0 1.5 2.0 2.5 3.0
Chloride (meq/100g)
sodium sulphate chloride sodium
sulphate
chloride
Figure 18: Concentration of sulphate, chloride and sodium ions measured in 1:8 aqueous extracts from samples taken at different positions along the column (each point is the average of three
measurements, thick horizontal lines: reference values)
0 1 2 3 4 5 6
0 5 10 15 20
Distance from the heater (cm)
Concentration (meq/100g)
carbonate bicarbonate
carbonate
bicarbonate
Figure 19: Concentration of carbonate and bicarbonate measured in 1:8 aqueous extracts from samples taken at different positions along the column (thick horizontal lines: reference values)
RESULTS
0 1 2 3 4 5 6
0 5 10 15 20
Distance from the heater (cm)
Alkalinity (meq/100g)
7.8 8.0 8.2 8.4 8.6 8.8 9.0 9.2 9.4 9.6
pH
alkalinity pH alkalinity
pH
Figure 20: Alkalinity and pH measured in 1:8 aqueous extracts from samples taken at different positions along the column (each point is the average of three measurements, thick horizontal lines:
reference values)
0.0 0.1 0.2 0.3 0.4 0.5 0.6 0.7
0 5 10 15 20
Distance from the heater (cm)
Calcium (meq/100g)
0.00 0.05 0.10 0.15 0.20 0.25
Mg, K (meq/100g)
calcium magnesium potasium Ca
Mg K
Figure 21: Concentration of calcium, magnesium and potassium ions measured in 1:8 aqueous extracts from samples taken at different positions along the column (each point is the average of three
measurements, thick horizontal lines: reference values)
4.2.5 Cation exchange capacity and exchangeable cations
The cation exchange capacity (CEC) along the bentonite column after the TH test is shown in Figure 22. Overall it decreased with respect to the reference value, especially in the contact with the heater. The summation of exchangeable cations (SEC) as determined by caesium displacement also decreased in the 4 cm closest to the heater. The main exchangeable cations were sodium, calcium and magnesium, and their contents in the interlayer along the column
RESULTS
are shown in Figure 23. Near the water surface the sodium content was slightly higher than the reference value, whereas in the bottom half of the column the content of exchangeable sodium after the TH treatment was lower than the initial. The pattern of exchangeable calcium distribution along the column was the opposite. The content of magnesium in the interlayer after the TH treatment was similar to the initial one, except in the 4 cm closest to the heater, where it drastically decreased. Potassium was also present in the interlayer, and its content decreased with respect to the initial value, chiefly in the upper half of the column. Figure 24 shows the content of each cation in the interlayer as a function of the distance from the heater.
40 45 50 55 60 65 70
0 5 10 15 20
Distance from the heater (cm)
CEC (mmol/100 g)
60 65 70 75 80 85 90
SEC (meq/100 g)
CEC SEC CEC
SEC
Figure 22: Cation exchange capacity (CEC) and summation of equivalent exchangeable cations (SEC) along the bentonite column after the TH test (each point is the average of two measurements) and
values for the reference bentonite (horizontal lines)
0 10 20 30 40 50 60
0 5 10 15 20
Exchangeable Na, Ca (meq/100g)
1 2 3 4 5 6 7 8
Exchangeable Mg, K (meq/100g)
Na Ca K Mg
K Na
Mg
Ca
RESULTS
0 20 40 60 80 100
1 3 5 7 9 11 13 15 17 19
Distance from the heater (cm)
Concentration (meq/100g)
K Mg Ca Na
Figure 24: Concentration of each cation in the interlayer after TH treatment
5 PORE WATER CHEMISTRY MODELLING
The analysis of the chemical composition of compacted bentonite pore water is usually approached by modelling based on the mineralogy, bentonite density and distribution of water in the pores, assuming equilibrium of the ions with certain mineral phases (Curti 1993, Wieland et al. 1994, Bradbury & Baeyens 1998, 2002, 2003, Wanner et al. 1992, Muurinen &
Lehikoinen 1999; Pusch et al. 1999, Fernández et al. 2001, 2004). In this research the chemical composition of the bentonite pore water was approximated by modelling the aqueous extracts results. For that, the concentration of each ion in the pore water was computed by taking into account the actual solid:liquid ratio in each sample during the TH test. To determine these solid:liquid ratios it was necessary to know the volume of free water in the pores, which depended on the dry density and water content of the sample. Thus, the first step in this determination was the definition of the quantity of porosity in which free water could exist, which in turn depended on dry density. The values given by Muurinen et al.
(1987) for compacted MX80 bentonite were used. The range for the free porosity was from 0.06 for a sample compacted at dry density 1.2 g/cm3 to 0.004 for a dry density of 1.8 g/cm3. It was assumed that the “free water” porosity/total porosity ratio was the same as the free water/total water ratio even for samples whose pores were not completely filled with water.
Since the dry density (and hence, porosity) and gravimetric water content of each sample were known (Figure 11), it was possible to calculate the volume of free water for each sample.
Once the percentage of free water was known, it was possible to calculate the concentration of each ion in the free pore water from the concentration measured in the aqueous extracts. The concentrations obtained were very high for all ions, for which reason the theoretical solution would have been oversaturated with respect to several ionic species. To calculate the actual ion concentration in this oversaturated pore solution, the geochemical modelling software Phreeqc (Packhurst & Appelo 1999) was used, with the data base “llnl”, indicated for high
PORE WATER CHEMISTRY MODELLING
temperatures. The actual temperatures during the test in each section (as computed from Equation 2) were taken into account to select the equilibrium constant for each mineral phase.
The temperatures and percentages of free water taken for each section are shown in Table III.
Another necessary parameter for modelling was pH. Since the experimental measurement of this parameter was conditioned by the analytical technique and by the changes in CO2 partial pressure during extraction, a constant value of 8 was selected, as suggested by Bradbury &
Baeyens (2009). These authors considered that, given the high buffer potential of the amphoteric positions in the crystallite edges of the smectite, the possible pH changes were balanced by protonation or deprotonation in the said positions. This high buffer potential was favoured by the high solid:liquid ratio in compacted bentonite.
Table III: Temperatures and percentages of free water used in the modelling for each section
Section Distance from heater (cm)
Temperature (ºC)
Free water (%)
MX-80 23 0.297
1 19 34 1.934
2 17 40 1.681
3 15 45 1.317
4 13 49 1.319
5 11 55 1.043
6 9 62 0.529
7 7 71 0.491
8 5 84 0.192
9 3 102 0.045
10 1 126 0.005
With the recalculated concentration of ions in the pore solution, the pH of this solution (taken as 8), and the temperature during the test, the software computation gave the mineral phases in which the solution would be oversaturated. As a second step, the program was newly run by considering that the solution was in equilibrium with those mineral phases in solid state.
Finally, the ion concentration in the pore water and the mineral phases in equilibrium with it were obtained.
The method described was followed to model the chemical composition of the pore water in the sections along the column, except for the two closest to the heater, for which the ion concentration was too high, especially in chloride and sodium ions. The inverse procedure was followed for them: the mineral phases consistent with the ions present were given as input and the concentration of these ions were calculated by assuming equilibrium with those mineral phases, taking into account the temperature and pH in each section. It was checked that there was not oversaturation with respect to other mineral species and the results were confronted with the input ones to check their validity.
Figure 25 shows the concentration of cations and anions in the pore water along the bentonite
PORE WATER CHEMISTRY MODELLING
strength of the pore solution decreased with respect to the reference one, since the pore water was more diluted after the TH treatment, except in the 5 cm closest to the heater, where the water content was very low. The difference between the values measured in the aqueous extracts (Figure 17) and those calculated for the pore water arised probably from the dissolution of mineral phases during the preparation of the aqueous extracts. This difference was especially high towards the heater, where, although the soluble salts content measured in the aqueous extracts was very high, the pore water volume was very low, what means they were actually precipitated during the TH test.
According to the pore water modelling results, the sulphate and sodium ion concentrations in the pore water were controlled by the equilibrium with thenardite. In the hotter areas chloride and sodium ion concentrations were controlled by halite equilibrium. Calcium and magnesium ions concentrations, as well as alkalinity, were controlled by the pore water equilibrium with calcite and dolomite all along the column.
0 5 10 15 20 25
0 5 10 15 20
Distance from the heater (cm)
Concentration (meq/100g)
cations p.w.
anions p.w.
cations a.e.
anions a.e.
pore water aqueous extracts
Figure 25: Ion concentrations calculated in the pore water and measured in the aqueous extracts of the reference sample (horizontal lines) and at the end of the TH treatment (points)
In particular, the contents of sodium ion and sulphate in the pore water followed a similar evolution along the column and decreased towards the heater, due to the reduction in free water volume towards it (Figure 26). Since there was an increase in both ions measured in the aqueous extracts in the hotter area (Figure 18), thenardite must have precipitated in this zone.
In fact the calculated solution was in equilibrium with this salt.
In most of the column chloride and potassium ion were found in a concentration below saturation for any mineral phase (Figure 27), and that is why the values measured in the aqueous extracts and calculated for the pore water were the same. For chloride ion the values calculated (and measured, Figure 18) were below those for the reference sample except at 3 cm from the heater, where the concentration in chloride ion increased well above the average, due to its advective transport from hydrated areas along the column up to this distance from the heater.
The alkalinity of the pore water decreased towards the heater (Figure 28), the values calculated for the pore water being notably lower than those measured in the aqueous extracts (Figure 19). This could be due to the decrease in carbonate solubility with temperature, which
PORE WATER CHEMISTRY MODELLING
would cause its precipitation in the hotter zones during the TH test and its dissolution during the aqueous extracts preparation. Similarly, the contents of calcium and magnesium ions in the pore water was lower than those measured in the aqueous extracts (Figure 29 vs. Figure 21), which would mean that solid phases in equilibrium with the pore water were dissolved during the aqueous extraction.
0 2 4 6 8 10
0 5 10 15 20
Distance from the heater (cm)
Concentration (meq/100g)
sodium sulphate
sodium
sulphate
Figure 26: Calculated sodium ion and sulphate concentrations in the pore water, in the reference sample (horizontal lines) and at the end of the TH treatment (points)
0.0 0.2 0.4 0.6 0.8 1.0
0 5 10 15 20
Distance from the heater (cm)
Cl concentration (meq/100g)
0.00 0.04 0.08 0.12 0.16 0.20 K concentration (meq/100g) chloride
potassium
Cl
Figure 27: Calculated chloride and potassium ion concentrations in the pore water, in the reference sample (horizontal lines) and at the end of the TH treatment (points)
PORE WATER CHEMISTRY MODELLING
0.00 0.02 0.04 0.06 0.08 0.10
0 5 10 15 20
Distance from the heater (cm) CO32- concentration (meq/100 g)
0.0 0.2 0.4 0.6 0.8 1.0 1.2 1.4
HCO3 - concentration (meq/100 g) carbonate
bicarbonate
carb. bicarb.
Figure 28: Calculated carbonate and bicarbonate concentrations in the pore water, in the reference sample (horizontal lines) and at the end of the TH treatment (points)
1.E-09 1.E-08 1.E-07 1.E-06 1.E-05 1.E-04 1.E-03
0 5 10 15 20
Distance from the heater (cm)
Concentration (meq/100g)
calcium magnesium
Mg Ca
Figure 29: Calculated calcium and magnesium ions concentrations in the pore water, in the reference sample (horizontal lines) and at the end of the TH treatment (points)
DISCUSSION
6 DISCUSSION
The infiltration of a highly compacted 20-cm long bentonite column under a steep thermal gradient gave place to a highly uneven pattern of water content and dry density along the column (Figure 11). The water content decreased lineally from the hydration surface towards the heater, and in the lower half of the column, i.e. the hotter part, with temperatures above 60°C, the water content after 496 days of hydration was lower than the initial one. Due to the fact that the bentonite is highly expansive, the changes in water content implied changes in dry density, and hence, the latter decreased near the hydration surface and increased near the heater due to the water loss.
The redistribution of water inside the column caused by the thermal gradient was more intense than that caused by hydration. The sensors recorded the initial movement of water from the hot part towards cooler areas (Figure 3). Despite the fact that the initial water degree of saturation of the bentonite was high (67%), the movement of water in the vapour phase towards cooler areas was predominant over the entrance of liquid water through the hydration surface. Nevertheless, a sort of convection cell probably formed in the proximity to the heater, since the accumulation in this area of soluble ions coming from the upper part of the column (discussed below) indicates that liquid water was actually able to get to a certain distance from the heater (about 4 cm) although eventually it evaporated. This distance was approximately the limit beyond which the temperature inside the bentonite was higher than 100°C.
The X-ray diffraction analysis did not reveal any significant changes in the mineralogical composition of the bentonite after the TH treatment, except for a slight decrease in quartz and cristobalite content and an increase in calcite and feldspars content. However, new accessory phases whose content was below the XRD method detection limit were deduced from the pore water modelling, as it is explained below. On the contrary, the gypsum and halite detected in some sections by XRD could have precipitated during the drying of the bentonite at 65°C prior to the mineralogical analysis.
For the particle size fraction between 2 and 20 µm, the size of the crystallite was negatively correlated to the content of potassium in the interlayer (r2=-0.88). Sposito (1984) indicated that for divalent cations the number of TOT units in the crystallite was between 4 and 8, whereas Verburg & Baveye (1994) gave a value of 1 to 4 TOT units for smectites with predominance of large cations in the interlayer, such as potassium and caesium. However, the size of the crystallite decreased on average after TH treatment with respect to that of the reference sample, despite the fact that the content of interchangeable potassium tended to decrease (Figure 23).
The cation exchange capacity decreased with respect to the reference value along the whole column, especially near the heater (Figure 22). This decrease could be due either to a decrease in the number of exchangeable positions in the smectite interlayer or to an increase in the ratio divalent/monovalent cations in the interlayer. However, the sum of equivalent exchangeable cations along the column after the TH test was similar to the initial one, except in the 5 cm closest to the heater. This would confirm the hypothesis of monovalent cations being substituted by divalent ones in most of the column, whereas an actual decrease in exchangeable positions would have taken place only near the heater. These tendencies were observed by other authors in experiments of hydrothermal alteration of bentonite (Leguey et al. 2002, Villar et al. 2006b, 2008a). This reduction in interlayer occupancy by monovalent
DISCUSSION
place to balance the lost of cationic positions in the interlayer. In fact, these tendencies are in agreement with the law proposed by Schofield (1947), which indicates that, as the moisture content of a soil increases, divalent cations will tend to preferentially move from the solution onto the soil’s exchange sites (Dyer et al. 2008).
Figure 30 shows the sum of exchangeable and soluble cations for the reference sample (initial conditions) and for the bentonite after TH treatment (average of all the sections). The initial and final concentrations were balanced, what indicates there was not diffusion of ions outwards the cell and would point to the transfer of cations between the interlayer and the pore water as the main process affecting cations.
0 10 20 30 40 50 60
Na Ca Mg K
Concentration (meq/100g)
initial final
Figure 30: Sum of cations present in the interlayer and in the aqueous extracts before (reference bentonite) and after the TH test (average of all the sections)
To discriminate the contribution of different processes to the final distribution of cations at the interlayer and in the pore water along the column, the concentration of each cation measured in the aqueous extract was compared with the concentration calculated by considering that the changes in the aqueous extract concentration were exclusively due to the changes measured in the exchange complex (Table IV, Figure 31). It was assumed that during the aqueous extraction process all soluble phases were dissolved. Thus, calculated values higher than measured would indicate precipitation of low solubility mineral phases or transport of soluble salts towards other areas, and calculated values lower than measured would indicate a source of pore water cations different from the interlayer, such as dissolution of mineral phases or transport of soluble salts from other areas. The results obtained in the pore water modelling help to assert the likelihood of each of these processes.
The measured and calculated values for the sodium ion were quite similar along the column, although in the wetter part the measured content tended to be higher, what could indicate that dissolution of mineral phases took place (due to the increase in water content or the particular geochemical conditions); and in the hotter part tended to be lower, what would point to precipitation of less soluble sodium minerals in this area. For the calcium ion the measured content tended to be lower than the calculated one in the wetter part of the column, what would point to transport towards hotter areas or to the precipitation of calcium minerals, although this last hypothesis was not validated by the pore water modelling. In the lower part of the column the trend inverted, and the calculated values were lower than the measured ones, due probably to the income of calcium transported from wetter areas or dissolution of calcium minerals (although the latter hypothesis was neither confirmed by the pore water