The views expressed in this working paper are those of the author(s) and do not necessarily represent those of IMF or IMF policy. This paper investigates the relationship between growth forecast errors and planned fiscal consolidation during the crisis. We find that, in advanced economies, stronger planned fiscal consolidation has been associated with lower-than-expected growth, with the relationship particularly strong, both statistically and economically, at the beginning of the crisis.
The weaker ratio in more recent years may partly reflect learning by predictors and partly smaller multipliers than in the early years of the crisis. Keywords: Fiscal policy, forecasting, taxation, government expenditure, output fluctuations Author's e-mail address: [email protected]; [email protected].
Introduction
Our forecast data come from the IMF's spring forecasts for the world economy (IMF, 2010c), which include forecasts of growth and fiscal consolidation – measured by the change in the structural fiscal balance – for 26 European economies. We find that the 1 percentage point increase in GDP in the 2010-2011 fiscal consolidation forecast was associated with a real GDP loss in 2010-2011 of about 1 percent relative to the forecast. These could conceivably affect the growth forecast error and be related to fiscal consolidation forecasts.
We note that forecasters have significantly underestimated the rise in unemployment and the fall in private consumption and investment associated with fiscal consolidation. The short-term effects of fiscal policy on economic activity are just one of many factors to consider when determining the appropriate pace of fiscal consolidation for an individual economy.
Forecast Errors and Fiscal Consolidation Forecasts
In Section V, we conclude with a discussion of what our results do and do not mean for actual multipliers. Lower coefficients in recent years may partly reflect predictor learning and partly lower actual multipliers than in the early years of the crisis. First, forecasters typically do not use explicit multipliers, but instead use models in which the actual multipliers depend on the type of fiscal adjustment and other economic conditions.
Thus, we can only guess what the assumed and consequently actual multipliers were during the crisis. Third, our findings that short-run fiscal multipliers were larger than expected have no mechanistic implications for the implementation of fiscal policy.
Specification and Data
GDP, a widely used measure of the discretionary change in fiscal policy for which we have forecasts.6 Positive values of ΔF i,t:t+1 indicate fiscal consolidation, while negative values indicate discretionary fiscal stimulus. We use all available data for the European Union's (EU's) 27 member states, as well as for the remaining three European economies classified as "advanced" in the WEO database: Iceland, Norway and Switzerland. WEO forecasts for the structural fiscal balance made in April 2010 are not available for Estonia, Latvia, Lithuania and Luxembourg.
The cyclically adjusted balance is the budget balance adjusted for the cyclical effects; see for example A. One series used in Table 6 of the Annex, namely the IMF Vulnerability Classification, is confidential information and could not be included in the database.
Results
Robustness
Choice of Economies and Role of Outliers
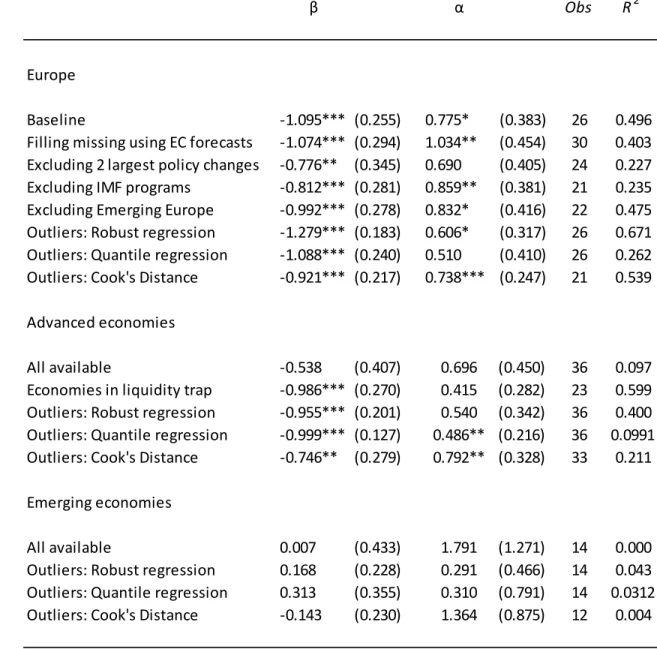
As Table 1 reports, when we remove the two largest policy changes (those for Germany and Greece), the estimate of β drops to – 0.776 ( t -statistic = –2.249) but remains statistically significant at the 5 percent level. Similarly, excluding the four economies classified as “emerging” in the WEO database from the sample (Bulgaria, Hungary, Poland and Romania) has little effect on the point estimate for β, which is -0.992 (t-statistic = -3.568) in this case. 14. As Table 1 reports, the robust regression estimate of β is -1.279 (t-statistic, which is similar to the baseline OLS estimate and statistically significant at 1.
As Table 1 reports, the estimate of β drops to –0.538 (t-statistic = –1.322) for this group of economies and is no longer statistically significant. The robust regression, which weights down influential outliers, yields an estimate of β of -0.955 (t) statistic that is close to the base sample estimate and is statistically significant at the 1 percent level.
Controlling for Other Variables
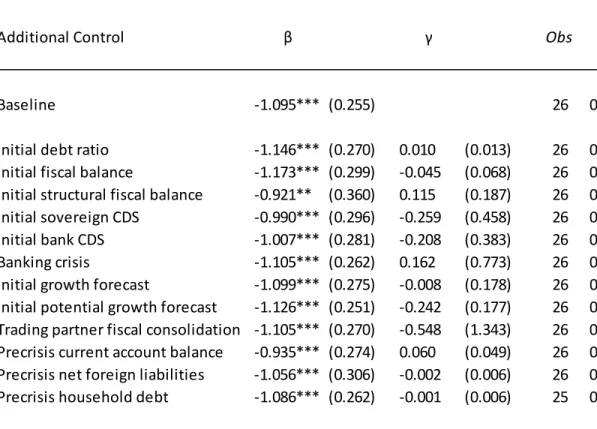
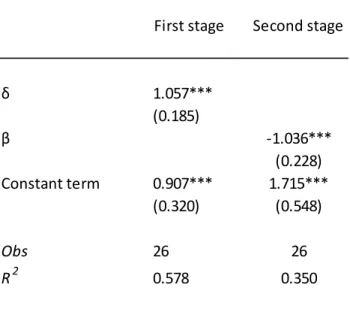
Relatedly, controlling for the forecast error of the change in fiscal policy does not, in our application, provide a way to estimate the causal effect of fiscal policy on growth. The baseline finding also holds after controlling for the fiscal consolidation of trading partners. To examine the role of precrisis external imbalances that may have caused both fiscal consolidation and larger-than-expected headwinds to growth, we control for the precrisis (2007) current account deficit-to-GDP ratio, again taken from the April 2010 WEO -database (IMF, 2010c), and find similar results.
We obtain similar results when we control for the pre-crisis (2007) stock of net foreign liabilities as a percentage of GDP, based on the updated and extended version of the data constructed by Lane and Milesi-Ferretti (2007). In particular, we reestimate the basic equation controlling for the pre-crisis (2007) level of the household debt-to-disposable income ratio.
Different Forecast Vintages
Extensions
After discussing the robustness of our baseline results on a number of dimensions, we move on to three extensions. First, we check whether the baseline results differ depending on whether fiscal consolidation reflects changes in government spending or changes in revenues. Second, we consider the relationship between planned fiscal consolidation and the forecast errors for the components of total expenditures and for the unemployment rate.
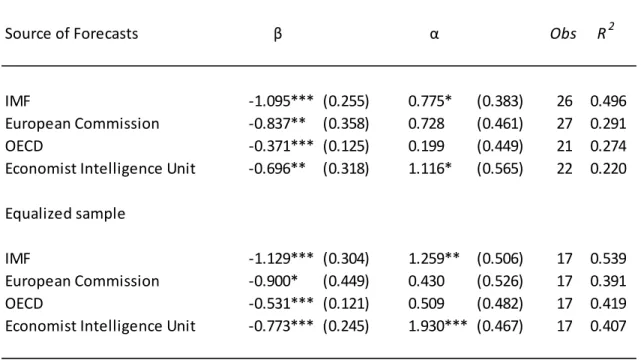
Third, we examine whether the baseline results also hold when we rely on forecast errors from other forecasters, including the EC, OECD and EIU.
Government Spending and Revenue
We construct forecasts of structural expenditure change based on the conventional assumption of a zero elasticity of government expenditure relative to the output gap (IMF, 2009a). Thus, we approximate the forecast for the change in the ratio of structural expenditures to potential GDP with the forecast for the change in the ratio of total expenditures to potential GDP. The point estimate of the coefficient on the forecast of government expenditure (1.244, t-statistic = 4.989) is slightly greater in absolute value than the coefficient on the forecast of income (–0.865, t-statistic, but the difference is slightly statistically insignificant (p-value of 0.102).34 We estimate equation (3) using general government or primary expenditure.
Overall, we conclude that fiscal multipliers are underestimated on average for both sides of the fiscal balance, with a slightly larger degree of underestimation associated with changes in Components of aggregate spending and unemployment To get a sense of the sources of the growth forecast errors, we reestimate the baseline.
Components of Aggregate Spending and Unemployment
As Table 6 notes, when we parse the effect on GDP in this way, we find that planned fiscal consolidation is associated with significantly lower than expected consumption and investment growth. The coefficient for investment growth (–2.681) is about three times greater than that for private consumption growth (–0.816), consistent with research showing that investment varies relatively widely in response to general economic conditions. Conventional models predict that fiscal consolidation is normally accompanied by lower interest rates, which supports investment.
That investment growth falls more than expected as a result of fiscal consolidation may reflect the lack of the conventional interest rate effect during this period. Since lower-than-expected output growth can be expected to reduce inflationary pressures, we also look at the forecast error for the GDP deflator and find evidence of a negative but statistically insignificant relationship. Repeating the exercise for the unemployment rate, we find a coefficient of 0.608, which is statistically and economically significant.
Overall, we find that forecasters for the base sample have significantly underestimated the rise in unemployment and the decline in domestic demand associated with fiscal consolidation.
Alternative Forecasts
Conclusions
Similarly, the October 2010 WEO (IMF, 2010d) chapter on fiscal consolidation presents multiplier estimates for 15 advanced economies over the period 1979–2009 that average 0.5 percent over two years.36 This evidence and our finding that, on average, no of the gap between assumed and actual fiscal multipliers before the crisis would mean that the multipliers predicted before the crisis were about 0.5. 35 Note that it is not possible to draw conclusions about the assumed multipliers from the regressions of the growth forecast on the forecast of the fiscal policy stance. 37 The December 2010 OECD Economic Outlook includes a table on the likely effects of fiscal consolidation on GDP, which suggests multipliers closer to 1 for a package consisting equally of spending cuts and direct tax increases.
Such higher multipliers, if used in forecasts, may help explain our finding of a smaller coefficient on fiscal consolidation forecasts for OECD growth forecast errors. The short-term effects of fiscal policy on economic activity are only one of many factors that must be considered in determining the appropriate pace of fiscal consolidation for an individual country. Controlling for the change in banks' CDS spreads over the same time period yields a β estimate of –1.002 (t-statistics) Next, we control for the revision of the original (end-2009) government debt to GDP ratio.
Finally, controlling for unexpected fiscal consolidation (the fiscal consolidation forecast error) does not significantly affect the results. The forecast error of fiscal consolidation cannot therefore be interpreted as an identified fiscal shock. Appendix Table 2 reports the results of repeating the analysis reported in Table 2 for the broader group of all advanced economies.
For the projections made in 2012, the coefficient is significant in some specifications and not in others. Appendix Table 5 shows the results of a similar exercise, where both the coefficient on the budgetary consolidation forecast and on each additional control are allowed to vary over time. Allowing the coefficient on the controls to vary over time produces estimates for the coefficients on the budgetary consolidation projections that are similar to those in previous tables.
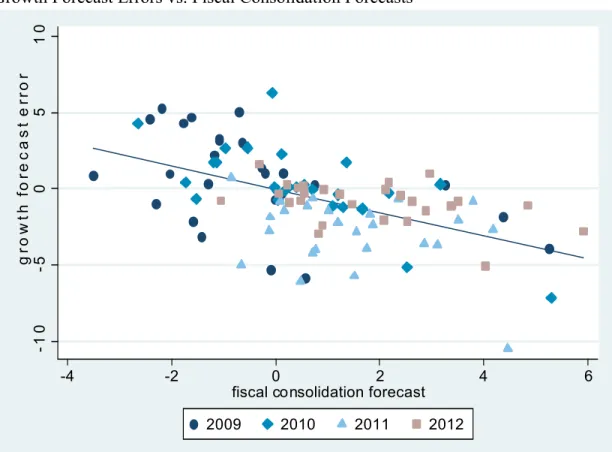
In particular, the coefficients on fiscal consolidation projections made during the 2009-2012 period are all negative, and they are larger in absolute value and statistically more significant for the projections made in 2009-2010 than in 2011-2012. Coefficients for fiscal consolidation forecast (β) and vulnerability score (γ) constant in columns 1-2, and allowed to vary over time in columns 3-4. Notes: Figure plots the projection error for real GDP growth in 2010 and 2011 against projections made in spring 2010 on projections of fiscal consolidation for 2010 and 2011 made in spring 2010; and regression line.
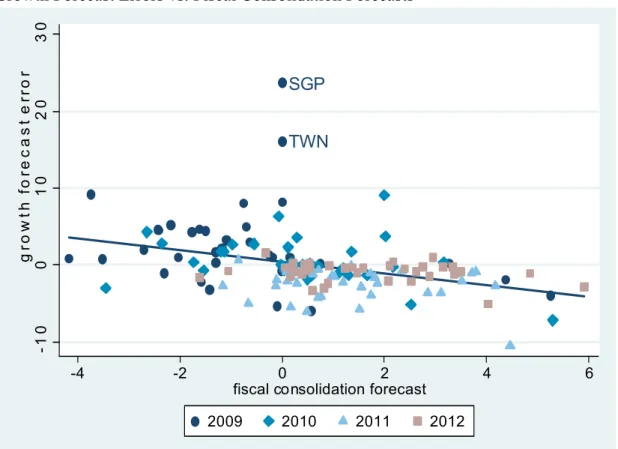
Note: The figure shows the forecast error for real GDP growth in years t and t+1 relative to the forecasts made in the spring of year t over the fiscal consolidation forecasts for t and t+1 made in the spring of year t , for the years t and 2012; and simple regression line for the panel of observations without time effects.