Hadronically decaying massive particles, jet substructure, and measurement of the transverse momentum of the Z boson at LHC
Francesco De Lorenzi (Iowa State University)
on behalf of the ATLAS and CMS collaborations
Francesco De Lor enzi-ICHEP14 .
Introduction
• LHC experiments provided several measurements testing QCD
• At low p T : multiple soft-gluon radiation
• At high p T : hard-gluon emission
• The data are used to tune next-to-leading order plus parton shower Monte Carlo simulations
• Very high p T hadronically decaying W/Z
• provide a direct test of QCD calculations of gluon and quark radiation
• validate novel techniques of jet shapes and jet substructure for boson tagging and reducing the sensitivity to soft QCD and pileup
2
Francesco De Lor enzi-ICHEP14 .
Outline
• Z p T distribution at 7 and 8 TeV and MC tuning
• Boosted Z→bb and W/Z → qq’
• Jet substructure for high p T W
3
Francesco De Lor enzi-ICHEP14 .
Z p T : 7 TeV Results
• Z →ee and Z→µµ
• Low p
T:
• Good agreement with ResBos, Pythia,
Sherpa, Alpgen
• Sensitivity to tunes
• High p
T: quite good modeling by FEWZ, ResBos
]-1 [GeV Tq/dσ) dσ(1/
0 0.01 0.02 0.03 0.04 0.05 0.06 0.07 0.08
combined) data (e + µ
Z2
POWHEG+PYTHIA
Z2
PYTHIA
ProQ20
PYTHIA
Perugia 2011
PYTHIA
[GeV]
qT
0 5 10 15 20 25 30
dataδ(data - theory)/
-5 0 5
CMS
= 7 TeV s at L dt = 36 pb-1
∫
0 GeV 2
T>
.1, p 2
<
η|
|
]-1 [GeV Tq/dσ dσ1/
10-7
10-6
10-5
10-4
10-3
10-2
combined) data (e + µ
Z2
POWHEG+PYTHIA s) α2
O(
FEWZ s) O(α
FEWZ
[GeV]
qT 20 30 40 50 100 200 300
data / theory
1 2
CMS
= 7 TeV s at L dt = 36 pb-1
∫
0 GeV 2
T>
.1, p 2
<
η|
|
Phys.Rev. D85 (2012) 032002
4
arXiv:1406.3660
Francesco De Lor enzi-ICHEP14 .
Z p T : CMS 8 TeV Results
High p
T: good description by RESBOS (less good by POWHEG) as well as by FEWZ (but low stat. for p
T> 100 GeV).
Low p
T: sensitivity to the PS tune. Best description by PYTHIA Z2star;
POWHEG+PYTHIA Z2star provide only marginal description of the low p
Tdata
1 10 102
-1 [GeV/c] Tdqσ
d 1 σ
10-6
10-5
10-4
10-3
10-2
10-1
CMS Preliminary
Resbos data
>20 GeV
|<2.1, pT
|η
= 8 TeV s
-1 at 18.4 pb
∫
[GeV/c]
qT
1 10 102
dataσ(data-MC)/ -5 0 5
[GeV/c]
qT -1 [GeV/c] T/dqσ dσ1/
0 0.01 0.02 0.03 0.04 0.05 0.06 0.07 0.08
) µ µ
→ data (Z
Pythia/Powheg Z2star Pythia Z2star Pythia P0 Pythia D6T Pythia 4C
[GeV/c]
qT
0 5 10 15 20 25 30
dataσ(data - theory)/
-5 0 5
CMS preliminary
=8 TeV s
-1 at 18.4 pb
∫
.1, 2
<
η|
| >20 GeV
pT
[GeV]
qT
]-1 [GeV T/dqσ dσ1/
10-7
10-6
10-5
10-4
10-3
10-2
data
Pythia/Powheg Z2star FEWZ CTEQ12NNLO
[GeV]
qT
20 30 40 50 60 70 100 200 300 400 500
data / theory
0 2 4
CMS preliminary
=8 TeV s
-1 at 18.4 pb
∫
.1, 2
<
η|
| >20 GeV
pT
CMS-PAS-SMP-12-025
5
Francesco De Lor enzi-ICHEP14 .
ATLAS Z ɸ* 7 TeV result
Measurements at low p
T(Z) are limited by experimental resolution and uncertainties on p
T(l) scale. Use new observable ɸ*:
⇤ ⌘ = tan( acop /2) ⇥ sin(✓ ⌘ ⇤ )
cos(✓ ⌘ ⇤ ) = tanh ⇥
(⌘ + ⌘ )/2 ⇤
Scattering angle ofthe leptons wrt the beam axis in the Z rest frame
acop = ⇡ (l, l)
• ɸ* is an angular variable. Angular resolution for leptons: ~0.5 mrad on φ and ~0.001 on η
• Correlated with p
Tand it probes ~ the same physics
Phys.Lett. B720 (2013) 32
6
Francesco De Lor enzi-ICHEP14 .
ATLAS Parton Shower Tune
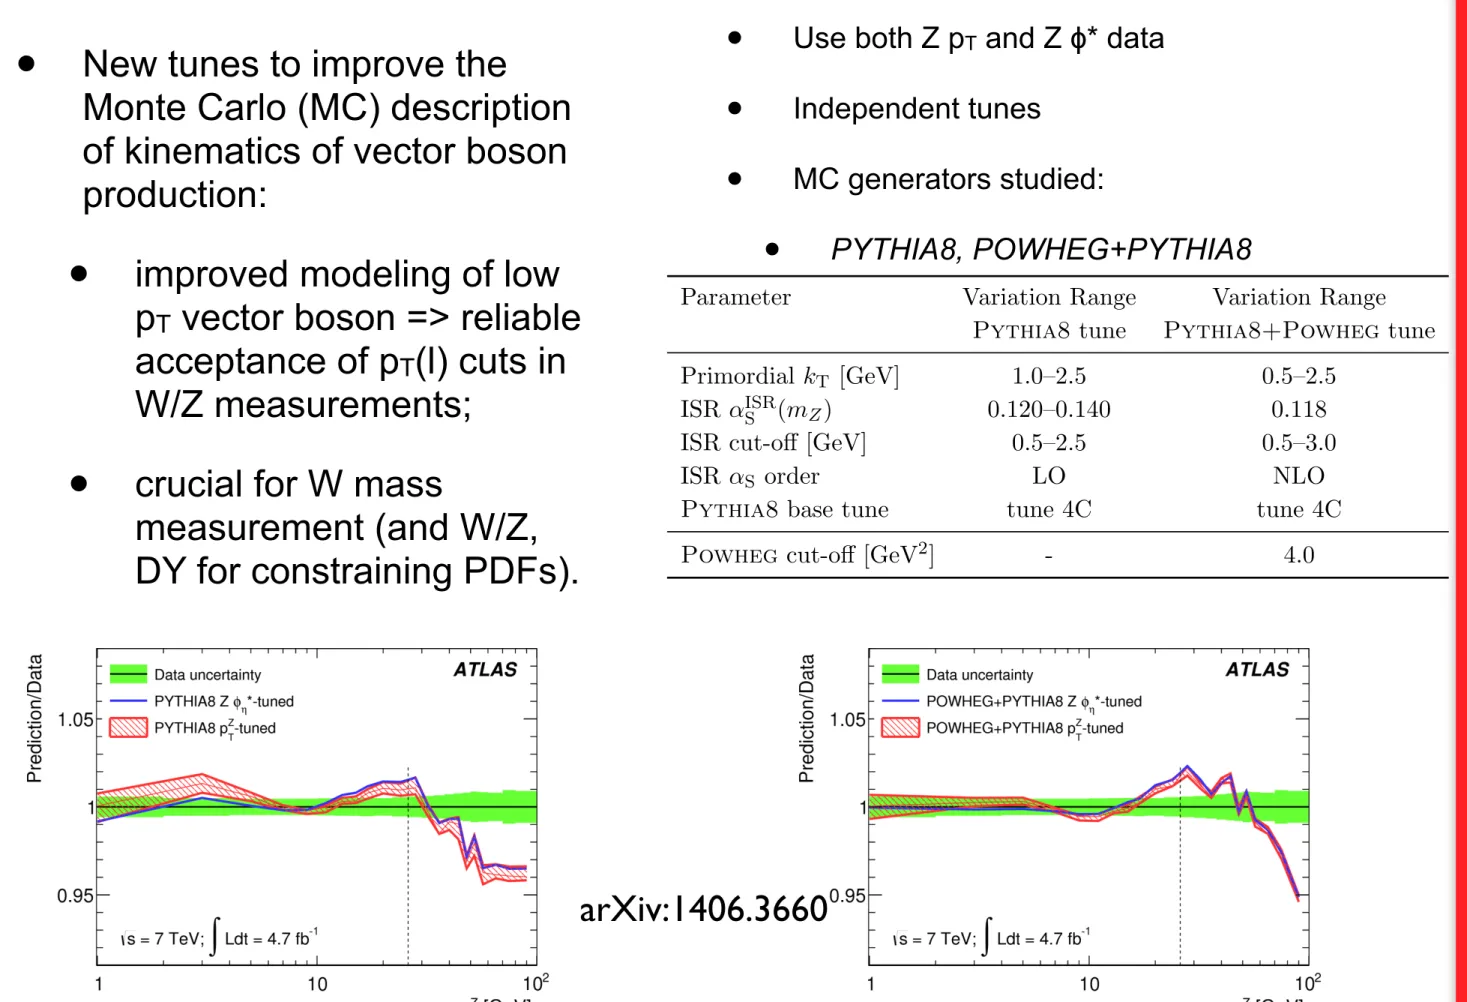
• New tunes to improve the
Monte Carlo (MC) description of kinematics of vector boson production:
• improved modeling of low p
Tvector boson => reliable acceptance of p
T(l) cuts in W/Z measurements;
• crucial for W mass
measurement (and W/Z, DY for constraining PDFs).
Parameter Variation Range Variation Range Pythia8 tune Pythia8+Powheg tune
Primordial kT [GeV] 1.0–2.5 0.5–2.5
ISR ↵ISRS (mZ) 0.120–0.140 0.118
ISR cut-o↵ [GeV] 0.5–2.5 0.5–3.0
ISR ↵S order LO NLO
Pythia8 base tune tune 4C tune 4C Powheg cut-o↵ [GeV2] - 4.0
Table 4. Parameter ranges and model switches used in the tuning of Pythia8 and Pythia8+Powheg described in section 10.
transverse momentum threshold p2T,min, which is a steerable parameter in the program. Be- low p2T,min, Powheg generates events without extra radiation and the phase space is popu- lated by Pythia8. Therefore, the upper limit of the Pythia8 parton shower should match the Powheg cut-o↵ value. The tunes are performed using p2T,min = 4 GeV2, corresponding to pZT = 2 GeV. In addition, in order to avoid discontinuities in the matched spectrum, the
↵S(mZ) value used to calculate the QCD radiation in Powheg should match ↵SISR(mZ) in Pythia; ↵S(mZ) = 0.118 is used as in the CT10 PDFs. Correspondingly the running of ↵S in the parton shower calculation is set to NLO. The tuning of Powheg+Pythia8 hence only varies the shower cut-o↵ and the primordial kT in Pythia8. The other steerable parameters not used in the tuning are set to the values defined by the 4C tune.
The tunes are performed using the Professor [52] package, which interpolates the depen- dence of MC predictions on the model parameters as originally proposed in ref. [53]. Predic- tions for the pZT distribution are generated at randomly chosen parameter settings (anchor points) in the ranges indicated in table 4. A fourth-order polynomial is used to approxi- mate the generator predictions between the anchor points. The optimal parameter values are determined using a 2 minimization between the interpolated generator response and the data.
The sensitivity of the generator parameters to the pZT and ?⌘ measurements is probed by performing tunes of Pythia8 and Powheg+Pythia8 to each measurement separately.
As shown in table 5 both measurements have comparable sensitivity and yield compatible tuned parameter values. As a further check of the compatibility between the pZT and
?⌘ measurements, the pZT-tuned and ?⌘-tuned predictions are compared to the measured pZT distribution. The tuning uncertainty is obtained from variations of the eigenvector components of the parameters error matrix over a range covering 2 = 2min/dof. Figure 9 shows that the tuned predictions agree with the measured cross sections within 2% for pZT < 50 GeV, and with each other within the tuned parameter uncertainties.
Since the pZT and ?⌘ observables provide similar sensitivity to the parton shower parameters and to avoid correlations between these measurements, the final tune optimally combines
– 23 –
• Use both Z p
Tand Z ɸ* data
• Independent tunes
• MC generators studied:
• PYTHIA8, POWHEG+PYTHIA8
7
arXiv:1406.3660
Francesco De Lor enzi-ICHEP14 .
High p T Z→bb
• Phase space: 2 anti-k
Tb-jets with R=0.4,
• p
T(jet)>40 GeV,
• |η(jet)|<2.5,
• ΔR<1.2,
• p
T(dijet)>200 GeV,
• 60 < M(dijet) < 160 GeV
• Separate Signal and control regions with a NN S
NNbased on Δη(dijet, balancing jet) and |η(dijet)|
• Very small correlation between NN and dijet mass
• Constrain the background shape from data in background enriched control region
8
arXiv:1404.7042
Signal
Background
Francesco De Lor enzi-ICHEP14 .
High p T Z→bb
• Background: Simultaneous fit in signal and control region
• Signal model: allow peak position and yield as free parameters, other
parameters from MC
• Other small backgrounds from MC
• Acceptance from MC
Z ! bb (p dijet T > 200 GeV ) =
2.02 ± 0.2(stat.) ± 0.25(syst.) ± 0.06(lumi.)pb
POWHEG = 2.02 +0.25 0.19 (scales) +0.03 0.04 (PDF)pb
NLO ME+PS predictions:
aMC@NLO = 1.98 +0.16 0.08 (scales) ± 0.03(PDF)pb
Very good agreement with predictions
9
Francesco De Lor enzi-ICHEP14 .
Boosted W/Z → qq’
• Reconstruct hadronic decay product in a single jet
• anti-k T R=0.6
• p T > 320 GeV
• Boosted back the constituents in the jet center of mass frame
• QCD jets isotropic distribution while W/Z jets back-to-back topology
• Build a discriminating
likelihood variable using jet shape variables in the jet CoM frame (thrust, sphericity and aplanarity)
10
Jet center-of-mass frame
arXiv:1407.0800
NEW!
Likelihood
-0.5 0 0.5
Jets / 0.04
0 0.02 0.04 0.06 0.08 0.1 0.12 0.14
QCD jets W/Z jets Data 2011
ATLAS
= 7 TeV, 4.6 fb-1
s
> 320 GeV pT
< 1.9
Francesco De Lor enzi-ICHEP14 .
• Signal extracted with fit to the jet mass distribution
• Background model extensively studied in control regions, in different kinematic ranges and with different MC
• Signal Model from MC
• Other small background from MC
• Signal acceptance from MC
11
W+Z(W
±/Z ! qq; p
T> 320 GeV, | ⌘ | < 1.9) = 8.5 ± 0.8 (stat.) ± 1.5 (syst.) pb.
W MCFM +Z = 5.1 ± 0.5 pb. Consistent with MCFM prediction within 2σ
Boosted W/Z → qq’
NEW!
Jet Mass [GeV]
50 100 150 200 250
Jets / 2 GeV
0 5000 10000 15000 20000 25000
Data 2011
Signal + Background fit Background fit component Signal fit component
ATLAS
= 7 TeV, 4.6 fb-1
s
| < 1.9 > 320 GeV |
pT
L > 0.15
Jet Mass [GeV]
50 60 70 80 90 100 110 120 130 140
Data - Fit bkg
-200 0 200 400 600 800 1000 1200 1400 1600 1800
Francesco De Lor enzi-ICHEP14 .
Jet substructure: Boosted W
• Exploit jet substructure and jet shapes techniques for W tagging in searches and measurement
• Studies performance of different
• jet algorithm (anti-kt, CA)
• grooming combinations
(trimming, pruning, split-filter, BDRS)
• Jet R (0.8, 1.0, 1.2)
• p
Tbins
• Data/MC comparison in QCD/
Signal enriched samples
ATL-PHYS-PUB-2014-004 CMS-PAS-JME-13-006
pruned jet mass (GeV)
0 50 100 150
Normalized Distribution
0 0.2 0.4
, Pythia6 WL
WL
X →
+ <PU> = 22 + sim.
+ <PU> = 12 + sim.
W+jets, MG+Pythia6 + <PU> = 22 + sim.
+ <PU> = 12 + sim.
= 8 TeV, W+jets s
CMS Preliminary Simulation,
CA R=0.8 < 350 GeV 250 < pT
|<2.4
|η
12
Francesco De Lor enzi-ICHEP14 .
W-tagging variables
• Several tagging variables studied
• splitting scales,
width n-subjettines, mass drop, Q-jets, planar flow, subjet balance, energy
correlation functions (and MVA
combinations)
• Tagging performance optimized in p
Tbins and for different jet algorithm, grooming and size
τ1 2/ τ
0 0.2 0.4 0.6 0.8 1
Normalized Distribution
0 0.1 0.2 0.3
, Pythia6 WL
WL
X →
+ <PU> = 22 + sim.
+ <PU> = 12 + sim.
W+jets, MG+Pythia6 + <PU> = 22 + sim.
+ <PU> = 12 + sim.
= 8 TeV, W+jets s
CMS Preliminary Simulation,
CA R=0.8 < 350 GeV 250 < pT
|<2.4
|η
< 100 GeV 60 < mJ
∈sig
0 0.2 0.4 0.6 0.8 1
bkg∈1 -
0 0.2 0.4 0.6 0.8 1
Neural Network (MLP) Likelihood
τ1 2/ τ ΓQJet
pruned τ1
2/ τ
kT axes τ1
2/ τ
=1.7) (β C2
mass drop
= 8 TeV, W+jets s
CMS Preliminary Simulation,
CA R = 0.8 < 350 GeV 250 < pT
|<2.4
|η
< 100 GeV 60 < mj
13
Francesco De Lor enzi-ICHEP14 .
Conclusion
• Many measurements that probe kinematics of W/Z production at LHC.
• p T (Z): low p T gives sensitivity to the parton-shower model and to resummation effects; high p T – test of higher-order calculations
• Z ɸ*: probes same physics as p T , but doesn't depend on
momentum scale; test of resummation and parton-shower models
• MC tunes to p T /ɸ* data: improved modeling of the low-p T region (crucial for W-mass measurement.)
• Hadronically decaying boosted boson:
• Important check for searches using boosted system
• measurement in agreement with prediction (fixed order or ME +PS)
14
Backup
15
Francesco De Lor enzi-ICHEP14 .
MC Generators/Calculation
16
• Low pT: (multiple soft-gluon radiation):
• resummation up to NNLL (RESBOS) with 2 different non- perturbative parameterization used to perform the resummation
• parton shower (PS) techniques (PYTHIA, HERWIG),
• ME+PS with ME O(α S ) (MC@NLO, POWHEG);
• High pT: (hard-gluon emission):
• fixed-order calculations up to O(α 2 S ) (FEWZ,
DYNNLO) V+jet @NLO: MCFM, Blackhat+Sherpa)
• multi-leg tree-level ME+PS (SHERPA, ALPGEN).
Francesco De Lor enzi-ICHEP14 .
Grooming
17
Francesco De Lor enzi-ICHEP14 .
18
Francesco De Lor enzi-ICHEP14 .
Z→bb
19
Dominant trigger Other triggers p
T> 250 GeV
Different kinematic regions and triggers provide consistent measurements
Francesco De Lor enzi-ICHEP14 .
W/Z → qq’
20
α = pbal/Mdijet, where pbal is the transverse momentum of the best balancing jet and Mdijet is the invariant mass of the candidate jet - balancing jet system.
Jet Mass [GeV]
50 60 70 80 90 100 110 120 130 140
Jets / 2 GeV
0 200 400 600 800
1000 ATLAS
= 7 TeV, 4.6 fb-1
s
> 320 GeV pT
< 0.2 < 1.9 PT
Control region fit
Data fit background
Jet Mass [GeV]
50 60 70 80 90 100 110 120 130 140
Jets / 2 GeV
0 200 400 600 800 1000
1200 ATLAS
= 7 TeV, 4.6 fb-1
s
> 320 GeV pT
< 1.9 Second leading L Jet
Control region fit
Data fit background
Jets / 0.04
0 0.02 0.04 0.06 0.08 0.1
0.12 Data 2011
PYTHIA8 PYTHIA6 AMBT1 PYTHIA6 AMBT2B HERWIG++
PYTHIA6 PERUGIA2011 POWHEG + PYTHIA
ATLAS
= 7 TeV, 4.6 fb-1
s
> 320 GeV pT
< 1.9
Likelihood
-0.8 -0.6 -0.4 -0.2 0 0.2 0.4 0.6
MC/Data
0.6 0.8 1 1.2 1.4
Likelihood -0.8 -0.6 -0.4 -0.2 0 0.2 0.4 0.6
Jets / 0.04
0 0.02 0.04 0.06 0.08 0.1 0.12 0.14 0.16 0.18
PYTHIA8 PYTHIA6 AMBT1 PYTHIA6 AMBT2B HERWIG
ATLAS Simulation = 7 TeV
s
> 320 GeV pT
< 1.9
Francesco De Lor enzi-ICHEP14 .
W/Z → qq’
21
Jet Mass [GeV]
50 60 70 80 90 100 110 120 130 140
Jets / 2 GeV
0 5000 10000 15000 20000 25000
Data 2011
Signal + Background fit Background fit component Signal fit component
ATLAS
= 7 TeV, 4.6 fb-1
s
| < 1.9 > 320 GeV | pT
L > 0.15
Jet Mass [GeV]
50 60 70 80 90 100 110 120 130 140
Jets / 2 GeV
0 2000 4000 6000 8000 10000 12000 14000 16000 18000 20000
22000 Data 2011
Signal + Background fit Background fit component Signal fit component
ATLAS
= 7 TeV, 4.6 fb-1
s
| < 1.9 > 340 GeV | pT
L > 0.15
Jet Mass [GeV]
50 60 70 80 90 100 110 120 130 140
Jets / 2 GeV
0 2000 4000 6000 8000 10000 12000 14000 16000 18000
Data 2011
Signal + Background fit Background fit component Signal fit component
ATLAS
= 7 TeV, 4.6 fb-1
s
| < 1.9 > 360 GeV | pT
L > 0.15
Jet Mass [GeV]
50 60 70 80 90 100 110 120 130 140
Jets / 2 GeV
0 2000 4000 6000 8000 10000 12000
14000 Data 2011
Signal + Background fit Background fit component Signal fit component
ATLAS
= 7 TeV, 4.6 fb-1
s
| < 1.9 > 380 GeV | pT
L > 0.15
Jet Mass [GeV]
50 60 70 80 90 100 110 120 130 140
Jets / 2 GeV
0 2000 4000 6000 8000 10000 12000
Data 2011
Signal + Background fit Background fit component Signal fit component
ATLAS
= 7 TeV, 4.6 fb-1
s
| < 1.9 > 400 GeV | pT
L > 0.15
Jet Mass [GeV]
50 60 70 80 90 100 110 120 130 140
Jets / 2 GeV
0 2000 4000 6000 8000 10000
Data 2011
Signal + Background fit Background fit component Signal fit component
ATLAS
= 7 TeV, 4.6 fb-1
s
| < 1.9 > 420 GeV | pT
L > 0.15
Francesco De Lor enzi-ICHEP14 .
Data/MC comparison
• Compare data and MC in background and signal enriched samples
• Background: dijet sample
• Signal: Semileptonic ttbar events (high pT lepton/
MET OR HepTopTagged events)
0 50 100 150
Events
0 0.2 0.4 0.6 0.8
106
×
data
QCD MG+Pythia6 QCD Herwig++
QCD Pythia8 CA R=0.8
< 600 GeV 400 < pT
|<2.4 η
|
= 8 TeV, dijets s
-1, CMS Preliminary, 19.6 fb
pruned jet mass (GeV)
0 50 100 150
Data / Sim 0
1 2
dijets
ttbar
0 0.2 0.4 0.6 0.8 1
Events
0 0.2 0.4 0.6 0.8 1 1.2
106
×
data
QCD MG+Pythia6 QCD Herwig++
QCD Pythia8 CA R=0.8
< 600 GeV 400 < pT
|<2.4
|η
= 8 TeV, dijets s
-1, CMS Preliminary, 19.6 fb
τ1 2/ τ
0 0.2 0.4 0.6 0.8 1
Data / Sim 0
1 2
ttbar dijets
22
Francesco De Lor enzi-ICHEP14 .
b-jet shapes in ttbar events
• Ttbar event selection
• Jet shapes comparison: b-jet and light (W->qq)
• Sensitive to underlying event, soft gluon radiation, non-
perturbative effects.
• p
Tbins up to 150 GeV
6
100 200 300 400 500 600
(r = 0.3)Ψ1 -
0.05 0.1 0.15 0.2 0.25 0.3
jets, R = 0.6 anti-kt
| < 2.8 y
|
ATLAS
Data
PYTHIA AMBT1 PYTHIA AUET2 PYTHIA Perugia2011 Pythia 8 4C
(GeV) pT
0 100 200 300 400 500 600
Data/MC
0.60.81 1.2 1.4
0.1 0.2 0.3 0.4 0.5
(r)ρ
10-1
1
10 anti-kt jets, R = 0.6
< 40 GeV pT
30 GeV <
| < 2.8 y
|
ATLAS
Data
PYTHIA AMBT1 PYTHIA AUET2 PYTHIA Perugia2011 Pythia 8 4C
r
0 0.1 0.2 0.3 0.4 0.5 0.6
Data/MC
0.8 1 1.2
Jet Shape: parton-to-jet fragmentation process
Sensitive to underlying event, soft gluon radiation, non-perturbative effects.
(r): Integrated energy density
[Phys. Rev. D 83, 052003 (2011)]
Narrower jets at higher p T Pythia AMBT1 gives
slightly narrower jets but others describe data well.
r: distance to jet axis
Jet mass and substructure are also measured. [ATLAS-CONF-2011-073]
30 GeV < p T < 600 GeV,
|y|<2.8
compared to Pythia tunes.
(and to various MC predictions:
[ATL-PHYS-PUB-2011-010] )
(r): Fractional energy density
) (
1 r
(r) vs r
1- (r=0.3) vs p T
6
100 200 300 400 500 600
(r = 0.3)Ψ1 -
0.05 0.1 0.15
0.2 0.25 0.3
jets, R = 0.6 anti-kt
| < 2.8 y
|
ATLAS
Data
PYTHIA AMBT1 PYTHIA AUET2 PYTHIA Perugia2011 Pythia 8 4C
(GeV) pT
0 100 200 300 400 500 600
Data/MC
0.6 0.81 1.2 1.4
0.1 0.2 0.3 0.4 0.5
(r)ρ
10-1
1
10 anti-kt jets, R = 0.6
< 40 GeV pT
30 GeV <
| < 2.8 y
|
ATLAS
Data
PYTHIA AMBT1 PYTHIA AUET2 PYTHIA Perugia2011 Pythia 8 4C
r
0 0.1 0.2 0.3 0.4 0.5 0.6
Data/MC
0.8 1 1.2
Jet Shape: parton-to-jet fragmentation process
Sensitive to underlying event, soft gluon radiation, non-perturbative effects.
(r): Integrated energy density
[Phys. Rev. D 83, 052003 (2011)]
Narrower jets at higher p T Pythia AMBT1 gives
slightly narrower jets but others describe data well.
r: distance to jet axis
Jet mass and substructure are also measured. [ATLAS-CONF-2011-073]
30 GeV < p T < 600 GeV,
|y|<2.8
compared to Pythia tunes.
(and to various MC predictions:
[ATL-PHYS-PUB-2011-010] )
(r): Fractional energy density
) (
1 r
(r) vs r
1- (r=0.3) vs p T
< ⇢(r) >= 1
R · N
jetsX
jets
p
T(r r/2, r + r/2) p
T(0, R)
< (r) > 1 N jets
X
jets
p T (0, r ) p T (0, R)
ρ(r): Fractional energy density
Ψ(r): Integrated energy density
Eur. Phys. J. C (2013) 73:2676
23