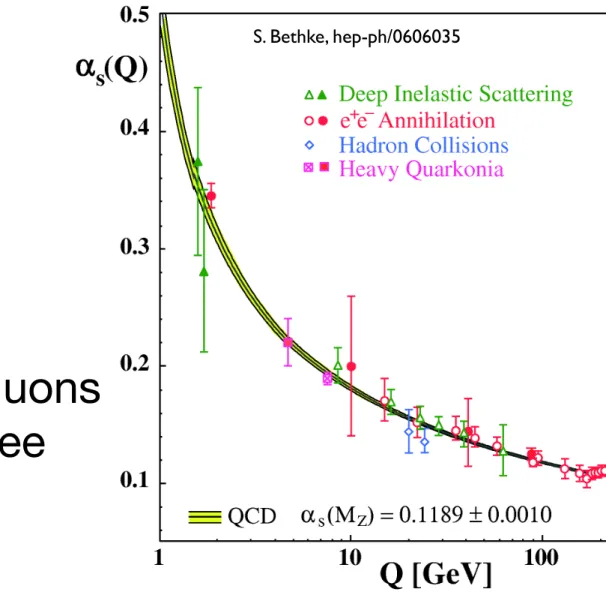
Finally, in the last two columns of Table 1, the underlying theoretical calculation for each measurement and a reference to this result are given, where NLO stands for next-to-leading order, NNLO for next-to-leading order of perturbation theory, "summary" stands for summary NLO calculations, which include NLO plus retaking all leading and next-leading logarithms to all orders (see [39] and [32]), and "LGT" denotes lattice gauge theory. Open symbols indicate (resumed) NLO, and filled symbols NNLO QCD calculations used in the respective analysis. In Figure 17, all results of αs(Q) given in Table 1 are shown graphically as a function of the energy scale Q.
At lower scales, the coupling constant becomes Large Quark and gluons remain confined to hadrons. This suggests that between the quark and the antiquark there is a linear energy density (called string tension) of order. The string is formed by the chromoelectric field responsible for the configuration of the flux tube and for the quark confinement (see Fig. 4), Buchm¨uller (1982).
After solving task 2.1, the reader can check whether the relation can be established. This measurement of the non-zero string tension from the region of strong coupling to the region of the asymptotic scale, without any sign of a phase transition in the intermediate region, provided the first evidence of quark confinement in QCD.
Rapid cross over transition
Glauber Theory
A.Wiedemann Npart= 7
- Glauber theory for n+A
A. S ALGADO
- Event Multiplicity in wounded nucleon model
- Why is the study of v n interesting?
- LHC and RHIC Data on Elliptic Flow: v 2
Assumption: Inelastic collisions of two nuclei (A-B) can be described by an incoherent superposition of "an equivalent number of nucleon-nucleon collisions" collisions. An illustrated example of the correlation of the observable total inclusive mass of charged particles Nch of the final state with the Glauber calculated quantities (b,Npart). Once the total integral of the distribution is known, centrality classes are defined by grouping the distribution based on the proportion of the total integral.
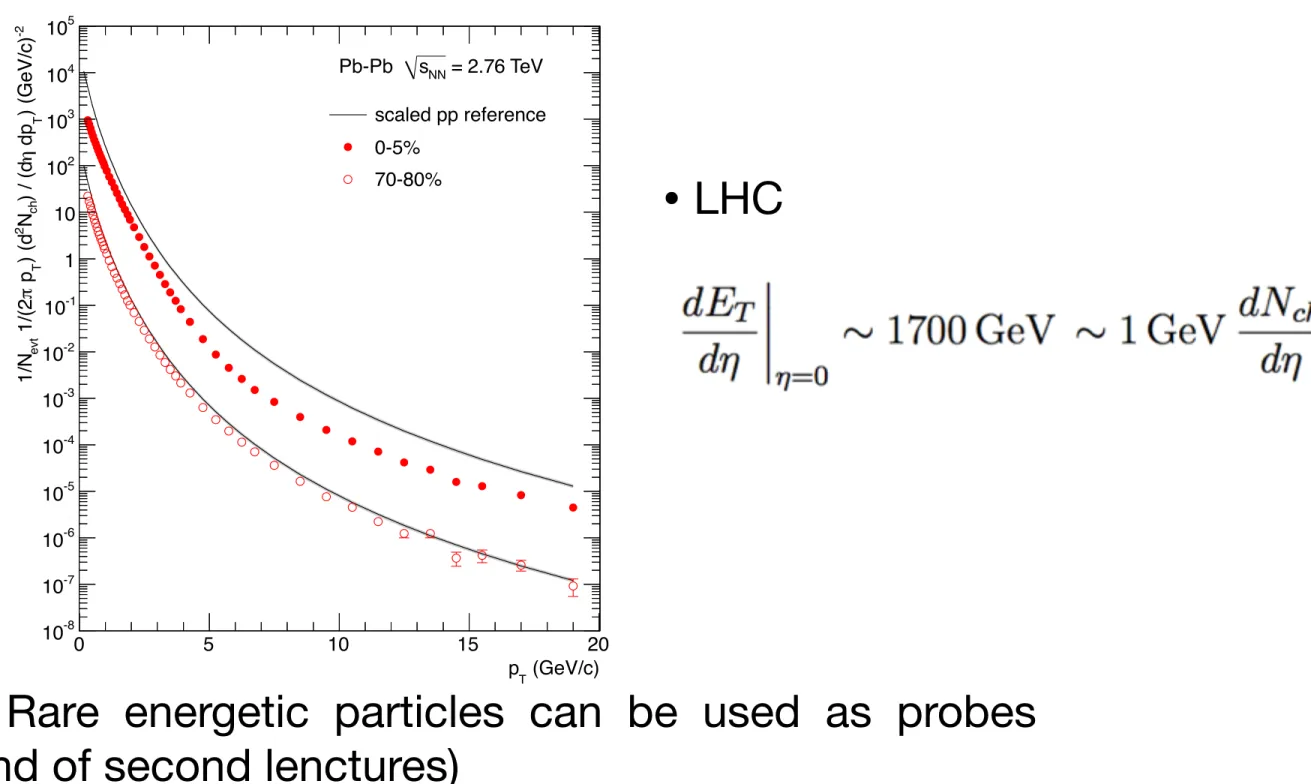
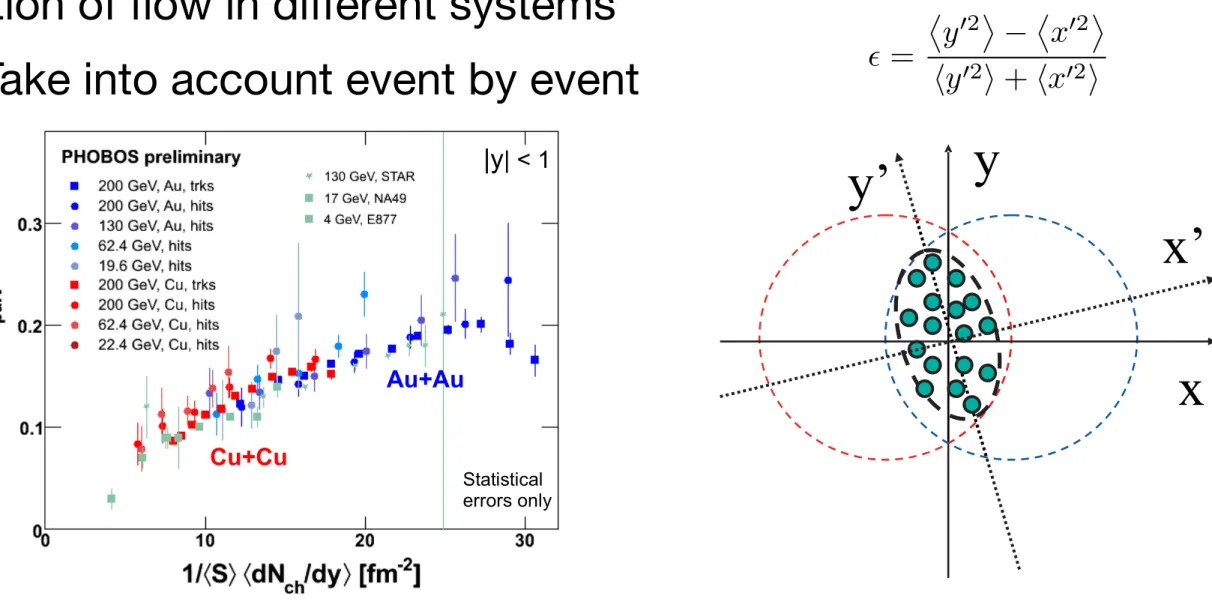
Most particles have moments in the soft sector; hard particles are rare in comparison. We now turn to the analogue of the (earliest) cosmological epoch of nucleosynthesis, namely the time at which the composition of the final hadron state. As a consequence, the center of the overlap zone can be shifted and the orientation of the principal axes of the interaction zone can be rotated with respect to the conventional coordinate system.
In this section, a brief description of the theory and phenomenological models used in comparison with the measurements will be given. Hydrodynamics is a macroscopic approach to describe the dynamic evolution of the expansion phase of a heavy ion collision. The interpretation of elliptical flow measurements in heavy ion collisions relies on the observation that v2 is related to the initial spatial eccentricity. of the region of the transverse overlap of the two shells [1].
In relation to this interpretation, the observation of very large v2 signals [5-7] is undoubtedly one of the most extensive discoveries of the RHIC heavy ion program. To estimate the signal strength of the elliptic flow v2, we now discuss the initial spatial eccentricity. More precisely, in a nucleus-nucleus collision, dNch/dy scales approximately with the average number N of participating nucleons, which scales with the surface area of the nuclear overlap.
Therefore, selecting a multiplicity class in A-A amounts to selecting an impact parameter and determines the shape of the nuclear overlap region. For large Npart, it is reasonable to make a smoothness assumption that the interactions between the Npart nucleons result in a homogeneous density distribution within the region of nuclear overlap (for illustration, see the right side of Figure 1). Previous estimates of the magnitude of v2 were based on this smoothness assumption [19, 20] or on other methods [21] and reported small, non-measurable values.
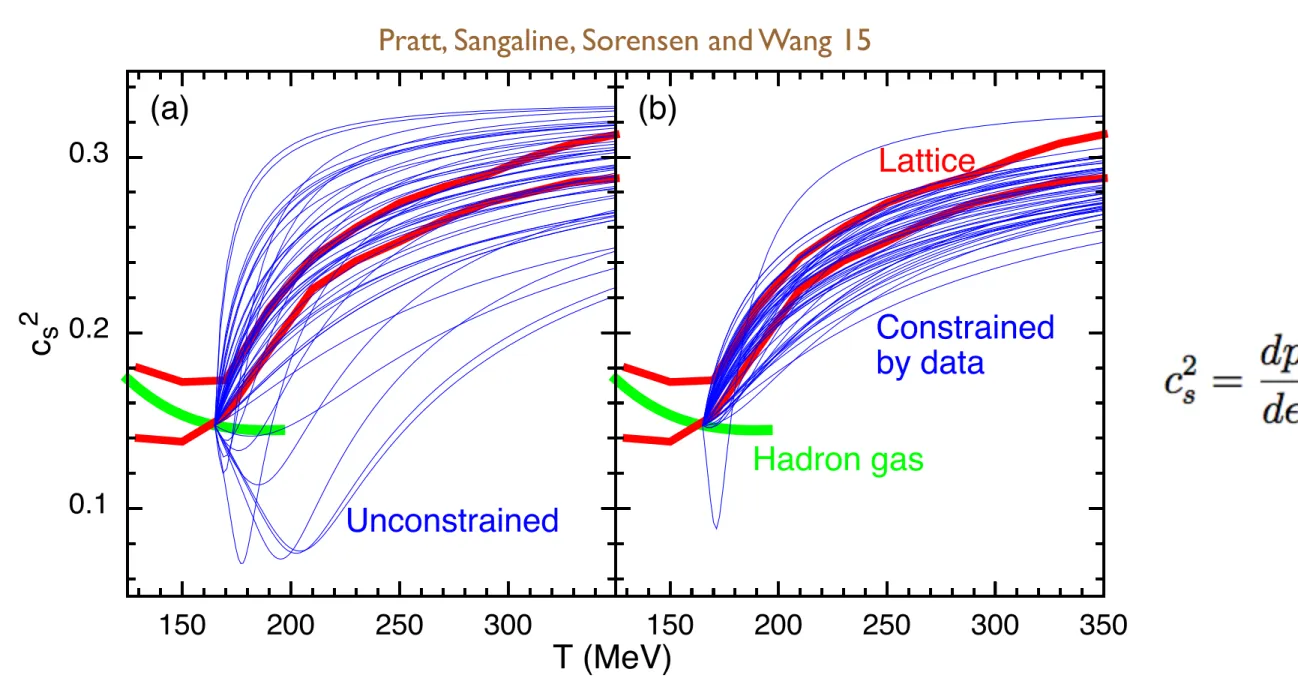
In these systems, the relatively small number of nucleon-nucleon interactions results in event-by-event fluctuations of the density distribution. For each case, the speed of sound is plotted as a function of temperature in fig.

Global fit to several sets of data
Hor = R 2
In this case the horizon would have been 8-dimensional, of the form A8 = A3 ⇥ S5, and the entropy would have taken the form. Once the entropy density is known, the rest of the thermodynamic potential is obtained by standard thermodynamic relations. This entropy should be identified as the entropy of the gauge theory plasma in the strong-coupling limit [391].
These explicit calculations strongly suggest that the thermodynamic capabilities of non-Abelian gauge theory plasmas (at least for near-conformal plasmas) are quite insensitive to the specific value of the gauge coupling. The dotted curves indicate the location of the energy flux maxima, as shown in Figure. Hydrodynamics becomes applicable even earlier than tmax, and the region where it applies extends from z = 0 to the location of the receding maxima.
While the negative E only develops away from the center of the collision, the negative PL is already present at z = 0, as shown more clearly in the lower left plot of Fig. Streamlines in the momentum density plots indicate the direction of the momentum density. After the collision, the remnants of the initial shocks, which remain close to the light cone z = ±t, are significantly damped in amplitude with the extracted energy deposited inside the light cone.
Outside, the = 0.2 surface increases rapidly, indicating the presence of nonhydrodynamic modes on the surface of the droplet. In contrast, for the o↵-center collision, the = 0.2 surface is elliptical in the x y plane, with the short axis of the ellipse oriented in the same direction as the impact parameter b = 3ˆx. Nevertheless, for both collisions the transverse radius of the = 0.2 surface is more or less the same and equal to R ⇠ 3, which is just the radius of our "protons".
In contrast, the surface of the droplet for the o↵ center collision is elliptical in the x y plane, with the short axis of the ellipse oriented in the same direction as the impact parameter b = 3ˆ x. Nevertheless, the transverse radius of the droplet for both collisions is roughly the same and equal to R ⇠ 3, which is just the radius of our "protons" used in (1.3). From the figure, it is clear that the average value of the temperature inside the droplet is T e↵ ⇠ 0.25 for both collisions.
In the interior of the drop ||T (2) µ⌫ || is almost an order of magnitude smaller than ||T (1) µ⌫ || for both influence parameters, which means that the second-order gradient corrections are negligible. The goal was to calculate medium-induced gluon radiation amplitudes of the type shown in Fig.


![Figure 2.6 a) Chemical potential extracted from thermal fits at di↵erent center of mass energies [56]](https://thumb-us.123doks.com/thumbv2/123dok_es/12438239.0/24.1536.324.1100.343.906/figure-chemical-potential-extracted-thermal-erent-center-energies.webp)