Precipitation along the coast of Peru during strong El Niño events (Article published in the International Journal of Climatology). SST evolution in the Niño1+2 region during the fourth strong El Niño event.
Introduction
INTRODUCTION
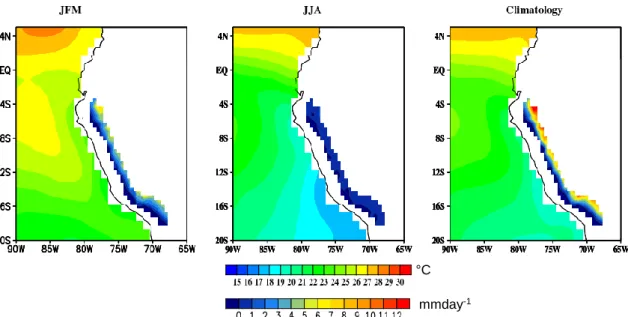
- MEAN SEASONAL CLIMATE CONDITIONS IN THE PERUVIAN PACIFIC BASIN
- HYDROLOGY IN THE PERUVIAN PACIFIC BASIN
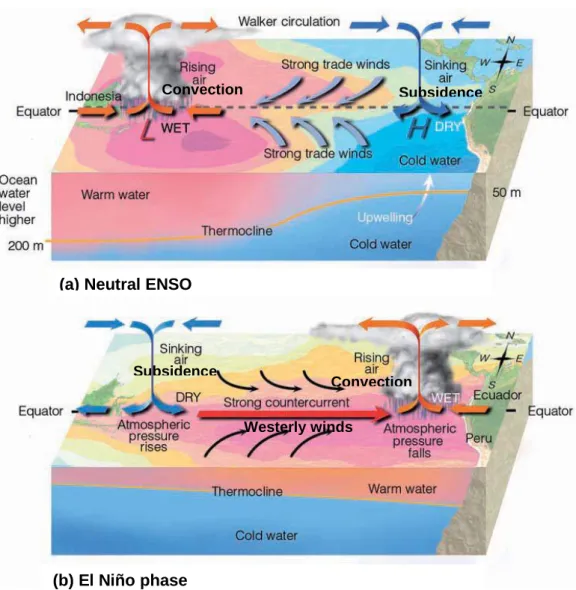
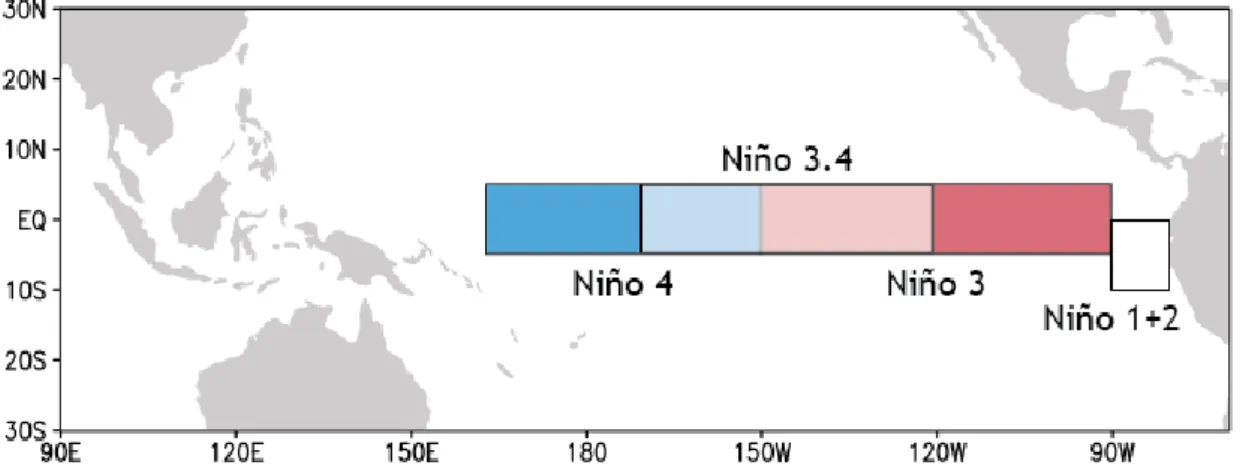
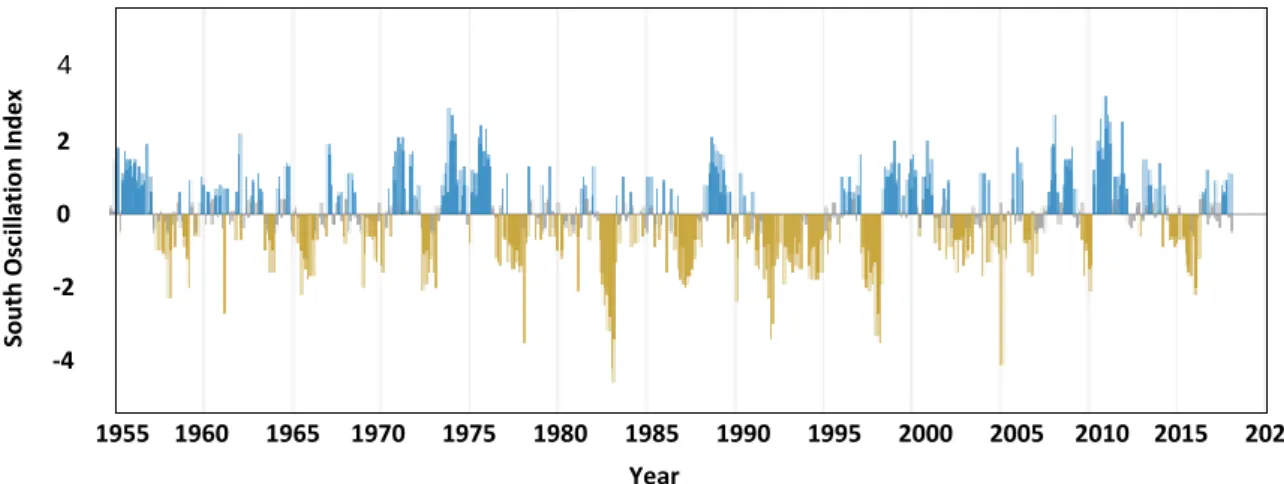
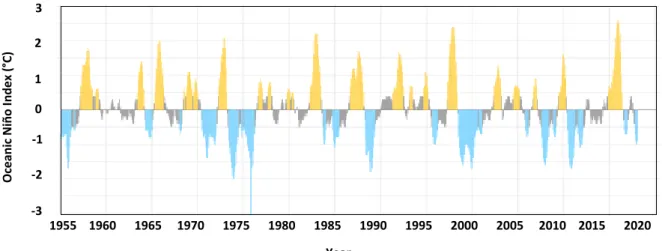
- ENSO
- ENSO INDICES
- MECHANISMS TRIGGERING RAINFALL EVENTS DURING EXTREME EL NIÑO EVENTS
- OBJECTIVES
- SPECIFIC OBJECTIVES Specific objectives are
Precipitation anomalies are associated with the Eastern Pacific (EP) and Central Pacific (CP) El Niño. EP El Niño (top) shows rainfall extending to the coast of South America, while CP El Niño (bottom) shows rainfall limited to the central Pacific.
Introduction
Version française)
OBJECTIFS
- LES OBJECTIFS SPECIFIQUES Les objectifs spécifiques sont
Documentez le transport de l'humidité dans les produits de réanalyse les plus complets au cours des trois derniers événements El Niño forts et fournissez une compréhension des mécanismes des événements de précipitations dans le PPB. Nous émettons l'hypothèse que les précipitations dans le PPB pourraient connaître des tendances déphasées lors d'événements El Niño similaires tels que mesurés par El Niño 3.4.
Rainfall along the coast of Peru during strong El Niño events
Chapter 3: Comparison of rainfall reanalysis data to develop atmospheric scenarios during
- REANALYSIS
- ATMOSPHERIC REANALYSIS
- ECMWF reanalysis
- NASA GMAO reanalysis
- NOAA/NCEP and related reanalysis
- Reanalysis rainfall over the Peruvian Pacific Basin (PPB)
A full-data reanalysis of satellite dates incorporating some corrections and modifications to the system used for ERA-40 (Uppala et al., 2005). The correct representation of the hydrological cycle by ERA-Interim assumes an increase in forecast quality compared to the previous ERA reanalysis (Trenberth et al., 2011). JRA-25 (Onogi et al., 2007) is a reanalysis with full satellite ERA data and the first reanalysis produced by JMA.
MERRA (Rienecker et al., 2011) is a full-input reanalysis of the satellite ERA developed by the American Space Agency NASA's GMAO using the GEOS-5 data assimilation system. MERRA-2 (Bosilovich et al., 2015) is a full-input reanalysis of the ERA satellite from NASA's GMAO. The Climate Forecast System Reanalysis (CFSR) (Saha et al., 2010) is a full-input reanalysis by the satellite ERA that uses a 2007 version of the NCEP CFS.
In South America, this third-generation reanalysis showed improved performance of precipitation variability during the austral summer (Albuquerque de Almeida et al., 2018).

Rainfall during the strong El Niño events from Reanalysis ERA- Interim, CFSR and JRA-55 in the Pacific Peruvian basin (manuscript
Data and Methodology
- Dataset
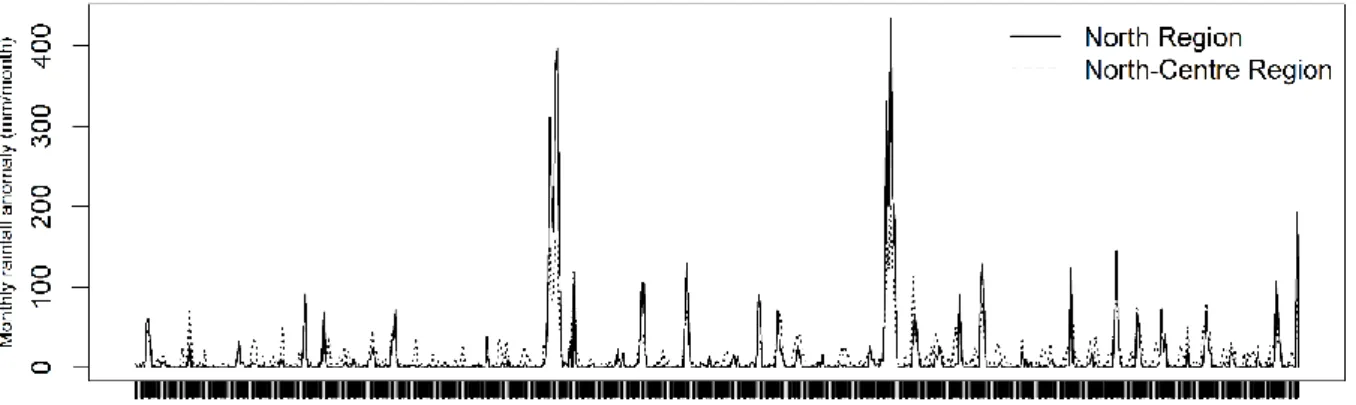
- Observed rainfall Dataset
- Methodology
- EOF rainfall analysis
- Statistic indices
- Statistical analysis and climatology
- Major patterns of the rainfall variability – ENSO
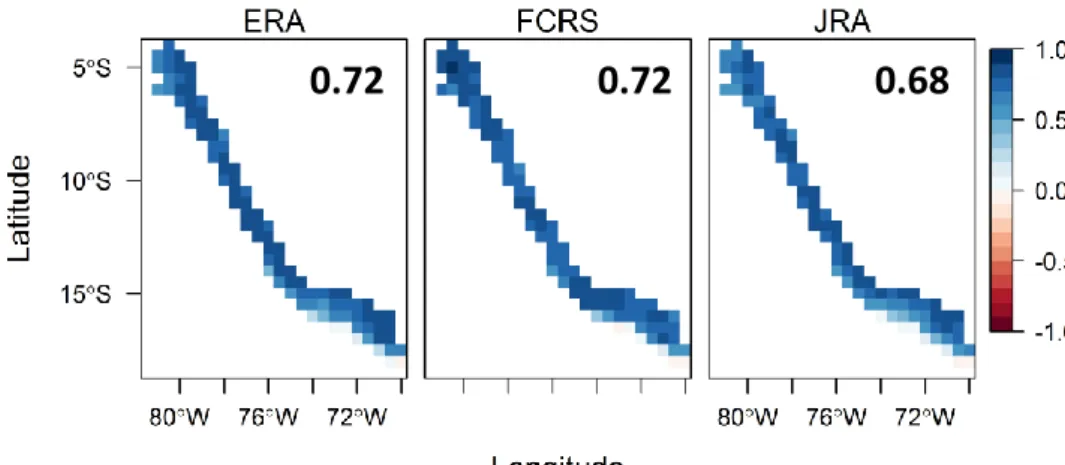
The rotated EOF methodology to determine the predominant precipitation patterns that characterize the observed precipitation variability (Sanabria et al., 2018) is used in the precipitation from the reanalysis. The temporal evolution of the events is over the time period covering the El Niño episode (i.e. two years). The Cp mode (the second mode) contains a zonal saw (from west to east) and is also described closely to the observed precipitation, but with a slight overestimation of the precipitation on the north-central coast of the PPB.
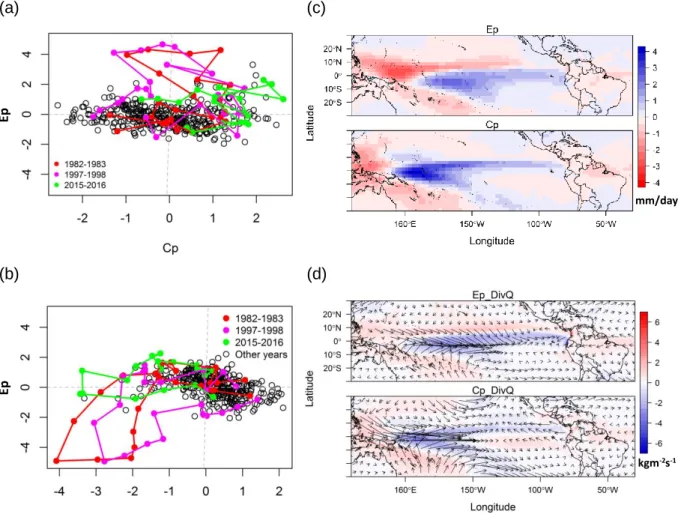
However, the characteristic strong load signal in the northern PPB of the Ep mode is captured by the three reanalyses. The three reanalyses can relatively represent the phase space tendency of the Ep and Cp modes. The differences in the evolution of Ep and Cp mode projected events can be visually highlighted in Figure 6, which illustrates the evolution of Ep and Cp indices during strong El Niño events from reanalysis and observed precipitation.
However, these reanalyses do not reproduce the evolution of these events that fall within the deviation of the moderate El Niño events, due to their projection on the Ep mode.
Large scale and local atmospheric factors that controls the rainfall variability along
- STRONG EL NIÑO EVENTS WITH REGARD TO THE TRANSPORT OF MOISTURE AND ATMOSPHERIC FACTORS
- MOISTURE TRANSPORT AND ITS CONVERGENCE
- Approaches of the moisture transport and its convergence
- RAINFALL AND MOISTURE PATTERNS ASSOCIATED WITH STRONG EL NIÑO EVENTS IN THE EASTERN PACIFIC REGION
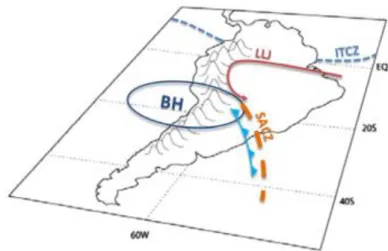
The ITCZ is one of the main meteorological structures of planetary scale that transports moisture (Gimeno et al., 2012; Knippertz et al., 2013) from the ocean to the continent. Different are the responses of atmospheric circulation anomalies (i.e. position and longitudinal extension of the Walker circulation) to these two regimes (Kug et al., 2009;. In the EP (CP) Niño is linked to southward displacement (a dominant position in the central-eastern Pacific) of the Pacific ITCZ (InterTropical Convergence Zone) associated with rising motion over the Pacific and subsidence over tropical South America (east of 60 °W) which is stronger in EP as CP El Niño (Tedeshi et al., 2013; Andreoli et al., 2016; Sulca et al., 2017).
The transport of moisture from oceanic sources to the continents is the link between evaporation from the ocean and precipitation over the continents (Gimeno et al., 2014) (see Figure 4.3). Increases in specific humidity (𝑞) and horizontal transport of moisture (𝑸) are associated with the heaviest daily precipitation events (Allan et al., 2016). Locations where specific moisture anomalies are significant generally coincide with the areas of strong moisture transport (Dacre et al., 2014).
ERA-Interim precipitation is a model-generated variable (Dee et al., 2011), therefore, a field-coherent representation of moisture flux is expected from the model.
Rainfall and moisture patterns associated with strong El Niño events in the eastern Pacific region
Introduction
In the highlands along the Andes, the variability of precipitation (drier and wetter conditions) does not seem to be related only to remote El Niño (Niño 3.4) and may have been influenced by other influences (Sanabria et al., 2018) such as e.g. as moisture from the Amazon basin. During the El Niño mature phase, extreme precipitation in the EPB is associated with increased atmospheric convection due to transport of moisture and intensification of convergence towards the eastern Pacific (Castillo et al., 2014; Knippertz et al., 2013). El Niño can be characterized in two regimes: East Pacific (EP) and Central Pacific (CP) ENSO (Kao & Yu, 2009; Takahashi et al., 2011; Capotondi et al., 2015), as characterized by peaks of SST anomalies in the eastern and central Pacific.
In Ecuador and northern Peru, the transport of water vapor and the local topography of the Andes feeds the production of precipitation from the Ocean to the continent (Gimeno et al., 2016; Pineda et al., 2013). Pineda et al., 2013 and Gimeno et al., 2016 suggest that water vapor and the local topography of the Andes lead to the formation of heavy rainfall events in the coastal region. Westerly low-level moisture flux crosses the coastal zone leading to orographic convection (Takahashi et al., 2004).
Our approach takes into account that observed precipitation and atmospheric water balance (convergence of vertically integrated moisture flux) are comparable (Paixao Veiga et al., 2005).
Data and methodology
- Precipitation
- Reanalysis
- Moisture transport
- Composite analysis
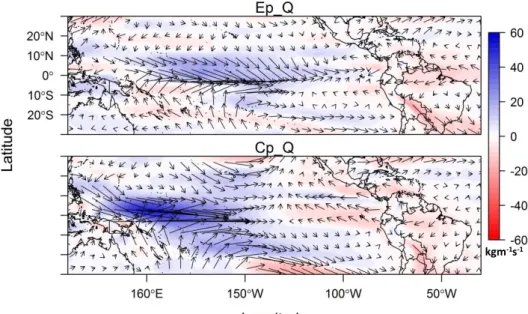
Including how changes in the regional and large-scale atmospheric circulation affect these precipitation patterns. The adequate reproduction of the hydrological cycle by ERA-Interim assumes an increase in forecast quality compared to previous ERA reanalysis (Trenberth et al., 2011). To investigate the influence of atmospheric moisture transport on the precipitation, the metric of the vertically integrated water vapor transport (𝑄) and its 𝑄 convergence (−𝛁. 𝐐) derived from the ECMWF-ERA-Interim reanalysis was used.
And 𝑤 is the precipitable water (the total water vapor in the column) whose temporal trend is often assumed to be negligible over a relatively long period (e.g. Sohn et al., 2004; Trenberth et al., 2011). These indices represent the variability of EP and CP El Niño, respectively, defined by Takahashi et al. The nonlinearity of strong El Niño events and 2016) on rainfall in the EPB is considered in the composition of rainfall, 𝑄 convergence (− 𝛁. 𝐐) and the vertical structure of q, vertical motion (𝜔) and wind.
The 𝑄 convergence variability allows to investigate the changes in atmospheric path of the hydrological cycle.
Results
Interestingly, the 2016 event unlike El Niño exhibits a significant 𝑄 convergence in the Amazon that extends over the Andes. In 2016, a moderate 𝑄 divergence in the Pacific Ocean (Fig 2b) is associated with downward motions such as suppression of dry air convection at low levels (Fig 3a). In the first two events, the presence (or absence) of the upper-level depression of southerly (or northerly) winds causes a strengthening (or weakening) of the subsidence that allows a lower (larger) flux q into the EPB, as in El Niño. 1983 (and 1998) (Fig. 4a).
However, we have shown strong differences in moisture transport and its relationship to different rainfall patterns in the EPB. The complexity of El Niño events associated with rainfall in the EPB requires consideration and understanding of other factors such as the interaction of the quasi-biennial oscillation (QBO) and Hadley-like circulation (Salby and Callaghan, 2007), which seems well described. during changes in wind at higher levels (100 to 300 hPa). Precipitation and moisture patterns associated with strong El Niño events in the eastern Pacific region.
The role of moisture in the Amazon basin in the atmospheric branch of the hydrological cycle: a Lagrangian analysis.
Conclusions and Perspectives
- CONCLUSIONS
All strong El Niño events are associated with positive precipitation anomalies over northern Peru, which is accounted for by the Ep mode associated with strong (weak) moisture transport from the Pacific during extreme (moderate) El Niño events. While in moderate events, in particular El Niño unlike extreme El Niño events, it is associated with moisture transport from the Amazon reaching the highlands. This illustrates the interaction of large-scale (i.e. subsidence) and regional (i.e. upper-level wind) mechanisms in large-scale moisture transport in determining the different precipitation patterns during these El Niño events.
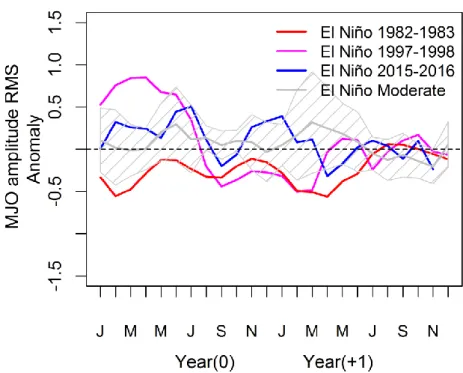
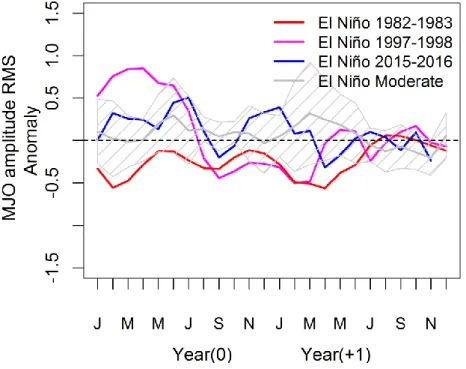
Despite this reanalysis, they agree well with the different projections on the modes and indicate that the strong El Niño events are the result of two modes, but there are still shortcomings in the exact reproduction of the peak magnitude. In addition, the thesis provides guidelines to understand the role of moisture transport and of large-scale and regional atmospheric circulation in two different rainfall patterns, which have implications for the prediction of PPB rainfall during the strong El Niño events. We analyzed the evolution of the MJO during three of the four strong El Niño events (Figure S3).
However, local SST anomalies are probably not the only factor influencing precipitation conditions during strong El Niño events (Takahashi and Martinez, 2017).
- PERSPECTIVES
Complex network analysis helps identify the impact of the El Niño Southern Oscillation on moisture divergence in South America. Extreme swings of the South Pacific Convergence Zone and the different types of El Niño events. Heat and moisture budgets of the walker circulation and associated rainfall anomalies during El Niño events.
Variations in the three-dimensional structure of the atmospheric circulation with different flavors of El Niño.