Document downloaded from the institutional repository of Instituto Andaluz del Patrimonio Histórico: https://repositorio.iaph.es/
This is the peer reviewed version of the following article*:
María Auxiliadora Gómez-Morón, Rocío Ortiz, Francesco Colao, Roberta Fantoni, José Luis Gómez-Villa, Javier Becerra, Pilar Ortiz. Monitoring the restoration of a seventeenth- century wooden artwork using means of laser-induced fluorescence and digital image analysis. En:
Applied Spectroscopy. 2020
Which has been published in final form at
Available at https://doi.org/10.1177/0003702820944505
This article may be used for non-commercial purposes in accordance with SageTerms and Conditions for Use of Self-Archived Versions.
Copyright © 2020. Sage
This work is licensed under an
Attribution-NonCommercial-ShareAlike 3.0 Not cover (CC BY-NC-SA 3.0) 3.0 International License
https://creativecommons.org/licenses/by-nc-sa/3.0/deed.es
1
Monitoring the restoration of a XVII century wooden artwork using Laser Induced Fluorescence and Digital Image Analysis
María Auxiliadora Gómez-Moróna, Rocío Ortizb, Francesco Colaoc, Roberta Fantonic, José Luis Gómez-Villaa, Javier Becerrab*, Pilar Ortizb
aInstituto Andaluz del Patrimonio Histórico (IAPH), Sevilla, Spain
bDepartamento de Sistemas Físicos, Químicos y Naturales, Universidad Pablo de Olavide, Sevilla, Spain
cApplied Physics Division of Department for nuclear Fusion and Security, ENEA, Frascati, Italy
*corresponding author: [email protected]
Abstract: The present paper is aimed at demonstration the capabilities of digital image analysis to support conservation of painted artwork. Laser Induced Fluorescence (LIF) imaging has been usually used in the diagnosis of wall paintings. In this case, LIF is applied to the case study of a painted wooden canopy and most successful data processing techniques are presented in the discussion of results.
The Jesús del Gran Poder canopy, completed by Francisco Ruiz Gijón in 1692, is an oil panel painting on wood. Eight panels of the canopy have been study by LIF. This technique is capable of remotely acquiring hyperspectral images operating in fluorescence mode following ultraviolet laser excitation.
LIF spectra combined with Principal Component Analysis (PCA), Spectral Angle Mapper (SAM) and Digital Image Analysis (DIA) provide a chemical mapping of the treated wooden surface of the panels. Besides, LIF spectrum is as a fingerprint of the panels that allows stablishing differences between them. LIF imaging analysis has
2
proven to be a very useful tool for mapping retouching work, tracking previous restorations and detecting chemicals on the wood in order to monitor restorations.
Keywords: LIF; PCA; SAM; imaging; painted wood; consolidants.
Introduction
The study and conservation of artworks by means of high-tech techniques are now widely practiced. Over time, a large number of analytical techniques became
increasingly available and were applied to carry out scientific research on artworks and historical objects.1–3 Optical techniques are undoubtedly the preferred ones because they are non-contact and non-destructive,4 not requiring sampling for laboratory analysis which, for artworks of great value, may not be allowed or limited to small portions.
Optical technologies provide easy and safe access to observe the various components of a painting,5 even if that the study of artworks presents very peculiar problems, dealing with altered multimaterial objects subject to aging and too often undocumented restorations.
With the development of high-resolution image sensors suitable to operation in very broad spectral range from ultraviolet to near infrared, great opportunities opened for non-invasive diagnostics on Cultural Heritage. Conservation of painted artwork requires space resolved data on original materials and additives utilized in former restoration. The large amount of reflectance and fluorescence data, eventually collected as images at high spectral or time resolution, needs appropriate processing to become a useful tool to assist conservators either to catalogue the artefact or to proceed with a new restoration intervention. Detection of emitted fluorescence allows for the identification of substances capable of being excited by UV radiation; indeed, the
3
experimental technique adopted was proven to detect the occurrence of superficial contamination and to identify extraneous materials on the surface: biodeterioration, pollutant, waxes, some kinds of biological attack from microalgae and fungi, the presence of superficial contaminants, pigments and consolidants.6–9 Past researches already highlighted the capabilities of Laser Induced Fluorescence (LIF) as a non- destructive diagnostic tool on painted surfaces different for the considered wooden substrate.10,11
The capabilities of digital processing algorithms for reflectance and fluorescence images remotely collected on large wall painted (mostly a fresco) has been recently demonstrated 12,13 extracting significant information on both original materials (pigments binders) and former consolidants. Analogous results extended to the near infrared (IR) range were obtained for oil paints on canvas.14 The construction of a consolidants’ data base to process spectrally resolved fluorescence digital images has also been started on ancient and modern substrates.15 The processed images offer possibilities for digital archiving data suitable to interactive fruition in web platforms and perspective of restorers’ assistance through augmented reality projection devices.
The Jesus del Gran Poder canopy is a movable altarpiece that was built between 1688 and 1692. Since this date, it has been used to transport the Christ sculpture through the Sevillian streets during the Easter procession. This artwork was carved from
Meliaceae Cedrela sp wood and resembling an inverted basket. On the surface, the piece is covered with gold leaf, featuring carved polychrome relief work.
The brotherhood of Jesús del Gran Poder commissioned Francisco Ruiz Gijón to make the canopy which still retains its original appearance. Francisco Ruíz Gijón was a well-known baroque Spanish sculptor, who blended the classicism of the Sevillian school with the classic Italian baroque movement. He specialized in polychrome
4
wooden artworks and was deemed to be the finest creator of baroque canopies. More than a hundred canopies have been hand crafted according to this design since the 17th Century and right into the present day.16
As previously mentioned, up to now most application of spectrally resolved LIF were concentrated on large wall painted surfaces,12,13,17 here we focus our attention on the 8 panels carved as polychrome reliefs of the Jesús del Gran Poder canopy as example of application of LIF technique and of algorithms of digital image processing to solve specific conservation questions in painted wooden artworks.
Methodology and materials
LIF set-up
An LIF scanning instrument capable of acquiring hyperspectral fluorescence images on large areas has been designed and patented at the ENEA UTAPRAD-DIM.18 The purpose of this system is to detect the fluorescence signature of samples from a remote station.19,20
The experimental arrangement used for the current experiment is schematically represented in Figure 1. The main components of the set-up are a laser excitation source, a laser beam steering system, the optical receiver, an imaging spectrometer and an optical sensor. The source for the excitation of the fluorescence, is a pulsed Nd:YAG laser equipped with active Q-switch and a SHG and THG crystals; it emits 0.9 mJ/pulse at 266 nm and 20 Hz pulse repetition rate (mod. DIVA, Thales sas). The laser beam is directed by the mirrors M1, M2 and M3, and sent towards the target through a
cylindrical lens L1 which effects the formation of the laser beam in the shape of a line.
5
The laser pulse energy has been adjusted to have a fluence below the damage limit: the energy delivered per unit area at target at 3m distance was < 0.002 mJ/cm2. In a former work on decorated wood it has been verified that this level of laser fluence is well below the threshold damage for the considered target surface.21 The emitted fluorescence is collected by an objective suitable for working in the ultraviolet (70mm, f#2.4-22 UV grade), and focused on the input slit of a 140mm focal length imaging spectrometer (Horiba CP-140). The spectrometer carries out the dispersion along the horizontal axis (from 200 nm to 850 nm and a spectral resolution of 5nm), while preserving the spatial information along the vertical axis, this allows to obtain the spectrum for each pixel that makes up the entire horizontal row. Optical detection is performed by an iCCD sensor (Andor DH734-18F) which has the advantage of being able to temporally discriminate the emission induced by the laser by means of an appropriate time gating system. The scanning of the object under study is finally carried out by rotating the entire transmitter and receiver system around a horizontal axis.
<Insert Figure 1 here>
Fluorescence scan were obtained by synchronizing the detector intensifier in coincidence with the light emitted by the laser and 100 ns gate width; then the system is run for one more scan with gate opening of 100 ms while keeping the laser off. This second scan aims to measure the reflectance and it is acquired in low-resolution mode, for the only purpose of better identify the area under scan.
The optical detection system was spectrally calibrated and corrected for the detector spectral response, radiometric absolute calibration was not performed. Table I reports the experimental conditions used for the present experimental work.
6
Table I – System components used for the LIF experiment
Component Parameter Manufacturer
Laser Diode pumped 100 A Energy per pulse 0.9 mJ Divergence < 1mrad
Emission wavelength 266nm Pulse rep rate 20 Hz
DIVA, Thales Optronique
Objective 70mm focal, UV grade f# 5.6
FOV 8 deg Spectrometer Focal 140 mm
Slit width 0.1 mm Dispersion 60 nm/mm
Spectral range 250nm 850nm
Horiba CP-140
Detector Model iStar DH734-18F
Sensor 1024x1024 pixels, 13um Binning 4x
Gate width 100ns
Andor
Rotary actuator 0.5 mrad/step Spatial accuracy Vertical 1mm
Horizontal 0.5 mm Scanning system Distance to target 3m
Image acquisition time < 10min/multiband image
7
Data acquisition 128 spectral bands per pixel @ 20 bit effective resolution
Approx. 30-50 MBi/scan
Wooden samples
The samples studied were the eight carved and painted wooden relief panels from the canopy belonging to the Gran Poder brotherhood. Each panel carved double and single scenes about the passion of Christ and other Christian stories from the Old and New Testaments, delivering an evangelical message about God’s presence on Earth and his sacrifice for humanity (Figure 2). In fact, the single reliefs depict the episodes from the Old Testament and are located at the corners of the canopy; the doubles panels, located in the middle of each side of the canopy, represent the passion of Christ, with the exception of the panel showing the return of the Prodigal Son.
<Insert Figure 2 here>
These panels made by Ruiz Gijón between in 1688-1692 were restored in 1853 according to IAPH reports.22,23
Panels C, D and F (Figure 2) were subjected to the diagnostic investigation by means of the LIF system to obtain the spatially resolved emission from the entire panels; the analyses were conducted before and after restoration in order to compare the spectral data and to identify the treated areas and recognize the materials used, possibly obtaining evidence of previous conservation interventions. Panels A, B, E, G and H were only scanned after restoration because the measure before restoration was made in situ in the brotherhood’ storehouse and the available space between the canopy and walls only allowed us to use the equipment in the front of the canopy.
8
Data analysis
Data collected by LIF technique are acquired as groups of monochromatic narrowband spectral images, each one centred on the wavelength corresponding to the nominal position of the spectrometer exit plane. Usually the rendering of the spectral data is in grayscale at a single band; in this work we also use a false colour render which has richer details; it consists in building a colour image by combining up to three
monochrome scan encoding each one of them as a single Red, Green, and Blue (RGB) channel.
Because of the huge amount of data for each scan, multivariate analysis is applied to reduce data set dimensions and extracting effective information based on variance analysis.24,25 In this study, Principal Component Analysis (PCA) was used,24 and additionally the Spectral Angle Mapper (SAM) projection algorithm was utilized to locate the spatial position of some selected spectral features on the painted surface.26
The most prominent spectral features are first identified by Principal Component (PC) analysis. In spite of the fact that PC loadings do not possess any direct physical meaning, they can nevertheless be described in terms of bands. Indeed, in most cases a given PC loading has well defined spectroscopic bands with associated peaks, while in other cases more complicated trends and shapes are observed. A few PCs are usually retained for subsequent analysis; typically, 5 to 8 components are enough to describe the entire spectral data set. It is also worth noting the possibility of building suitable linear combinations of the computed PCs to achieve a faithful representation of each pixel spectra.
The identification of areas possessing a specific spectral content is accomplished by Spectral Angle Mapper (SAM) projection algorithm in conjunction with an available database containing spectral signatures of selected constituent of the painted surface.
9
The SAM algorithm, described by Girouard et al.,26 calculates the spectral angle
between a reference spectrum (endpoint) and the spectrum of each point in the analysed image. Then, a similarity map is produced, representing in grey level scale the cosine of the obtained angle.
The SAM mapper algorithm implemented in this work performed well with a low computational cost, while still retaining good performances in terms of spectral feature identification. More complex approaches, based on spectral deconvolution, were not necessary; indeed, the SAM mapper allowed for an easy and fast location of
prominent spectral features.
Results and Discussion
LIF and PCA studies before and after restoration on panels C, D and F
For the purpose of band identification, a PCA was run on the LIF scans of the wooden panels C, D and F before and after restoration. The spectral loadings are shown in Figure 3. The first five principal components were considered; they describe the spectral dataset explaining more than 85% of the data variance.
<Insert Figure 3 here>
The PC loadings were used to identify the most significant emission and the candidates for LIF peaks in panels C, D and F. It is worth notice that different PC in the same plot are uncorrelated by construction, while it is possible to observe a relative strong correlation between the same ordinal position PC of the data acquired before the restoration and a milder correlation when compared the same ordinal PC acquired after the restoration process. This experimental finding is consistent with the fact that the state and the constituents of different panels is similar among them, also evidencing an
10
almost homogeneous conservation condition. On the other hand, after the restoration we observe much stronger emission in the UV region between 280 nm and 390 nm, which is ascribed to superficial varnish layer used in the restoration.
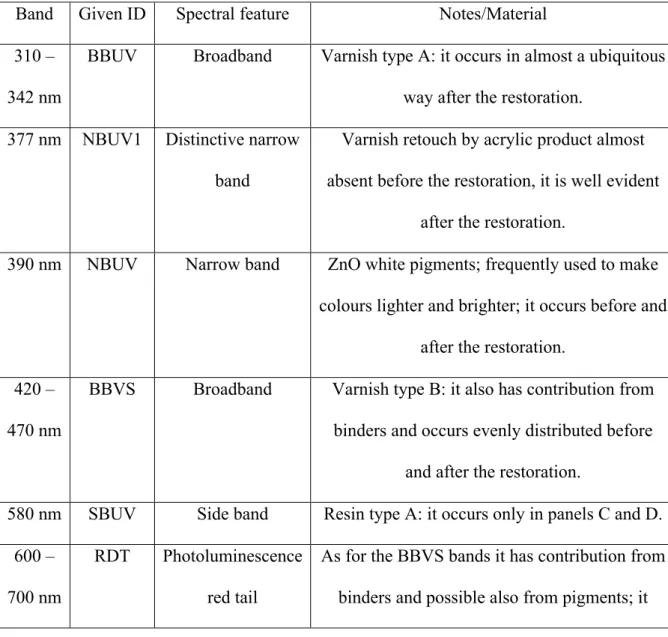
The bands identified are listed in Table II, together with a qualitative assignment to material used in the artwork or applied in the restoration process; a more precise and unique identifications of bands is not possible by means of the fluorescence data alone, because many factors, and mainly ageing, do cause band distortion.
Table II. Main spectral features identified in the panels under study, the ID in the second column is a shortband for futher reference in the text.
Band Given ID Spectral feature Notes/Material 310 –
342 nm
BBUV Broadband Varnish type A: it occurs in almost a ubiquitous way after the restoration.
377 nm NBUV1 Distinctive narrow band
Varnish retouch by acrylic product almost absent before the restoration, it is well evident
after the restoration.
390 nm NBUV Narrow band ZnO white pigments; frequently used to make colours lighter and brighter; it occurs before and
after the restoration.
420 – 470 nm
BBVS Broadband Varnish type B: it also has contribution from binders and occurs evenly distributed before
and after the restoration.
580 nm SBUV Side band Resin type A: it occurs only in panels C and D.
600 – 700 nm
RDT Photoluminescence red tail
As for the BBVS bands it has contribution from binders and possible also from pigments; it
11
occurs evenly distributed before and after the restoration.
Panel C presents the BBUV band, with also an evidence of the products used in a previous restoration with a band at 320 nm (width 5 nm) and also shows a product used in the current restoration NBUV1 band due to the use of acrylic resins.21,27 These results can be extended to other panels, as detected in panel F though the features are slight.
In panel F, some bands around 400nm might be due to the presence of nanoparticles (NP) of metals, typically Ag NPs with characteristic plasmonic
resonances, according to previous studies.28,29 These nanoparticles have not been used during the current restoration and they have not been detected by scanning electron microscopy.23 Further investigations would be necessary in this case to assign this band.
In panel D, very few retouches have been detected following restoration according to the intervention project. Before the last restoration, the surface spectral study showed diffuse and ill-defined former treatments, in particular the peak of varnish at 320 nm was not evident in areas covered by dirt. After cleaning, the spectrum emitted from the entire surface becomes more homogenous and a uniform varnish coating is detected at 320 nm. This observation is consistent with minor intervention, where the cleaning has been stopped before the original varnish is removed, and its spectral signature disappears. In this respect, LIF could be used as a technique to control and validate restorations of wooden artworks.
LIF and PCA studies after restoration
Following restoration, the eight relief panels were studied with the aim of characterizing
12
the final surfaces, applying the methodology of LIF image processing coupled with PCA, as above described. PCA was run for all the LIF scans and the spectral loadings are shown in Figure 4 for wooden panels A to H.
<Insert Figure 4 here>
The spectral shape of the PC loadings was used to identify the prominent features and the candidates for physical LIF emission. The spectral features found in each panel according to the current analysis of LIF images are listed in Table III.
Table III. Spectrum features of all panels A-H scanned after the restoration.
Panel Band occurrence
A BBUV, NBUV1, NBUV2, BBVS, RDT
B BBUV, NBUV1, NBUV2, BBVS, SBVS
C BBUV, NBUV1, NBUV2, SBVS
D BBUV, NBUV1, NBUV2, SBVS
E BBUV, NBUV1, NBUV2
F BBUV, NBUV1, NBUV2
G BBUV, NBUV1, NBUV2
H BBUV, NBUV1, NBUV2, SBVS
Results obtained from the non-destructive LIF scanning investigation, supported by statistical analysis of the hyperspectral images, are in agreement with what found in the same study on the samples before and after restoration and above discussed. Namely the PCA analysis extended to the entire set of eight panels show the presence of the BBUV band that can be associated to a varnish at 320nm (sometimes with a shoulder at
13
580nm), related to a previous documented intervention, and to an acrylic consolidant, related to the current restoration (NBUV band).
Although retouched areas are very well identified, it is not possible to assign pigments by the fluorescence spectra because a complex absorption/emission
phenomenon occurs at the multi-layered painted surface, and no historical database on wooden substrate is available.
A detailed analysis of PC1 of the 8 relief panels (Figure 5) clearly shows that panel B has different spectral features from the others. In addition, it is possible to further split other seven samples in two groups characterized by different spectral signatures: one group constituted by panels A, E and F, located at the centre of the canopy, and another one formed by panels C, D, G and H, located at the corners.
Though they are very similar, the presence of golden areas might cause this slight difference in the spectra observed in the second cluster.
<Insert Figure 5 here>
All the panels were scanned at the same point of restoration, and according to historical and iconographic analysis, each panel is original and was made at the same time (XVII Century) and has been restored together. Nevertheless, panel B has a different spectral fingerprint (PC1), and curiously, it is the only panel from the New Testament that does not depict an episode from the Passion of Christ, which makes it difficult for historians to interpret. Furthermore, this panel was not mentioned in the description provided by Serrano y Ortega in 1898 of the canopy.30
Moreover, the stratigraphic studies carried out on this panel by IAPH 22 show the presence of a single layer of pigment in the white part of the son’s arm composed of lead white and calcite. This stratigraphic analysis contradicts the historical data of the
14
repainting carried out in the XIX Century 23 and show chemical evidences of differences between this panel and the others.
The LIF spectrum of panel B and the differences in the stratigraphy and the iconographic values highlight some clear differences in this panel, though they are not enough to conclude a different author for this relief or different curators, it is worth- mentioning that, according to its LIF spectra, it shows significant differences with respect to the others.
Titanium and Zinc White have been found in retouches of other parts of the canopy,23 so they might have been used on the panels in a previous restoration, and they could be the cause of the narrow band peak at 390 nm, originating from the material’s band-gap emission (Zinc oxide) and less pronounced peaks (TiO2) found in some cases.21
Digital Image Analysis (DIA)
The findings in section “LIF and PCA studies before and after restoration on panels C, D and F”, have been extended by carrying out the digital image analyses (DIA) on the eight panels following restoration; the DIA, allowed to evaluate the
surface extension of the compounds used in the last restoration. To this end, false colour images were used to separate zones with the same spectral characteristics following the methodology developed by Vazquez et al.31 Briefly, the main spectral channels were chosen, and the obtained maps were converted into binary images using a threshold technique. Each of the binary image was assigned a different RGB channel,
corresponding the different colour areas to different products used in the retouches of the panels.
15
The monitoring conducted on panel A by digital image analysis is shown in Figure 6 to explain the LIF features as a diagnostics tool in wooden artworks. The false colour LIF image built by combining the spectral channel at 760nm, 313nm, 377nm shows areas dominated by different spectral contributions especially relevant to retouches carried out during the last restoration with acrylic products.
<Insert Figure 6 here>
Namely, the pink area, distributed on several different points, is spectrally characterized by an emission band centred approximately at 377nm. This band is shown on the right side of Figure 6 and could be due to retouches carried out during the last restoration with acrylic products. While it seems that some of the signals are due to the last retouches (zones A), there are other signals that could be due to other products (zones B, F and E), i.e., BBUV and/or BBVS.
To evidence the zones dominated by the NBUV1 band (acrylic superficial product) an image analysis was carried out to identify the spatial areas mainly dominated by this spectral feature in every panel. Figure 7 shows the results of the digital image analysis applied to the eight wooden panels in grey scale: darker regions correspond to stronger occurrence of NBUV1 band evaluated as the contribution of a peak centred at 377 nm and with 10 nm full width at half maximum. It clearly shows the zones that have been retouched; some of them during the last restoration as they are well identified according to the restoration project,23 while other zones were probably treated in previous interventions.
<Insert Figure 7 here>
To identify the precise areas subjected to the conservative intervention, the image analysis has been overlapped with the photographic images of the panels; as an
16
example the Figure 8 shows the zones dominated by the NBUV1 peak before and after the restoration on the panel F (Jesus helped by Simon of Cyrene on the Via Dolorosa).
These results demonstrate as the DIA applied to the fluorescence spectral data analysed by mean of the PCA is an effective tool to monitor and assess the retouching and restoration of wooden artwork.
<Insert Figure 8 here>
Conclusions
The application of digital image analysis to the LIF characterization of the examined painted wooden artwork resulted to a successful strategy to obtain details on its realization followed by former and current restorations. Specifically, the PCA was applied, which usually presents peaks and bands but sometimes exhibits complex spectral shapes with negative features lacking straightforward physical meaning. The occurrence of bands in principal component resulted here to be an indication of the existence of physical bands that enable the analysis of laser induced fluorescence (LIF) spectra. The information obtained in the cases considered was enough to discriminate between different surface features on painted wood and assign them their LIF signature, allowing for both recognition and localization onto the surface image.
In the case of wooden panels examined before and after the last restoration, the processing of LIF spectra by digital image analysis assisted by principal component analysis enabled the recognition of different products used for surface treatments, indicating the quality of the last restoration in terms of dirt removal without altering the top surface layers (original varnishes). In this respect, the technique offers a kind of quality control for restoration.
17
Furthermore, discussion of the LIF and principal component data allow us to conclude that the use of band analysis for spectral ratio between 460nm and 377nm is of interest to document use of different varnishes on wood. The peak centred at 377nm shows the presence of an acrylic product. The Spectral Angle Mapper analysis enabled a precise mapping of the intervention with a single product on the examined surface.
In conclusion, the combination of laser induced fluorescence, principal
component analysis and digital image analysis allows a distinction to be made between different surface treatments on woods. When this methodology is employed to monitor the progress of intervention work, it offers an effective tool to support the restorer at each successive stage (cleaning, additional coating, etc.).
Acknowledgements: This study has been partially supported by the agreements ENEA
& UPO, UPO & IAPH and the Junta de Andalucía Projects RIVUPH (HUM-6775) and PASO (PI_57102). R. Ortiz is grateful to the IAPH for her stay as visiting researcher.
References
1. C. Fischer, I. Kakoulli. “Multispectral and hyperspectral imaging technologies in conservation: current research and potential applications”. Stud. Conserv. 2006.
51(sup1): 3–16.
2. A. Pelagotti, A.D. Mastio, A. De Rosa, A. Piva. “Multispectral imaging of paintings: A way to material identification”. IEEE Signal Process. Mag. 2008.
25(4): 27–36.
3. S. Legrand, F. Vanmeert, G. Van der Snickt, M. Alfeld, W. De Nolf, J. Dik, et al.
“Examination of historical paintings by state-of-the-art hyperspectral imaging
18
methods: From scanning infra-red spectroscopy to computed X-ray laminography”. Herit. Sci. 2014. 2(1): 1–11.
4. M. Kubik. “Chapter 5 Hyperspectral Imaging: A New Technique for the Non- Invasive Study of Artworks”. Phys. Tech. Study Art, Archaeol. Cult. Herit. 2007.
2: 199–259.
5. A. Polak, T. Kelman, P. Murray, S. Marshall, D.J.M. Stothard, N. Eastaugh, et al.
“Hyperspectral imaging combined with data classification techniques as an aid for artwork authentication”. J. Cult. Herit. Elsevier Masson SAS, 2017. 26: 1–11.
6. J. Hällström, K. Barup, R. Grönlund, A. Johansson, S. Svanberg, L.
Palombi, et al. “Documentation of soiled and biodeteriorated facades: A case study on the Coliseum, Rome, using hyperspectral imaging fluorescence lidars”.
J. Cult. Herit. Elsevier Masson SAS, 2009. 10(1): 106–115.
7. R. Fantoni, L. Caneve, F. Colao, L. Fiorani, A. Palucci, R. Dell’Erba, et al.
“Laser-induced fluorescence study of medieval frescoes by Giusto de’
Menabuoi”. J. Cult. Herit. Elsevier Masson SAS, 2013. 14(3 SUPPL): S59–S65.
8. L. Caneve, M. Guarneri, A. Lai, V. Spizzichino, S. Ceccarelli, B. Mazzei.
“Non-destructive laser based techniques for biodegradation analysis in cultural heritage”. NDT E Int. Elsevier Ltd, 2019. 104(June 2018): 108–113. 9. M.
Marinelli, A. Pasqualucci, M. Romani, G. Verona-Rinati. “Time resolved laser induced fluorescence for characterization of binders in contemporary artworks”.
J. Cult. Herit. Elsevier Masson SAS, 2017. 23: 98–105. 10. D. Anglos, M.
Solomidou, I. Zergioti, V. Zafiropulos, T.G. Papazoglou, C. Fotakis. “Laser- Induced Fluorescence in Artwork Diagnostics: An Application in Pigment Analysis”. Appl. Spectrosc. Society for Applied Spectroscopy, 1996. 50(10):
1331–1334.
19
11. I. Borgia, R. Fantoni, C. Flamini, T.M. Di Palma, A.G. Guidoni, A. Mele.
“Luminescence from pigments and resins for oil paintings induced by laser excitation”. Appl. Surf. Sci. Elsevier, 1998. 127–129: 95–100.
12. M. Romani, G. Capobianco, L. Pronti, F. Colao, C. Seccaroni, A. Puiu, et al.
“Analytical chemistry approach in cultural heritage: the case of Vincenzo Pasqualoni’s wall paintings in S. Nicola in Carcere (Rome)”. Microchem. J.
Elsevier Inc., 2020. 156: 104920.
13. S. Almaviva, R. Fantoni, F. Colao, A. Puiu, F. Bisconti, V. Fiocchi Nicolai, et al.
“LIF/Raman/XRF non-invasive microanalysis of frescoes from St. Alexander catacombs in Rome”. Spectrochim. Acta - Part A Mol. Biomol. Spectrosc.
Elsevier B.V., 2018. 201: 207–215.
14. L. Pronti, M. Romani, G. Verona-Rinati, O. Tarquini, F. Colao, M. Colapietro, et al. “Post-Processing of VIS, NIR, and SWIR Multispectral Images of Paintings.
New Discovery on the The Drunkenness of Noah, Painted by Andrea Sacchi, Stored at Palazzo Chigi (Ariccia, Rome)”. Heritage. 2019. 2(3): 2275–2286. 15.
M. Romani, S. Almaviva, F. Colao, R. Fantoni, M. Marinelli, A. Pasqualucci, et al. “Raman and Time-Gated-Lif Spectroscopy for the Identification of Painting Materials *”. J. Appl. Spectrosc. 2019. 86(2): 360–368.
16. J.L. Gómez Villa. Gran Poder. Mesa te esculpió, Sevilla te hizo. 400 años de devoción. 2020. Catálogo de obras. Exposición. Pontificia y Real Hermandad y Cofradía de Nazarenos de Nuestro Padre Jesús del Gran Poder y María Santísima del Mayor Dolor y Traspaso., editors. Sevilla (Spain), 2020.
17. R. Ortiz, P. Ortiz, F. Colao, R. Fantoni, M.A. Gómez-Morón, M.A. Vázquez.
“Laser spectroscopy and imaging applications for the study of cultural heritage murals”. Constr. Build. Mater. 2015. 98: 35–43.
20
18. L. Caneve, F. Colao, L. Fiorani, A. Palucci. Portable laser radar for remote surface diagnostics “Radar laser portatile per la diagnostica remota di superfici”.
RM2010A000606. Issued 2010.
19. F. Colao, L. Caneve, R. Fantoni, L. Fiorani, A. Palucci, R. Fantoni, et al.
Scanning hyperspectral lidar fluorosensor for fresco diagnostics in laboratory and field campaigns. Lasers in the Conservation of Artworks - Proceedings of the International Conference LACONA 7. CRC Press, 2008. Pp. 149–155.
20. L. Caneve, F. Colao, R. Fantoni, L. Fiorani. “Scanning lidar fluorosensor for remote diagnostic of surfaces”. Nucl. Instruments Methods Phys. Res. Sect. A Accel. Spectrometers, Detect. Assoc. Equip. North-Holland, 2013. 720: 164–167.
21. F. Colao, L. Caneve, L. Fiorani, A. Palucci, R. Fantoni, M.P. Ortiz, et al. Report on LIF measurements in Seville - Part 2: Santa Ana Church. RT/2012/8/ENEA.
Rome, 2012.
22. L. Pérez del Campo, A. Montero Moreno, M. del M. González González, E.
Fernández Ruíz, M.T. Real Palma, C. Rubio Faure, et al. Proyecto de
intervención paso de Jesús del Gran Poder. Hermandad de Jesús del Gran Poder (Sevilla). Sevilla: IAPH, 2010.
23. C. Rodríguez Segovia, R. Baglioni, M. Sameño Puerto, V. Menguiano Chaparro, E. Fernández Ruiz, J.M. Santos Madrid. Memoria final de intervención paso procesional de Jesús del Gran Poder. Hermandad del Gran Poder, Sevilla.
Sevilla: IAPH, 2012.
24. M.J. Baxter. “Standardization and Transformation in Principal Component Analysis, with Applications to Archaeometry”. Appl. Stat. JSTOR, 1995. 44(4):
513–527.
25. A.C. Rencher. Methods of Multivariate Analysis. 2nd ed. New York: Wiley
21
Interscience, 2002.
26. G. Girouard, A. Bannari, A. El Harti, A. Desrochers. Validated spectral angle mapper algorithm for geological mapping: comparative study between QuickBird and Landsat-TM. XXth ISPRS Congress. Istambull, 2004. Pp. 599–604.
27. D. Comelli, C. D’Andrea, G. Valentini, R. Cubeddu, C. Colombo, L. Toniolo.
“Fluorescence lifetime imaging and spectroscopy as tools for nondestructive analysis of works of art”. Appl. Opt. OSA - The Optical Society, 2004. 43(10):
2175–2183.
28. J. Molera, M. Mesquida, J. Pérez-Arantegui, T. Pradell, M. Vendrell. “Lustre recipes from a medieval workshop in Paterna”. Archaeometry. Blackwell Publishing Ltd, 2001. 43(4): 455–460.
29. V. Lazic, F. Colao, R. Fantoni, A. Palucci, V. Spizzichino, I. Borgia, et al.
“Characterisation of lustre and pigment composition in ancient pottery by laser induced fluorescence and breakdown spectroscopy”. J. Cult. Herit. Elsevier Masson SAS, 2003. 4(SUPPL. 1): 303–308.
30. M. Serrano y Ortega. Noticia histórico-artística de la sagrada imagen de Jesús Nazareno que con el título del Gran Poder se venera en su capilla del templo de San Lorenzo de esta ciudad [Sevilla]. Reedición. Sevilla: Extramuros, 2008.
31. M.A. Vázquez, E. Galán, M.A. Guerrero, P. Ortiz. “Digital image processing of weathered stone caused by efflorescences: A tool for mapping and evaluation of stone decay”. Constr. Build. Mater. Elsevier, 2011. 25(4): 1603–1611.
22
Captions
Figure 1 – Experimental system layout: IS imaging spectrometer, iCCD optical sensor, M1, M2, M3 steering mirrors, L1 cylindrical lens, TX excitation in form a light blade, RX fluorescence emitted from sample surface; the system rotates around a horizontal axis normal to the figure plane.
Figure 2. Painted wooden corners tested with the LIF system. Panel A to Panel H. (a) Moses bringing forth water in the rock of Horeb. (b) Return of the Prodigal Son, (c) Samson destroying the Temple of Dagon, (d) Animals entering Noah's Ark, (e) Apprehension, (f) Jesus helped by Simon of Cyrene on the Via Dolorosa, (g) Jesus crowned with thorns as king of the Jews, (h) Flagellation. Panels remarked with a discontinuous blue line were analysed before and after restoration.
Figure 3. PCA of LIF scans of wooden panels C, D and F before and after restoration.
Figure 4 - PCA of LIF scans of the eight wooden panels (a-h) after restoration.
Figure 5. PC1 of LIF scans of the eight wooden panels (a-h) after restoration.
Figure 6. RGB false colour LIF image of panel A (upper left) built with spectral channel at 760 nm,313 nm, 377 nm and spectrum from selected areas (right and bottom).
23
Figure 7. Grey false colour images of the eight LIF images built with spectral signal at 377 nm and bandwidth 10 nm that shows the retouches carried out with acrylic
products.
Figure 8. Colour images built with spectral signal at 377 nm and band width 10nm that shows the retouches carried out with acrylic products on panel F (a) before (b) and after (c) restoration
24 Figure 1
Figure 2
25 Figure 3
26 Figure 4
27 Figure 5
28 Figure 6
29 Figure 7
Figure 8