La percepción de profundidad es un aspecto clave de la visión humana. La percepción de la profundidad se ha asociado a menudo con la visión binocular.
Contributions and outline
Then the proposed method is described in the central part of the chapter, followed by experiments and discussion of the results obtained. We use these constraints for our purposes, which we will describe in the next chapters.
Depth perception
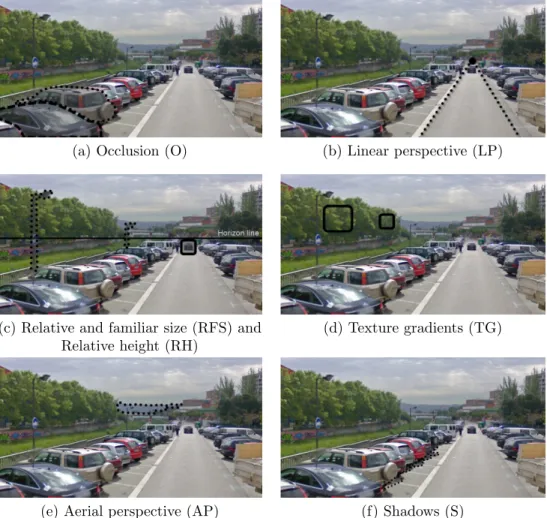
Relative and perceived size (RFS): If two objects are the same size, the one that is further away appears smaller to the observer. This sign is related to the position of objects relative to the horizon line in the field of view.
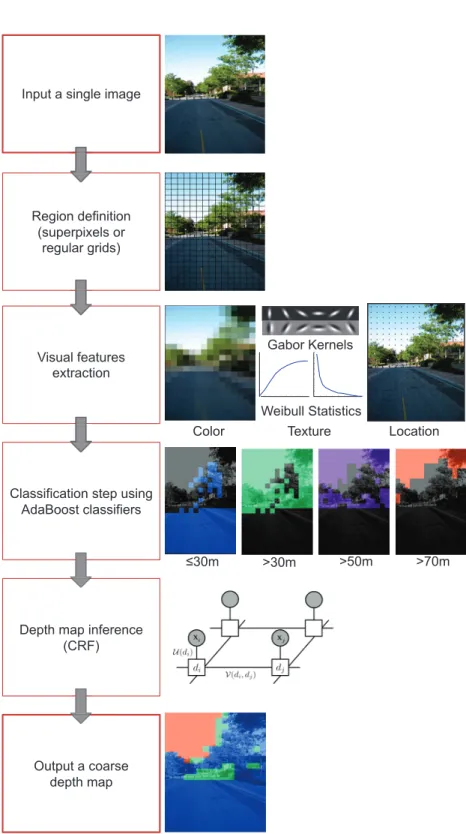
Depth estimation from a single image
Note that in this case the depth is derived at the level of the entire image. We make this requirement because the results of our proposal are not a final goal, but simply the starting point for tackling various computer vision tasks from a different and new perspective.

Summary
For a given camera, each of these relative concepts actually translates to a depth range, which we have established considering properties of the elements observed within those ranges. In fact, for some applications it may be sufficient to use only the image information within one of the categories.
Depth-based region segmentation
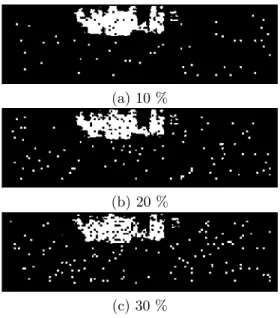
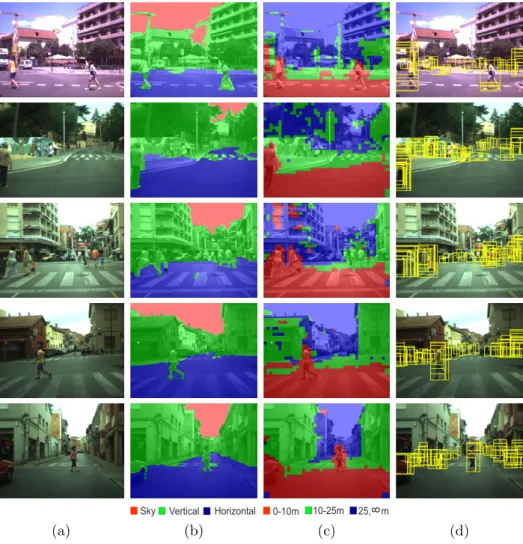
We can see that the regions in the range [0,30] are located mostly in the lower half of the image. As the depth range increases, the regions tend to be located closer to the top of the image.
Experimental results
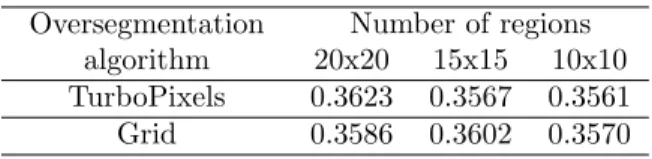
Misclassification using larger regions is due to the fact that the regions are quite unstable, mixing the features of regions located at different depths, especially in the case of regular meshes. The difference in the average performance of the Jaccard index with respect to the best configuration (i.e., superpixels of 200 regions) is less than 1%. This ambiguity is due to the lack of sufficient positive examples in the training set.
Medium distance regions (between 50 and 70 m) are occasionally misclassified, which we attribute to the lack of examples in the training set.
Conclusions
Unlike previous approaches, our proposal exploits the fact that the contribution of vehicle translation to the image stream is negligible in the image regions corresponding to distant elements in the scene. Vehicle egomotion estimation consists of determining changes in position and orientation of a 3D rigid vehicle. Taking advantage of this, in this chapter we propose to calculate the egomotion of the vehicle in two stages.
First, vehicle rotation is estimated, processing only information that corresponds to distant elements in the scene.
Related work
This generates a drift of the estimated trajectory relative to the real one, which can be reduced by applying a beam alignment technique or by combining with other information sources such as IMU or GPS [70]. In particular, in our case, using a single camera, the DOF is reduced to five, since translation can only be recovered up to a scale factor (i.e. only translation direction is estimated, while its magnitude cannot be recovered due to lack of depth information). These methods use vertices because they can be mapped with less ambiguity than other functions.
For example, using a monocular camera, the authors in [16] proposed an iterative process that relies on RANSAC to select optical flow vectors that can only be explained by a particular camera rotation.
Problem formalization
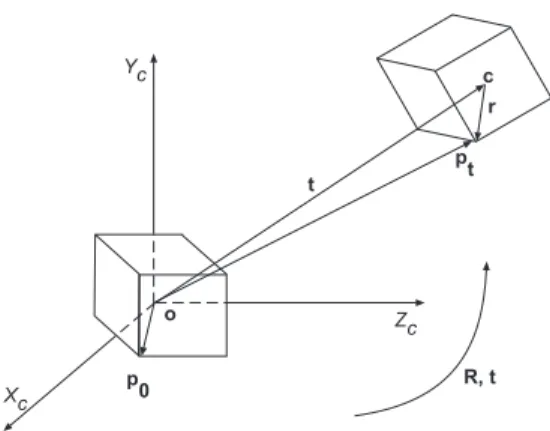
From the classical mechanics point of view, the camera/scene can be assumed to be a rigid body (ie the 3D distance between two points on a rigid body remains the same after movement). Vector ω is the so-called angular velocity vector, which specifies the axis about which the body rotates (i.e. the direction of ω) and the angular velocity of the body (i.e. the magnitude of the rotation|ω|per unit time). Assuming that there is only one rigid motion between the camera and the observed scene, the image flow field is the projection of the 3D velocity onto the image plane [59].
The image flux vector equation of qH is calculated by differentiating Eq. 4.7) with respect to time, taking thus.
Proposed egomotion estimation approaches
The image coordinates of the points of interest attandt+ 1 define the vectors in Eq. 4.14), from which the rotation is finally estimated. This transform actually captures the rotation of the camera. 4.12) we know that distant regions in successive frames are aligned by means of the image stream field given by Bω. Given a template T of remote areas in It+1, we pose its matching with the remote areas of Ita as the problem of finding the value of ω that minimizes the following objective function.
To solve this, we apply a modified version of the Lucas-Kanade algorithm [80] based on the publicly available code described in [9].

Experimental results
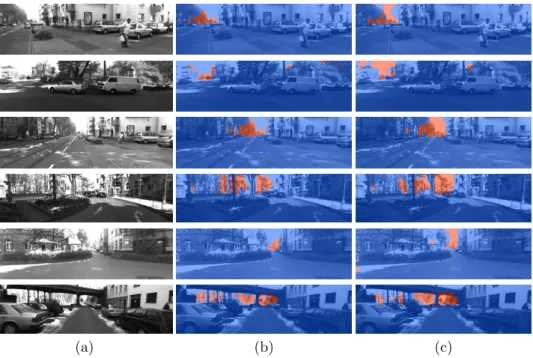
Note that the number of FPs is very low (2% of nearby regions are misclassified as distance), and then the distant regions used by our method have a low amount of noise. We can see that our classifier correctly classifies more than 90% of remote areas, allowing less than 20% of false positives. Moreover, if we do not accept false positives, more than 50% of remote regions are correctly detected.
In this section, we evaluate the performance of our algorithms under segmentation of noisy distant regions.
Conclusions
As a consequence, we define the background model under two main assumptions: First, the background represents objects whose distance to the camera is the greatest; and secondly, objects in the background are stationary. However, people can easily identify which objects are in the foreground as well as those belonging to the background. On the other hand, moving objects are treated as foreground objects as they tend to obscure the background.
Our approach selects the appropriate pixels to compose the background from a set of images by minimizing a cost function that penalizes deviations from our background model.
Related work
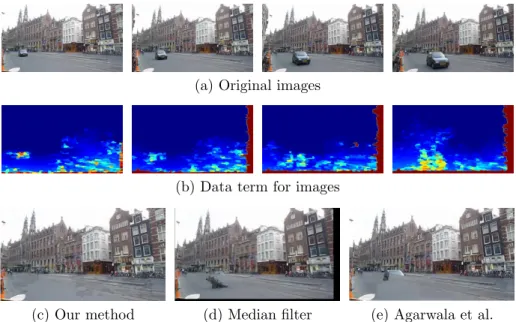
Given a sequence of aligned images, we compute color, motion, and depth penalties for each pixel to compose an energy function. The minimization result is a label where each pixel corresponds to an input image where the background is visible. Distant areas are used for alignment because they provide reliable information about camera movement, which leads to the images being aligned relative to the background.
Proposed background estimation approach
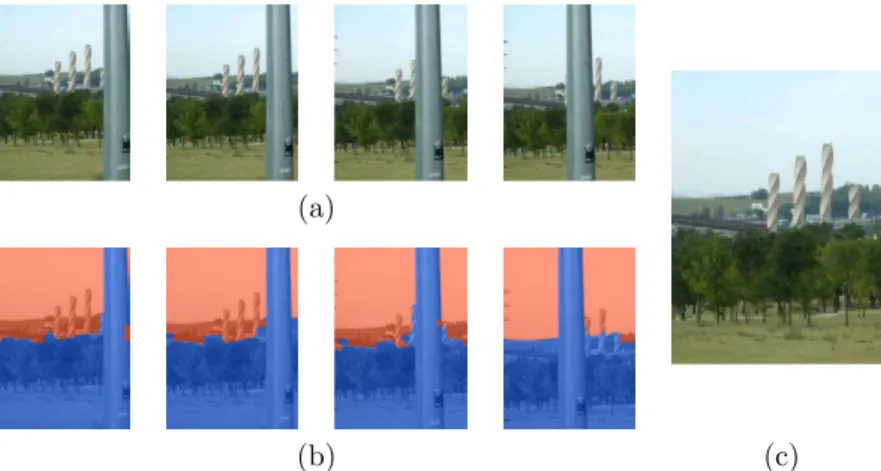
Distant regions are used to align images, as they act as an infinite plane that provides accurate information about the camera movement, aligning the images with respect to the background. Assuming that Ifpis is the background image and Ii is an input image containing moving objects, the difference image Ffp,i =∥ Ifp−Ii ∥ has a large gradient magnitude ∥ ▽Ffp,i ∥ when Ifp and Ii are poorly matched. This term penalizes those image regions that are close in the scene, since we assume that the background is composed of distant regions.
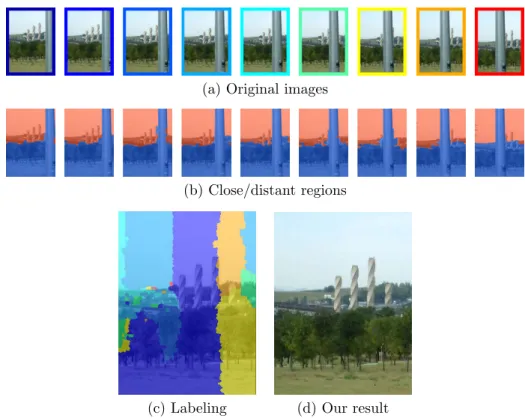
Then, the background consists of a set of low-cost pixels from different images as we can observe in Fig.
Experimental results
Note that by combining the depth information, our method beats the results from [19], which are those in Figure 5.5, we show the result of our method in a scene with an independent moving object (i.e., a car approaching the camera). ). Our method effectively removes the car, while the median filter method retains some of the ghost in it, as Fig.
Another example of applying our method to compose the background of Towerscene is shown in Fig.
Conclusions
Although some ghosts are present in shadows, our results are comparable to Agarwala et al. From a quantitative point of view, we calculate the norm of the absolute difference in RGB channels between our results with respect to the manually improved results of Agarwal et al. to measure how much the results of the two methods differ. However, our approach is fully automatic, while the method of Agarwal et al. requires user interaction to improve.
Our method is monocular and uses geometric and depth information available on separate images.
Introduction
Most pedestrian detection systems are based on applying a previously trained classifier to a candidate window located in an image region of interest. Common techniques for candidate generation (eg, sliding window approaches) are based on an exhaustive image search. However, passive sensors based on visual information (such as cameras) obtain a rich representation of the environment, which can be used to identify objects in the scene, as well as detect lanes and recognize traffic signs.
In this chapter, we propose a new method for generating a set of possible hypotheses for pedestrian detection based only on the analysis of the mean level of scene representation.
Related work
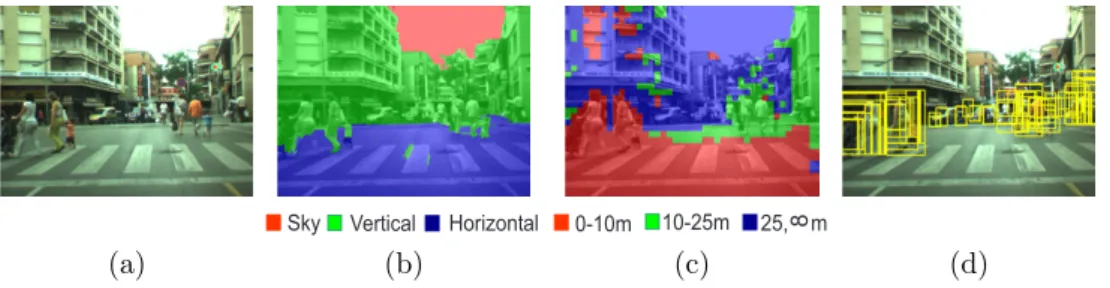
Medium-level representations
Candidate window generation approach
On the other hand, the principle of similarity which states that the elements in a region are similar, including similar color, brightness and texture [43]. Size constraint: In our context, the size of an object of interest is constrained to a certain range according to its depth, taking into account the camera calibration characteristics (i.e., focal length and image size). Inspired by [114], we use an agglomerative clustering method on the Euclidean distances between the coordinates of the superpixels centroids.
If the size of g is within the minimum and maximum size of a pedestrian, generate a new candidate window for g.
Experimental results
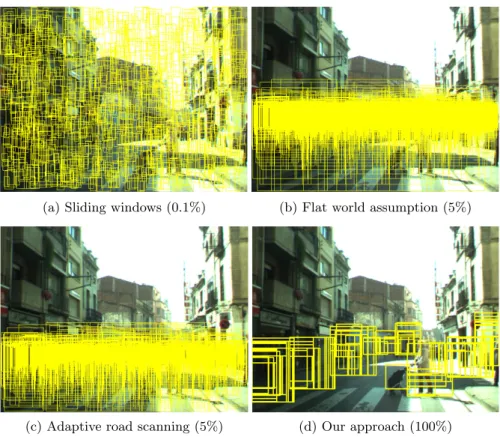
It can be observed that our approach selects a reduced number of candidate windows compared to the other considered methods. Although sliding window has the best performance in terms of TPR (100% and 98%), the number of sorting candidates is huge, which affects the time consumption in the posterior sorting stage. Finally, our method remarkably reduces the search space while maintaining high performance against TPR (84%).
Here we can see the candidate windows generated by the considered approaches versus our results.
Conclusions
In our current work, we have shown how computer vision problems can be approached from different and new perspectives to yield better results. As a result of these experiments, we have come to the conclusion that the performance of both settings is quite similar. We have analyzed the importance of selected visual features for the proposed coarse depth segmentation.
Furthermore, we compared the performance of our proposal with the performance achieved by a more ambitious depth map estimation method.
Future work
Perhaps this signal can be useful in the case of pedestrian and vehicle detection systems, where approximate size information is available. From the ego motion information, the angle of the camera tilt can be obtained and a more accurate image scan can be performed. Due to the high variability of the pedestrian at different distances, different classifiers can be trained depending on the target distance provided by our approach to compute raw depth maps.
This search space can be significantly reduced by knowing where the most distant regions are in a scene that possibly contains the vanishing point.
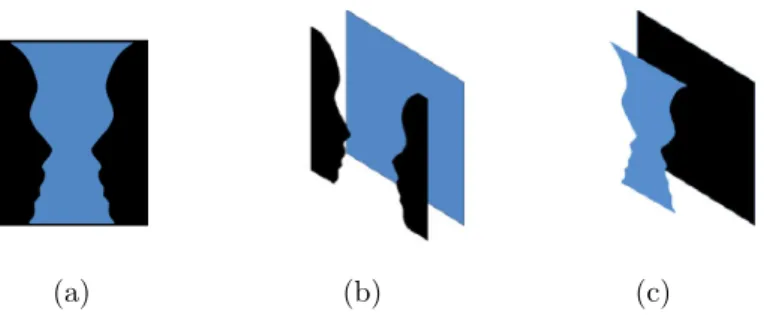
Theories of visual perception
On the one hand, Johannes Kepler proposed image projection on the retina, which was a crucial point in vision research. On the other hand, Charles Wheatstone gave the explanation of stereopsis, that “the mind perceives an object of three dimensions by means of the two dissimilar images projected thereby on the two retinas” [119]. In short, they argue that "the whole differs from the sum of its parts," because they focused on the global and holistic processes involved in perceiving the environment.
On the one hand, they describe the laws of grouping, explaining how smaller objects group together to form larger ones.
Perception, visual perception and its relation to this work
We argue that visual perception is the ability to interpret information based on the effects of visible light through the visual system. In a more computational perspective, the visual system is responsible for a number of complex tasks, including the reception of light and the formation of monocular representations; the construction of a binocular perception from a pair of two-dimensional projections; the identification and categorization of visual objects; judging distances to and between objects; and guiding body movements in relation to visual objects. The Helmholtz idea of inference where the visual experience is fundamental to learning models for understanding the surrounding world.
We learn models from training sets (which can be assumed as 'experience') using a range of visual features.
Summary
Lategahn, "Visual Odometry based on Stereo Image Sequences with RANSAC-based Outlier Rejection Scheme," in IEEE Intell. Van Gool, “Multi-View Traffic Sign Detection, Recognition and 3D Localization,” in IEEE Workshop App.