The statistical data for Israel are provided by and under the responsibility of the relevant Israeli authorities. The main report was prepared under the auspices of the OECD's Committee on Science and Technology Policy (CSTP) with input from its working groups.
Value for money?
From investment to outcomes
Convergence and co-operation
For example, some countries already ban xenotransplants, the use of animal organs such as pig kidneys to replace damaged human organs. Other research is investigating, for example, the possibility of growing human egg cells in animals for reimplantation in infertile women, or the use of hybrid animal-human embryos in the development of drugs for Alzheimer's disease and other diseases.
The future meaning of life
For example, nanotechnology can have many applications in medicine and life sciences due to the fact that nanoscale entities are one hundred to ten thousand times smaller than human cells and similar in size to large biological molecules (biomolecules) such as enzymes. Primitive precursors to this are treatments such as Prozac, Botox, Viagra, cosmetic surgery or doping of athletes that alter the body but are not designed to fight a disease.
The science of science policy
But these devices are designed to correct defects, while in the long term, the convergence of technology may allow healthy people to improve.
National Innovation Systems
Governance of biotechnologies
The OECD argued that discoveries related to chemical processes could be protected as intellectual property. The OECD again defined a new framework in 1986, this time with regard to recombinant DNA, and again governments around the world followed suit.
Rights and trust in the age of Internet
The OECD Guidelines for the Licensing of Genetic Inventions came out strongly against this, saying that intellectual property should indeed be protected, but also shared. As new challenges have emerged – email scams or phishing scams, for example – the OECD has responded by giving people tools to combat them.
Cheap communications for everybody
The 1999 OECD Guidelines for Consumer Protection in the Context of Electronic Commerce (“Guidelines for Electronic Commerce”) help to ensure that consumers are equally protected when shopping online as they are when purchasing through more traditional means. The guidelines, which set out the characteristics of effective consumer protection for online business-to-consumer transactions, call for global enforcement cooperation between OECD countries and non-member countries through better information sharing on consumer protection issues.
Executive Summary
At the same time, countries maintain their focus on key research areas and enabling technologies such as biotechnology, nanotechnology, ICT, new materials and advanced manufacturing. Non-OECD countries such as Brazil, China, India, Singapore and South Africa also offer a generous and competitive tax environment for investment in R&D.
Key Trends in Science, Technology and Innovation
A lot of trust has been placed in science, technology and innovation as a means to move towards a sustainable and sustainable recovery. It also discusses the possibilities for research and development to contribute to societal challenges, the impact of the recession and expectations for the future, and the increasing role of non-member economies in the landscape of science, technology and innovation.
A turbulent backdrop to recent trends in science, technology and innovation
In the public sector, the initial impact of the decline in investment in research and innovation may have been more muted. At the same time, however, the lack of consolidation can negatively affect research and innovation.
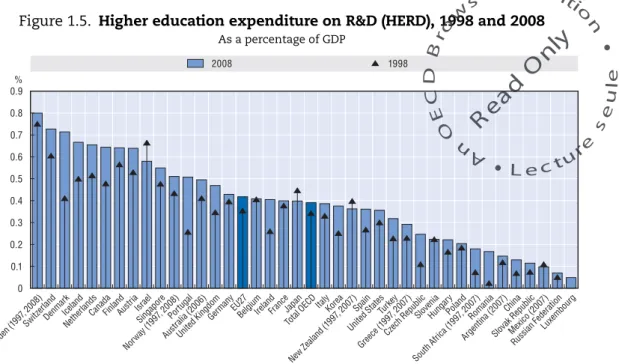
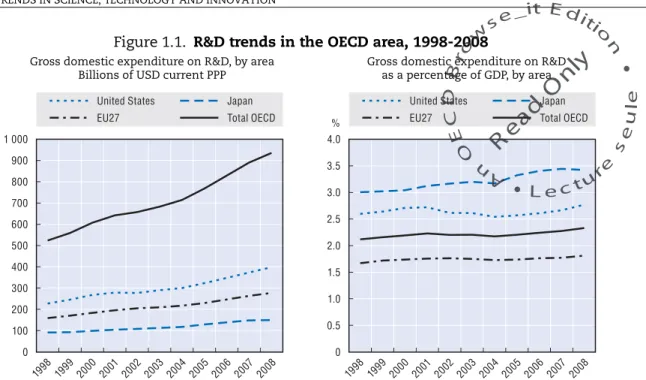
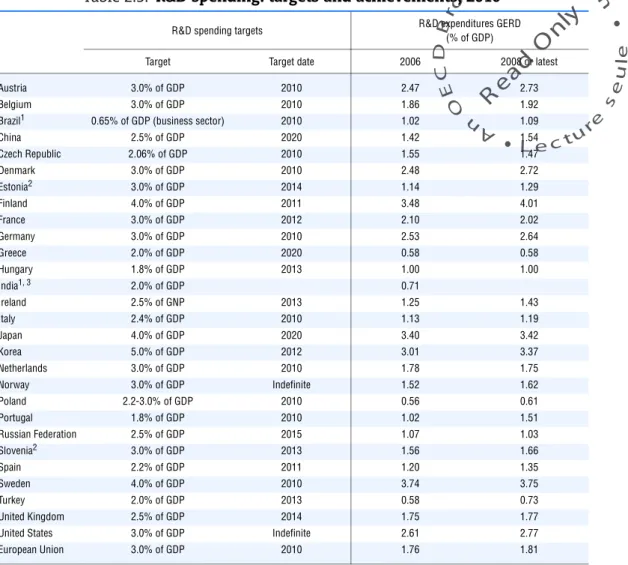
The recent expansion of R&D spending slowed through 2008
Business Expenditure on Research and Development (BERD) covers research and development activities carried out in the business sector by companies and institutes, regardless of the source of funding. In fact, the two richest economies in the OECD (Luxembourg and Norway) have quite different patterns of R&D spending.
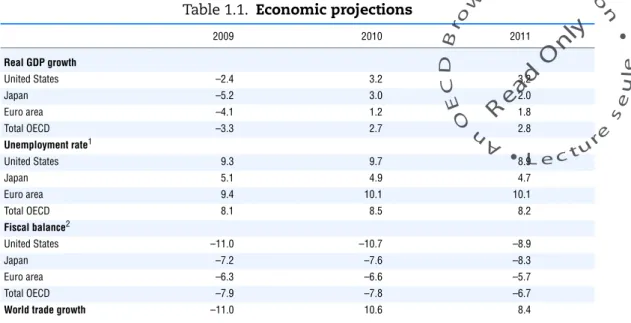
More recent data suggests overall R&D investment has slowed in the economic downturn
Overall, 22% of firms had reduced their innovation spending in the previous six months as a direct result of the economic downturn, while 9% had increased their innovation budget. An analysis of the "cleantech" sector in the United States, for example, suggested that despite an 84% drop in venture capital funding in early 2009 (driven largely by a collapse in funding for solar energy), the fundamentals of growth in the sector remained strong (PricewaterhouseCoopers, 2009).
Human resources are a central input to R&D and innovation
Poland and Spain in particular had very high proportions of doctorate holders in all fields working in the higher education and government sectors. Most countries have seen continuous growth in the number of R&D personnel, especially researchers (defined as professionals involved in the conception and creation of new knowledge, products, processes, methods and systems).
Reaping the results
All OECD countries except the United States increased their output of scientific articles (adjusted for population size) above Figure 1.14). Switzerland repeated its overall lead in triadic patent families (Figure 1.12), with the largest number of scientific articles.

The continued importance of globalisation
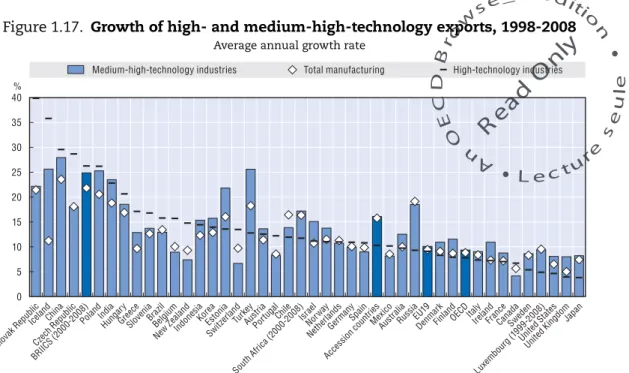
In 2008, all the BRIICS except China had shares of high-tech exports in total manufacturing exports below the OECD average of 22%, while the share of high- and medium-high-tech exports in the BRIICS' total manufacturing exports was 48%. , compared to an OECD average of around 64% (derived from the OECD STAN Indicators Database, 2010). Some countries' comparative advantage may lie in lower-tech areas and their share of high-tech exports is unlikely to reach the OECD average in the near future. During 2000-07, most countries saw an increase in the share of foreign affiliates in manufacturing turnover and employment, with the largest total increases in the Czech Republic (foreign affiliates accounted for an additional 20-25% of turnover and employment against 2007).
The impact of changing shares of high and medium technology exports on research and development and innovation activities in non-member economies is also a complicated issue.
Summary
Chilean data on science and technology are not yet part of the OECD's Main Science and Technology Indicators (MSTI) database. Estonian data on science and technology are not yet part of the OECD MSTI database. The use of such data by the OECD is without prejudice to the status of the Golan Heights, East Jerusalem and Israeli settlements in the West Bank under the terms of international law.
The use of such data by the OECD is without prejudice to the status of the Golan Heights, East Jerusalem and Israeli settlements in the West Bank under the terms of international law.
Main Trends in Science,
Technology and Innovation Policy
Introduction
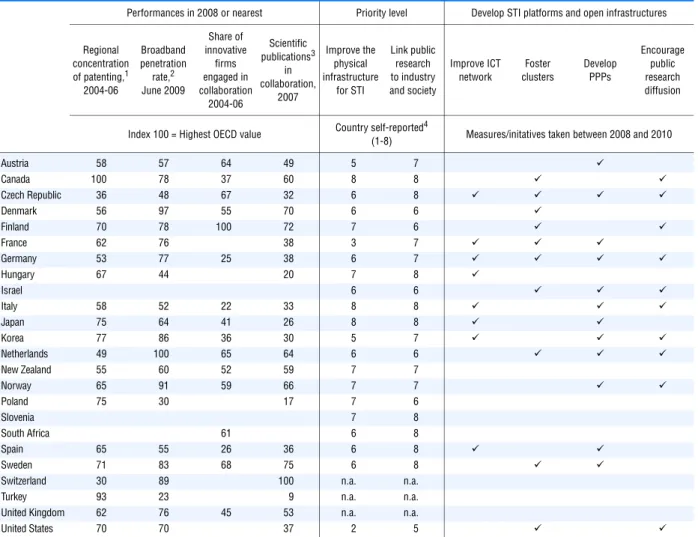
Germany and the Scandinavian countries have also launched internationalization strategies for their public research sector to facilitate multilateral cooperation in STI and build capacity. Hungary, Japan, Norway and Sweden give top priority to strengthening the science base to drive future innovation. The reform of funding mechanisms for research institutions continues to tie budget allocations to performance to drive excellence.
There is also a growing interest in assessing the interplay between different policy instruments used in the 'policy mix'.
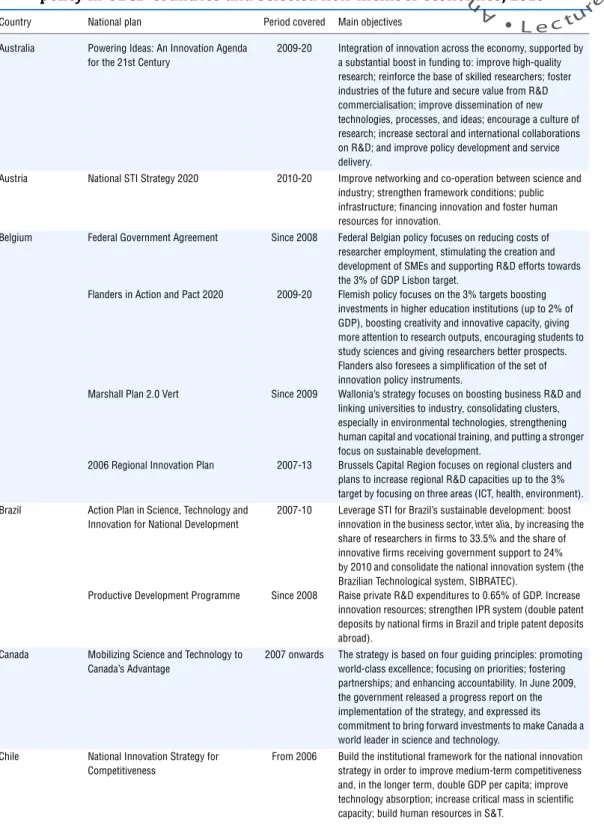
National strategies for science, technology and innovation
In June 2009, the government released a progress report on the implementation of the strategy and expressed its commitment to promoting investment to make Canada a world leader in science and technology. Finally, the recent transfer of the General Secretariat for Research and Technology to the Ministry of Education, Lifelong Learning and Religious Affairs underscores the efforts to build a unified space for Education and Research. The priorities are implemented through the funding of relevant projects under the Federal Targeted R&D Program, managed by the Russian Ministry of Education and Science.
The development of the Environmental Strategy of the Russian Federation for 2030 is currently one of the key tasks for the Ministry of Natural Resources and Environment.
Improving actors’ competences and enhancing incentives for innovation
A number of measures encourage innovative activities on the supply side; they include tax incentives for technology and research and development (Table 2.7), national high and new technology zones, and national science and technology incubators. In addition, local and regional Dutch authorities have created several loan and credit schemes (e.g. Acceleration Agenda for the Innovation Fund in Limburg). Following the strengthening of SIFIDE, companies can now reduce their tax liabilities by a percentage of double the amount invested in R&D activities (e.g. a basic rate corresponding to 32.5% of expenditure and an incremental rate of 50% of the increase in expenditure compared to the average of the previous two years, but up to the new limit of EUR 1.5 million).
In Italy, in 2009 and 2010, several regional governments awarded vouchers to SMEs for R&D services and human capital development (for example, the region and the chamber system of Lombardy provided about €6 million).
Enhancing networking among actors
Improving access to public information ensures that public research has a wider impact on the economy. Dutch analysis of the behavior of highly skilled migrants (continued) The analysis included a review of theoretical and empirical research on migration motives, a twin survey among the highly skilled currently living in the Netherlands and among Dutch highly skilled immigrants, the construction of an index that measures the competitive power of countries in attracting highly qualified migrants and finally an exploration of the possibilities for the calculation of reliable, recent and internationally comparable statistics of migration flows. Slovenia, based on the requirements of the European Framework Programs, in 2009 introduced fiscal incentives for foreign researchers working in the country.
As part of the national R&D&I plan 2008-11, Spain has created specific positions in universities or public research centers for expatriates and foreign researchers (programme I3).
Developing and strengthening human capital
The integration of the entire education system from primary education to the labor market is an approach that has been in force in the Netherlands since 2004. Spain, in the framework of the National R&D&I plan, created the National Program for Scientific Culture to increase interest in and awareness of science among youth and society. A reform of the national university system is underway in Italy, and is currently being evaluated by the Parliament.
The United States launched a Broadening Participation program, managed by the National Science Foundation (NSF) under the 'Educate to Innovate' framework.
Outlook: future challenges
The proportion of total financial resources devoted to education in a country results from choices made by government, businesses and individual students and their families, and is driven in part by the size of the country's school-age population and enrollment in education. Furthermore, if the social and private returns on investment in education are sufficiently large, there is an incentive to expand enrollment and increase total investment (OECD, 2009d). Box (2009), “Analyzing the transformation of public research institutions”, internal working paper, Science and Technology Policy Division, Directorate for Science, Technology and Industry, OECD, Paris. 2007), "R&D Tax Incentives and R&D Statistics: What Next?", internal working paper, Economic Analysis and Statistics Division, Directorate for Science, Technology and Industry, OECD, Paris.
OECD (2009a), Policy Responses to the Economic Crisis: Investing in Innovation for Long-Term Growth, OECD, Paris.
Science and Innovation: Country Notes
References in this chapter to OECD averages, peak values and rankings do not include Chile unless specifically stated. Israeli data on science and technology are available in the OECD MSTI database; however, references in this chapter to OECD averages, peaks and rankings do not include Israel unless specifically stated. Slovenian data on science and technology are available in the OECD MSTI Database; however, references in this chapter to OECD averages, peak values and rankings do not include Slovenia, unless specifically stated.
AUSTRALIA
AUSTRIA
BELGIUM
BRAZIL
CANADA
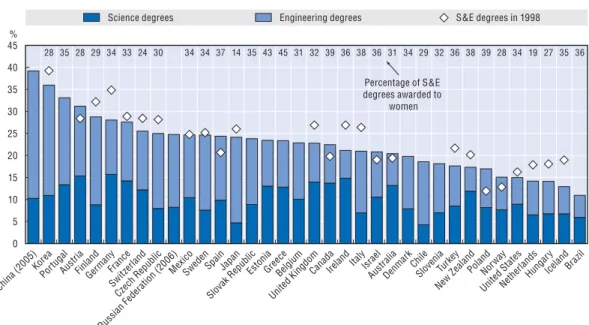
Science and engineering degrees as % of new degrees in 2007 HRST occupations as % of total employment in 2008.
CHILE
CHINA
CZECH REPUBLIC
DENMARK
ESTONIA
FINLAND
FRANCE
GERMANY
GREECE
HUNGARY
ICELAND
INDIA