SEFO
SPANISH AND INTERNATIONAL ECONOMIC & FINANCIAL OUTLOOK
VOLUME 10 | number 4, July 2021
Spain’s outlook for pandemic recovery:
Areas of outperformance and pending challenges
The Spanish economy in recovery mode: Opportunities and challenges
COVID-19 and its asymmetric impact in Spain by province:
Recent trends and projections Forbearance patterns at Spanish banks: Impact of COVID-19
Decoupling between
non-performance and provisions The Spanish housing market post COVID-19
The outlook for the deficit: The calm before the storm
Institutional reforms: A source of productivity gains for the Spanish economy
WHAT MATTERS
Spanish and International Economic & Financial OutlookVOLUME 10 | number 4, July 2021
Orders or claims:
Funcas
Caballero de Gracia, 28 28013 Madrid (España) Teléfono: 91 596 54 81 Fax: 91 596 57 96 [email protected] www.funcas.es
ISSN: 2254 - 3880 9772254388005
9772254389002
SEFO is a bi-monthly Economic Journal published by Funcas and written by its experts, on the most pressing issues facing the Spanish and international economy / financial system today.
Readers can find this and archived issues of SEFO at www.funcas.es. Please contact us to request permission to republish an article at [email protected]
Electronic Edition
An electronic edition of this Journal is available at
http://www.funcas.es/Publicaciones
Board of Editors Carlos Ocaña Santiago Carbó José Félix Sanz Raymond Torres
Managing Editors Alice B. Faibishenko Juan Núñez
Board of Trustees Isidro Fainé Casas (President) José María Méndez Álvarez-Cedrón (Vice president)
Fernando Conlledo Lantero (Secretary) Carlos Egea Krauel
Miguel Ángel Escotet Álvarez Amado Franco Lahoz Manuel Menéndez Menéndez Pedro Antonio Merino García Antonio Pulido Gutiérrez Victorio Valle Sánchez Gregorio Villalabeitia Galarraga
Contact [email protected]
Web Site www.funcas.es Orders or Claims:
Funcas, publications
Tel.; +34-91-5965481, Fax: +34-91- 5965796, e-mail: [email protected] Printed in Spain
Editorial and Production Funcas
Caballero de Gracia, 28. 28013 Madrid (Spain)
Ownership and Copyright:
© Funcas 2012
ISSN print edition 2254-3899 ISSN electronic edition 2254-3880 Depósito Legal: M-10678-2012 Prints: Cecabank.
SEFO
SPANISH AND INTERNATIONAL ECONOMIC & FINANCIAL OUTLOOK
This page was left blank intentionally.
Letter from the Editors
hirteen years after the Global Financial Crisis (GFC), Spain was confronted with a new and unexpected economic shock caused by the pandemic, which had brought the economy to a halt. While both crises represented scenarios that were extremely adverse, the starting points and toolkits necessary to face them were quite distinct. For example, contrary to the case of the previous crisis, the financial and real estate sectors seem to be holding up surprisingly well in response to COVID-19.
Conversely, while Spain headed into the GFC in a relatively solid fiscal position, the government today has a much smaller margin to deal with the present crisis. Fortunately, the speed of the EU response relative to 2008 will help fill in this gap in discretionary fiscal support to underpin recovery.
Within this context, the July issue of Spanish and International Economic &
Financial Outlook (SEFO) takes a look at the better than expected performance across some areas of Spain’s public and private sectors throughout the pandemic, as well as highlights outstanding challenges.
This SEFO starts out with an assessment of the outlook for the Spanish recovery – first, broadly at the national level, and next, at the level of Spain’s provinces. Spain’s economy contracted by 0.4% in 1Q21, with all components of demand except investment in capital goods affected. However, second-
quarter indicators released to date point to a sharp turnaround. Jobs registered strong growth in May and June, while the manufacturing and services PMI readings rose to near-record levels. Although tourism seemed to be headed towards recovery in May, rising infection rates appear to have weighed on tourist numbers in June. Also, inflation rose from negative rates at the end of last year to 2.7% in June and is expected to rise above 3% by the end of 2021. The forecast for GDP growth in 2021 stands at 6.3% and at 5.8% for 2022. This growth pattern reflects the fact that consumers are spending their precautionary savings faster than anticipated, which should benefit growth this year at the expense of 2022 (the pent-up demand effect). Conversely, the protracted negotiations over the NGEU mean that those funds will have a bigger impact next year (without fully offsetting the pent-up demand effect). Meanwhile, the budget deficit will reach 6.2% in 2022. And, in the absence of measures, debt is expected to increase to nearly 117% of GDP by 2022.
The economic crisis in Spain has been characterised by a triple asymmetric impact in terms of timing, sector and region. That asymmetry explains the differing impacts on the economic front and will also shape the varying speeds of recovery over the coming months. Regarding timing, the crisis began in 2Q20, resulting in a quarterly contraction of 17.8%, with a 17.1% recovery in the following
T
quarter. Customer-facing sectors most affected by the restrictions saw GVA contract at a quarterly rate of 41.4% in 2Q20. Due to their reliance on tourism, the Balearic and Canary Islands, along with certain provinces along the Mediterranean coast, were the regions hit hardest. Our nowcasting model points to quarterly growth of over 3% in 2Q21. Importantly, those sectors most exposed to the restrictions are very labour intensive. As a result, they require less growth than other sectors to increase employment. Specifically, those sectors need activity to grow by 0.24% year-on- year to create jobs, while all other sectors require growth of at least 0.33% year-on-year to increase employment. [1] Nevertheless, the economic and job recovery will continue to be characterised by disparity across sectors and regions.
As regards the financial sector, with the worst of the pandemic seemingly behind us, we take stock of the impact on the banking sector to date.
In this respect, we analyse forbearance patterns at Spanish institutions, as well as the provisioning effort until the present, and what we can expect from banks going forward as they plan just how much of their capital will be tied up to secure solvency in the face of some anticipated uptick in loan non-performance.
Curiously, the COVID-19 crisis has yet to translate into an increase in Spanish banks’
non-performing loan (NPL) ratio. This is due to government measures implemented to mitigate the impact of the crisis, such as the furlough scheme and payment moratoria. However, there are signs of a deterioration in asset quality.
For example, the downward trend in forborne exposures (FBE) of recent years has ground to a halt. The fourth quarter 2020 data reveal an increase in the FBE ratio quarter-over-quarter, a trend worth monitoring in the coming months.
A comparison of Spanish banks’ forbearance rates to the rest of the eurozone also yields some notable insights. Prior to the crisis, Spanish banks’
exposure to forbearance had been falling more intensely than in Europe in recent years, with the gap narrowing 2.9 percentage points since 2015. That said, this ratio was still 0.5 percentage
share of 20%, this puts Spain at the top of the list of eurozone banking systems in terms of FBEs.
Finally, it is worth highlighting that in Spain the percentage of forborne exposures classified as non-performing is 11.5 percentage points above the eurozone average (50.2%) implying greater reliance on the refinancing route when borrowers run into trouble.
Also noteworthy was the significant provisioning effort made by Spanish banks even after the introduction of more accommodating regulation and accounting rules. However, provisioning started to slow in the first quarter of 2021 and there is a debate as to whether it ought to keep pace with 2020. Non-performing exposures should peak by early 2023, rising by around €40 billion between 2021 and 2022, with consumer credit hit especially hard in relative terms. If the provisioning effort of 1Q21 were maintained for all of 2021, the banks would recognise one-third of the estimated balance outstanding in the wake of the 2020 effort this year. Alternatively, the banks could step up their provisioning by 20-25% so that it is completed by the end of 2022.
We then drill down on another important sector where banks have exposures that has performed relatively well during the crisis – the real estate sector. Surprisingly, COVID-19’s effect on the Spanish real estate market has been limited. The pandemic occurred during the
“mature” housing cycle phase in terms of prices and transaction volumes. While GDP contracted by 17.8% year-on-year in the second quarter of 2020, the contractions in construction and property services amounted to 22.8% and 6.3%, respectively. Between June and September, both activities have recovered, registering growth of 24.8% and 6.4%, respectively. COVID-19 did, however, change the nature of the housing market, with rising demand for larger homes due to home working and declining demand for holiday homes thanks to mobility restrictions.
Importantly, significant disparity in house prices exists across Spain’s regions. As well, the pandemic had a greater adverse impact on prices
has shone a spotlight on housing affordability issues.
Subsequently, we examine the challenging outlook for Spain’s fiscal consolidation path, where, as in many countries, meaningful progress has been set back by the advent of the COVID-19 crisis, thus making achievement of fiscal targets all the more difficult over the near- to medium- term, particularly without much-needed fiscal reform.
Although Spain’s deficit came in lower than expected in 2020, it still ranked highest among the EU-27. While the government’s budget deficit forecast of 8.4% for 2021 is very similar to the Funcas consensus forecast of 8.2%, Spain faces a structural deficit in 2022 even higher than the 3.5% observed in 2019. This suggests the return to budget stability will be tough and requires a credible strategy for tackling the debt and deficit challenges to be defined in 2021. Such a strategy will need to cover until at least 2027 and will necessitate higher annual reductions than were being required of the country under the European fiscal rules before the pandemic (-0.65%). In the case of the regional authorities, the situation is more urgent as some of the income transferred in 2020 and 2021 to them by the central government will have to be returned in 2022 and 2023. Also, some regions will face significant financial stress and the reform of the regional financing regime needed to fix the problem remains bogged down. Lastly, the gradual ageing of the Spanish population will exert upward pressure on spending in health and social services, which between them account for over half of the regional budgets.
Finally, we close this issue on a more theoretical note, assessing Spain’s institutional framework, taking into consideration current strengths, shortcomings, and the need to implement reforms in this space if the country is to tackle declining productivity.
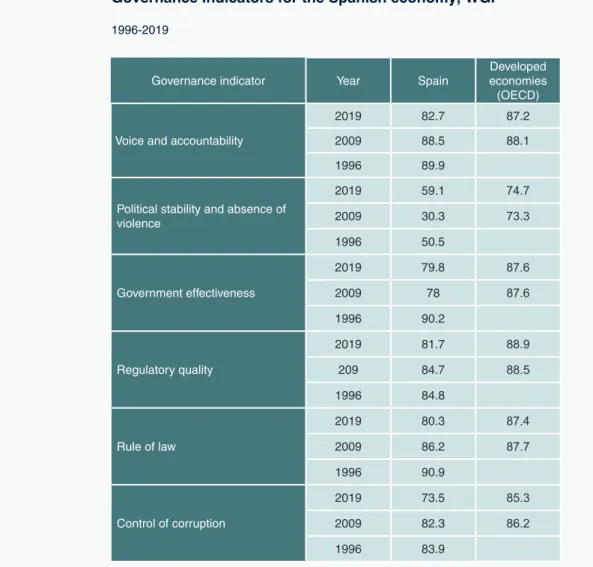
Between 1996 and 2017, total factor productivity in Spain decreased by 10.5%. Some evidence
trend in productivity. For example, the Global Competitiveness Report shows that Spain ranks 23rd on institutional quality compared to higher rankings in areas such as health and physical infrastructure. Notably, Spain is one of the EU countries in which institutional quality has deteriorated the most over the past two decades.
This is likely due to the real estate boom and period of sustained growth in abundant and cheap credit during the run up to the financial crisis. Upon closer examination, it becomes apparent that Spain’s institutional deficiencies are especially acute in areas such as transparency, the justice system, regulation, and coordination between government levels, which weigh on the country’s economic growth. However, one bright spot for Spain is the quality of its democracy, with the country continuing to fall within the Economist Intelligence Unit’s group of “full democracies”. In light of the COVID-19 crisis and the transition to a digital/green economy, it is especially pressing that Spain address its institutional vulnerabilities.
If left unaddressed, the absence of government efficiency could undermine Spain’s response to the upcoming changes anticipated in the international economy.
Notes
[1] If the full-time equivalents (FTEs) metric were used, the employment threshold would be higher at an estimated 0.8%.
This page was left blank intentionally.
Month Day Indicator / Event
August 3 Social Security registrants and official unemployment (July) 3 Tourist arrivals (June)
6 Industrial production index (June)
13 CPI (July)
19 Foreign trade report (June) 30 Retail trade (July)
30 Preliminary CPI (August)
31 Balance of payments monthly (June)
September 1 Tourist arrivals (July)
2 Social Security registrants and official unemployment (August) 9 ECB monetary policy meeting
10 Non-financial accounts, State (July)
10 Non-financial accounts, Regional Governments and Social Security (June)
10 Eurogroup meeting
10 Industrial production index (July)
14 CPI (August)
20 Foreign trade report (July)
23 Balance of payments quarterly (2nd quarter)
23 Quarterly National Accounts (2nd quarter, 2nd release) 29 Preliminary CPI (September)
30 Retail trade (August)
30 Non-financial accounts, State (August)
30 Non-financial accounts, Regional Governments and Social Security (July)
30 Non-financial accounts, General Government (2nd quarter) 30 Quarterly Non-financial Sector Accounts (2nd quarter) 30 Balance of payments monthly (July)
This page was left blank intentionally.
The Spanish economy in recovery mode:
Opportunities and challenges
Recent indicators point to a vigorous economic recovery for Spain, with GDP set to grow by 6.3% this year despite rising infection rates, supply chain bottlenecks and a slower than anticipated return of tourists. The challenge is to maintain the expansionary phase, which involves implementing the reforms foreseen in Next Generation EU and tackling the legacy of unemployment and public debt.
Raymond Torres and María Jesús Fernández
COVID-19 and its asymmetric impact in Spain by province: Recent trends and projections The COVID-19 crisis in Spain has been marked by a triple asymmetrical impact in terms of timing, sector and region.
While those sectors and regions hardest hit by the crisis should post strong growth, the recovery will likely be characterised by disparity across sectors and regions in Spain.
María Romero, Juan Sosa and Javier Serrano, A.F.I.
5
15
Forbearance patterns at Spanish banks: Impact of COVID-19
Government support measures such as the furlough scheme and payment moratoria have artificially held down a rise in Spanish banks’ NPL ratios. However, recent trends in forborne exposures relative to Spain’s previous performance and that of the eurozone average suggest NPLs could rise once these measures expire.
Joaquín Maudos
23
The outlook for the deficit: The calm before the storm
It will require a concerted effort to bring down Spain’s deficit and debt levels, involving higher annual reductions than those prior to the pandemic. However, it is not just the central government which needs to address this issue, with many regional governments facing financial challenges ahead.
Santiago Lago Peñas
47
The Spanish housing market post COVID-19 While COVID-19 did lead to an initial correction in Spain’s housing market, costs of home purchases have continued to rise, albeit with some differences across regions and type of housing.
This has furthered a debate around housing affordability, including some misguided calls for rent controls.
Santiago Carbó Valverde and Francisco Rodríguez Fernández
39
Decoupling between
non-performance and provisions
Surprisingly, Spain saw its banks’ non-performance ratio fall during the crisis alongside a significant provisioning effort.
However, if banks are to absorb their pandemic-related losses by the end of 2022, they will need to step up their provisioning by 20-25% compared to 1Q2021 levels.
Marta Alberni, María Rodríguez and Federica Troiano, A.F.I.
31
Regulation and Economic Outlook
Recent key developments in the area of Spanish financial regulation
69
Prepared by the Regulation and Research Department of the Spanish Confederation of Savings Banks
Spanish economic forecasts panel: July 2021
75
Funcas Economic Trends and Statistics Department
Key Facts
Economic Indicators
83
Financial System Indicators
121
Social Indicators
127
gains for the Spanish economy
Spain’s declining total factor productivity is partially attributed to institutional weaknesses in areas such as transparency, the justice system, regulation, and government coordination. If left unaddressed, it could undermine Spain’s successful transition to the digital/green economy.
Xosé Carlos Arias
57
This page was left blank intentionally.
The Spanish economy in
recovery mode: Opportunities and challenges
Recent indicators point to a vigorous economic recovery for Spain, with GDP set to grow by 6.3% this year despite rising infection rates, supply chain bottlenecks and a slower than anticipated return of tourists. The challenge is to maintain the expansionary phase, which involves implementing the reforms foreseen in Next Generation EU and tackling the legacy of unemployment and public debt.
Abstract: Spain’s economy contracted by 0.4% in 1Q21, with all components of demand except investment in capital goods affected.
However, second-quarter indicators released to date point to a sharp turnaround. Jobs registered strong growth in May and June, while the manufacturing and services PMI readings rose to near-record levels. Although tourism seemed to be headed towards
recovery in May, rising infection rates appear to have weighed on tourist numbers in June.
Also, inflation rose from negative rates at the end of last year to 2.7% in June and is expected to rise above 3% by the end of 2021.
The forecast for GDP growth in 2021 stands at 6.3% and at 5.8% for 2022. This growth pattern reflects the fact that consumers are spending their precautionary savings faster
Raymond Torres and María Jesús Fernández
than anticipated, which should benefit growth this year at the expense of 2022 (the pent-up demand effect). Conversely, the protracted negotiations over the NGEU mean that those funds will have a bigger impact next year (without fully offsetting the pent-up demand effect). Meanwhile, the budget deficit will reach 6.2% in 2022. And, in the absence of measures, debt is expected to increase to nearly 117% of GDP by 2022.
Recent performance of the Spanish economy
After a stagnation in the fourth quarter of 2020, Spanish GDP contracted by 0.4% in 1Q21. This was due to the imposition of new restrictions to curb the third wave of the pandemic, and also the effects of the January snowstorm. The contraction affected all components of demand except for investment in capital goods, which has been recovering steadily since the third quarter of last year.
By sector, only services –both public and private– reported growth in gross value added in the first quarter. However, the various sub-sectors performed very unevenly.
For example, according to the services sector turnover index, the retail, hospitality and air travel sectors contracted sharply.
As for jobs, although the number of hours worked declined by 2%, the number of job holders, as per the labour force survey, registered growth of 0.5%, pushing unemployment down to 16%.
In contrast with the stalled economic recovery in the fourth quarter of 2020 and the first quarter of 2021, second-quarter indicators released to date point to a sharp turnaround, particularly in May and June, fuelled by the
of emergency, and accelerating vaccination levels. Jobs registered strong growth in both months, while the number of people brought back to work from furlough accelerated.
The manufacturing and services PMI readings rose to near-record levels, while the confidence readings, albeit with ups and downs, are back above pre-pandemic levels in all sectors, including construction and retail (Table 1). This suggests that the impact of supply shortages of certain commodities and microchips, has, so far, been moderate.
Other indicators, such as the number of overnight stays, passenger air travel and tourist arrivals, registered strong growth in May (the last month for which those readings are available), coinciding with the relaxation of mobility restrictions in most European countries.
As for consumption, retail sales (similarly based on data to May) growth remains negative. Spending remains below fourth- quarter 2020 figures. That may be because the growth in spending was largely channelled into services as restrictions on activities and movement were eased. The sharp rebound in hotel stays by Spanish residents, which in May topped 4Q20 levels, corroborates that thesis.
In addition, domestic credit card spending during the first week of July was up 7% year- on-year, underpinned by very significant growth in restaurant and tourism spending, while spending on foreign cards increased 70%, [1] confirming that both domestic and foreign tourism consumption started to recover strongly towards the end of the quarter.
Nevertheless, as from the end of June, the tourism sector may have already begun to feel the effects of the surge in transmission due
“ Although the number of hours worked declined by 2%, the number
of job holders registered growth of 0.5%, pushing unemployment
down to 16%. ”
flight bookings to Spain were 5.2% above levels for the same week of 2019 (they had trended around 70% below in the early months of the year). However, by the end of the month, bookings were down 23.4% compared to the same period of 2019. [2]
As for exports, since the sharp contraction registered in January, the trend has been very positive. In April, the last month for which export figures are available, volumes in constant prices were back above pre-crisis levels.
Table 1 Economic indicators
Comparison between the most recent data available and December 2020 and February 2020
Growth since
Dec-20, in %Growth since Feb-20, in %
Industrial production (May index) 5.3 4.0
Services activity (May index) 2.3 -9.2
Cement consumption (May) 3.4 1.7
Social Security contributors (June) 0.9 -1.2 Contributors net of retention mechanisms
(June) 3.3 -4.8
Exports of goods (June) 8.1 8.2
Airline passengers (May) 10.3 -76.7
Tourist arrivals (May) 7.1 -83.5
Tourist expenditure (May) 17.2 -83.6
Retail sales (May) -1.5 -4.2
Overnight stays, Spanish residents (May) 70.6 -53.9 Overnight stays, overseas residents (May) 410.5 -72.7
June-21 December-20 February-20
Composite PMI 62.4 48.7 51.8
Manufacturing PMI 60.4 51.0 50.4
Services PMI 62.5 48.0 52.1
Economic sentiment indicator 107.2 91.5 103.2
Industrial confidence index 0.2 -10.6 -4.0
Services confidence index 17.9 -24.3 9.9
Retail sales confidence index 7.6 -22.5 1.9
Construction sector confidence index 4.6 -14.6 -9.9
Consumer confidence index -11.7 -23.1 -7.9
Note: For PMI, a reading of over 50 indicates growth; a reading of less than 50 indicates contraction.
The rates of change are calculated using the deseasonalised series.
Sources: INE, Ministry of Inclusion, Social Security and Migration, Customs, Aena, Markit Economics, EC.
The balance of payments remained in surplus, a remarkable development considering the collapse in tourism receipts. The first-quarter external accounts presented a deficit of 2 billion euros but the first quarter tends to be seasonally adverse.
One of the most noteworthy traits of Spain’s recent economic performance is the rise in inflation, from negative rates at the end of last year to 2.7% in June. For now, the rise in the headline rate has not affected core inflation, which remains subdued, and is attributable mainly to the reversal of the oil price correction sustained during the early months of the pandemic, as well as more expensive electricity. From August, we will see new base effects, this time in services, so that inflation is expected to exceed 3%. That may be exacerbated by the sharp increases in commodity prices in recent months, as is already apparent in the pronounced increase in the industrial price index.
The first-quarter budget deficit was nearly 5 billion euros higher year-on-year. Note, however, that January and February of 2020 were not yet affected by the pandemic. The April figures already revealed a noteworthy change in trend, thanks mainly to the favourable year-on-year comparison, as much of the economy had come to a halt in April 2020. The resumption of the economic recovery at the start of the second quarter of this year is another factor at work. Tax revenues registered year-on-year growth of
46.8%, while expenditure eased by 9.7%, so that the accumulated deficit for the first four months of the year was smaller than in the same period of 2020.
Forecasts for 2021 and 2022
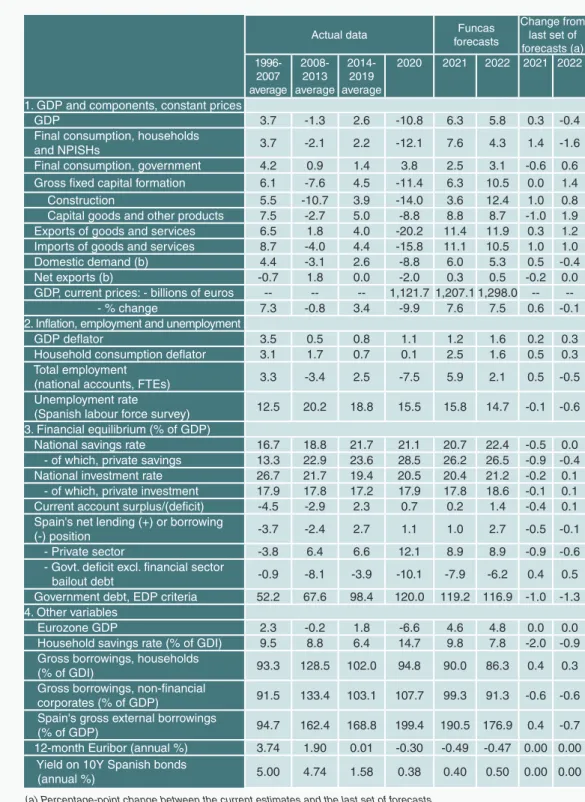
The economic recovery initiated after the weak start to the year gained traction during the second quarter. This occurred alongside a reduction in uncertainty thanks to higher vaccination rates, the release of pent-up demand accumulated during the crisis, and the recovery in the global economy. As a result, the forecast for GDP growth this year stands at 6.3%, up 0.3 percentage points from the May forecasts. The forecast for 2022 is for growth of 5.8%, down 0.4 percentage points from May, due to the loss of momentum in some of the main drivers of the rebound (Tables 2 and 3).
The revised forecasts –upward in 2021 and downward in 2022– reflect the trend in domestic demand, which is expected to contribute 6 percentage points to GDP growth in 2021, up 0.5 percentage points from May, and 5.3 percentage points in 2022, down 0.4 percentage points. The main factor is the ‘pent-up demand’ effect. It appears that the precautionary savings accumulated during the pandemic are being wound down faster than expected, a phenomenon also being observed in countries further along the recovery path, such as the US. As a result, the boost from private consumption and construction (the aggregates that benefit the
“ One of the most noteworthy traits of Spain’s recent economic performance is the rise in inflation, from negative rates at the end of last year to 2.7% in June. ”
“ The forecast for 2022 is for growth of 5.8%, down 0.4 percentage
points from May, due to the loss of momentum in some of the main
drivers of the rebound. ”
Table 2 Economic forecasts for Spain, 2021-2022
Annual rate of change in percentages, unless otherwise indicated
Actual data Funcas
forecasts
Change from last set of forecasts (a) 1996-
2007 average
2008- 2013 average
2014- 2019 average
2020 2021 2022 2021 2022
1. GDP and components, constant prices
GDP 3.7 -1.3 2.6 -10.8 6.3 5.8 0.3 -0.4
Final consumption, households
and NPISHs 3.7 -2.1 2.2 -12.1 7.6 4.3 1.4 -1.6
Final consumption, government 4.2 0.9 1.4 3.8 2.5 3.1 -0.6 0.6
Gross fixed capital formation 6.1 -7.6 4.5 -11.4 6.3 10.5 0.0 1.4
Construction 5.5 -10.7 3.9 -14.0 3.6 12.4 1.0 0.8
Capital goods and other products 7.5 -2.7 5.0 -8.8 8.8 8.7 -1.0 1.9
Exports of goods and services 6.5 1.8 4.0 -20.2 11.4 11.9 0.3 1.2
Imports of goods and services 8.7 -4.0 4.4 -15.8 11.1 10.5 1.0 1.0
Domestic demand (b) 4.4 -3.1 2.6 -8.8 6.0 5.3 0.5 -0.4
Net exports (b) -0.7 1.8 0.0 -2.0 0.3 0.5 -0.2 0.0
GDP, current prices: - billions of euros -- -- -- 1,121.7 1,207.1 1,298.0 -- --
- % change 7.3 -0.8 3.4 -9.9 7.6 7.5 0.6 -0.1
2. Inflation, employment and unemployment
GDP deflator 3.5 0.5 0.8 1.1 1.2 1.6 0.2 0.3
Household consumption deflator 3.1 1.7 0.7 0.1 2.5 1.6 0.5 0.3
Total employment
(national accounts, FTEs) 3.3 -3.4 2.5 -7.5 5.9 2.1 0.5 -0.5
Unemployment rate
(Spanish labour force survey) 12.5 20.2 18.8 15.5 15.8 14.7 -0.1 -0.6 3. Financial equilibrium (% of GDP)
National savings rate 16.7 18.8 21.7 21.1 20.7 22.4 -0.5 0.0
- of which, private savings 13.3 22.9 23.6 28.5 26.2 26.5 -0.9 -0.4
National investment rate 26.7 21.7 19.4 20.5 20.4 21.2 -0.2 0.1
- of which, private investment 17.9 17.8 17.2 17.9 17.8 18.6 -0.1 0.1 Current account surplus/(deficit) -4.5 -2.9 2.3 0.7 0.2 1.4 -0.4 0.1 Spain's net lending (+) or borrowing
(-) position -3.7 -2.4 2.7 1.1 1.0 2.7 -0.5 -0.1
- Private sector -3.8 6.4 6.6 12.1 8.9 8.9 -0.9 -0.6
- Govt. deficit excl. financial sector
bailout debt -0.9 -8.1 -3.9 -10.1 -7.9 -6.2 0.4 0.5
Government debt, EDP criteria 52.2 67.6 98.4 120.0 119.2 116.9 -1.0 -1.3 4. Other variables
Eurozone GDP 2.3 -0.2 1.8 -6.6 4.6 4.8 0.0 0.0
Household savings rate (% of GDI) 9.5 8.8 6.4 14.7 9.8 7.8 -2.0 -0.9 Gross borrowings, households
(% of GDI) 93.3 128.5 102.0 94.8 90.0 86.3 0.4 0.3
Gross borrowings, non-financial
corporates (% of GDP) 91.5 133.4 103.1 107.7 99.3 91.3 -0.6 -0.6
Spain's gross external borrowings
(% of GDP) 94.7 162.4 168.8 199.4 190.5 176.9 0.4 -0.7
12-month Euribor (annual %) 3.74 1.90 0.01 -0.30 -0.49 -0.47 0.00 0.00 Yield on 10Y Spanish bonds
(annual %) 5.00 4.74 1.58 0.38 0.40 0.50 0.00 0.00
(a) Percentage-point change between the current estimates and the last set of forecasts.
(b) Contribution to GDP growth in percentage points.
Sources: 1996-2020: INE and Bank of Spain; Forecasts 2021-2022: Funcas.
Table 3 Quarterly forecasts for the Spanish economy
Percentage change at constant prices, unless otherwise indicated Forecasts in shaded area
Period GDP Private
consumption Public
consumption GFCF Exports Imports Contrib. to growth
GDP (1) Employ.
(2) Unemp.
rate Domestic
demand
Net exports
2014 1.4 1.7 -0.7 4.1 4.5 6.8 1.9 -0.5 1.0 24.4
2015 3.8 2.9 2.0 4.9 4.3 5.1 3.9 -0.1 3.2 22.1
2016 3.0 2.7 1.0 2.4 5.4 2.6 2.0 1.0 2.8 19.6
2017 3.0 3.0 1.0 6.8 5.5 6.8 3.1 -0.2 2.9 17.2
2018 2.4 1.8 2.6 6.1 2.3 4.2 3.0 -0.5 2.6 15.3
2019 2.0 0.9 2.3 2.7 2.3 0.7 1.4 0.6 2.3 14.1
2020 -10.8 -12.1 3.8 -11.4 -20.2 -15.8 -8.8 -2.0 -7.5 15.5
2021 6.3 7.6 2.5 6.3 11.4 11.1 6.0 0.3 5.9 15.8
2022 5.8 4.3 3.1 10.5 11.9 10.5 5.3 0.5 2.1 14.7
QoQ change, in % Unemp.
rate
1Q20 -5.4 -6.5 1.1 -4.9 -7.5 -5.8 -4.6 -0.8 -2.0 14.4
2Q20 -17.8 -19.7 0.6 -20.5 -34.0 -28.6 -15.2 -2.6 -17.7 15.3
3Q20 17.1 20.9 1.3 21.5 31.1 26.8 15.4 1.6 16.1 16.3
4Q20 0.0 0.0 1.3 1.0 4.6 6.2 0.4 -0.4 1.2 16.1
1Q21 -0.4 -0.6 -0.1 -0.8 -1.4 -1.3 -0.4 0.0 1.4 16.0
2Q21 2.0 2.5 0.0 0.7 4.3 3.1 1.5 0.4 0.2 15.9
3Q21 3.8 4.4 0.9 2.3 5.7 3.8 3.1 0.6 1.7 15.8
4Q21 1.9 1.1 1.2 3.4 3.1 2.0 1.6 0.4 0.5 15.7
1Q22 0.9 0.4 0.9 2.8 3.1 3.2 0.9 0.0 0.4 15.5
2Q22 0.7 0.3 0.6 2.8 1.7 2.3 0.9 -0.2 0.4 14.7
3Q22 0.7 0.2 0.5 2.0 1.6 1.6 0.6 0.0 0.3 14.4
4Q22 0.5 0.2 0.5 1.7 0.8 1.0 0.6 -0.1 0.1 14.3
(Year-on-year change in %)
1Q20 -4.3 -5.9 3.5 -5.1 -5.8 -5.3 -4.0 -0.3 -0.6 --
2Q20 -21.6 -24.3 3.3 -24.3 -38.7 -32.6 -18.7 -2.9 -18.5 --
3Q20 -8.6 -9.2 4.0 -9.0 -19.8 -15.7 -6.8 -1.8 -5.6 --
4Q20 -8.9 -9.2 4.5 -7.2 -16.3 -9.4 -6.3 -2.6 -5.2 --
1Q21 -4.2 -3.5 3.2 -3.2 -10.7 -5.2 -2.2 -2.0 -1.9 --
2Q21 18.8 23.1 2.6 22.6 41.0 37.0 17.4 1.4 19.4 --
3Q21 5.4 6.3 2.2 3.2 13.7 12.1 4.7 0.6 4.5 --
4Q21 7.4 7.5 2.0 5.6 12.0 7.7 5.9 1.5 3.8 --
1Q22 8.9 8.5 3.0 9.4 17.1 12.7 7.4 1.5 2.8 --
2Q22 7.5 6.2 3.6 11.7 14.2 11.8 6.7 0.9 2.9 --
3Q22 4.3 2.0 3.2 11.3 9.8 9.4 4.1 0.2 1.6 --
4Q22 2.8 1.1 2.5 9.5 7.3 8.4 3.1 -0.2 1.2 --
(1) Contribution to GDP growth in percentage points. (2) Full-time equivalent jobs.
Source: INE and Funcas (forecasts).
most from the pent-up demand effect) have been revised significantly higher for 2021 and then lower for 2022 in the case of the former (due to the premature depletion of that phenomenon).
On the other hand, some of the growth in public spending and investment that had been anticipated in 2021 has been pushed back to next year, reflecting the protracted negotiations and approval for the Next Generation EU (NGEU). The current forecasts assume the execution of 10 billion euros of NGEU funds in 2021 (down 4 billion euros from the May forecasts) and of 26 billion euros in 2022 (unchanged). [3] Those revisions do not, however, offset the pent-up demand effect.
International trade is expected to perform well both years, in line with our previous sets of forecasts. The momentum in goods exports should continue in 2021, in line with the trend-improvement in Spanish firms’
market share gains abroad, going on to slow in 2022, when the global recovery is expected to ease. Tourism service exports, meanwhile, should recover in tandem with the gradual resumption of mobility. However, there is significant uncertainty regarding the impact of the virus mutations on travel. Flows are extraordinarily volatile, as many travel and hotel bookings include cancellation clauses related with pandemic developments. For now, we have revised our forecasts for the recovery in tourism downwards as a result of the rapid spread of the Delta variant. Tourism is currently forecast to detract 0.3 percentage points from GDP growth in 2021. Overall, net exports are projected to contribute 0.3 points to growth in 2021 (down from an estimated 0.5 points in May) and 0.5 points in 2022 (unchanged).
The intensity of the global recovery is expected to continue to create bottlenecks in certain
strategic supplies, including semiconductors, metals and energy products. All of which will weigh on the recovery, particularly in the more exposed sectors such as the automotive industry, while putting upward pressure on production costs and inflation. The personal consumption expenditure deflator is expected to rise to 2.5% in 2021, up half a percentage point from our last forecasts. The theoretical easing of the bottlenecks should facilitate a reduction in inflation in 2022, to an estimated 1.6% (nevertheless up 0.3 percentage points from our last set of forecasts). Assuming that the increase in the cost of supplies proves transitory, internal prices (the GDP deflator) and salaries would remain under control and therefore act as a buffer against the chronification of inflation.
Despite the deterioration in the terms of trade, Spain will continue to present a current account surplus, which should widen as international tourism recovers. Moreover, Spain is expected to receive sizeable sums under the NGEU programme, fuelling a growing net lending position. That outcome reflects the sharp rise in national savings, to record levels in terms of GDP.
The recovery will trickle down to the job market. We are forecasting job creation of close to 500,000 in total over the two years (on a seasonal-adjusted basis). That figure includes the employees on furlough that are brought back to work, which we estimate at around 40% of the 450,000 people still on the scheme as of the end of June.[4] The remaining 60% are expected to become unemployed or economically inactive. As a result, employment would be back at pre-crisis level by the end of 2022 but with a higher number of job-seekers and unemployment rate.
The recovery will also benefit the deficit, thanks to growth in revenue as economic activity
“ The personal consumption expenditure deflator is expected to
rise to 2.5% in 2021, up half a percentage point from our last
forecasts. ”
rebounds and a reduction in pandemic- related expenditure needs. Meanwhile, the ECB’s debt purchases, coupled with low policy rates, will continue to alleviate the state’s financial burden, although we are forecasting a gradual increase in Treasury bond yields.
Nevertheless, the deficit will reach 6.2% in 2022, underpinned by a significant structural deficit, with no information at the time of writing on whether measures to tackle the issue in the medium- and longer-term will be introduced. Public debt will also remain high, at close to 117% of GDP.
Risks
Short-term, the big unknown remains the evolution of the pandemic, particularly the reaction to the rapid spread of new variants
among the young, unvaccinated segments of the population. The next few weeks will be telling in this respect. Firstly, there is the forecast volume of tourism receipts. Our projections assume the influx of close to 8.5 billion euros of tourism revenues this summer, which is 40% of the level recorded in the same period of 2019. However, the introduction of new travel restrictions in issuer markets could stymie those expectations, weakening an overly indebted business fabric without room for manoeuvre. All of which is exacerbated by the surprising delay in the deployment of the direct transfers for businesses decreed in March, in contrast with the agility with which other European countries have rolled out similar support schemes. Secondly, a spike in case numbers could affect confidence and undermine consumption and investment.
“ Our forecasts assume the influx of close to 8.5 billion euros of tourism revenues this summer, which is 40% of the level recorded in the same period of 2019. ”
-7.9
-6.2
-5.0 -4.5 -4.7 -4.7 -4.5
-8.2
-6.9
-5.9 -5.5 -5.3 -5.0 -4.6
-9.0 -8.0 -7.0 -6.0 -5.0 -4.0 -3.0
2021 2022 2023 2024 2025 2026 2027
Including NGEU Excluding NGEU
Exhibit 1 Public deficit
Percentage of GDP
Note: The deficit ‘Including NGEU’ reflects the direct impact on revenue and expenditure of the NGEU funds and the indirect impact on GDP.
Source: Funcas.
The rise in production costs is another risk in the short-term. Should costs remain inflated for longer than we are forecasting, households and businesses could face a significant erosion of their purchasing power, which would weigh on demand.
Moreover, if inflation expectations become
unanchored, the ECB could feel obliged to tighten monetary conditions, which would translate into higher financial costs for the more indebted governments and sectors.
Fortunately, the ECB’s recent move to make its inflation targets more flexible has pushed back that prospect for now. [5]
95.5 120.0
119.2
116.9 116.0 116.4 118.3 120.0 121.3
90 95 100 105 110 115 120 125
2019 2020 2021 2022 2023 2024 2025 2026 2027
Exhibit 2 Public debt
Percentage of GDP
Source: Bank of Spain and Funcas.
50.4
48.5 49.0 49.0
49.6 50.8
51.4 51.5 51.6
51.8
14.1
15.5 15.8
14.7
12.5
11.2 10.9
10.5 9.8
8 9 10 11 12 13 14 15 16 17
48.0 48.5 49.0 49.5 50.0 50.5 51.0 51.5 52.0
2019 2020 2021 2022 2023 2024 2025 2026 2027
Employment rate (left) Unemployment rate (right)
Exhibit 3 Rates of unemployment and employment
Percentage
Source: INE and Funcas.
Longer-term, the Spanish economy faces the risk of hysteresis effects in terms of chronic public deficits and unemployment, which have been exacerbated by the pandemic. In a no-policy-change scenario, which assumes continued ultra-low interest rates and full execution of the 70 billion euros of transfers expected under the NGEU programme (an assumption that implies significant improvements in project management and allocation mechanisms), the public deficit would still be around 4.5% of GDP at the end of the European budget period, i.e., 2027 (Exhibit 1). And public debt would stagnate at 120% of GDP, i.e., almost 25 points above pre- pandemic levels (Exhibit 2). Spain is therefore vulnerable to potential monetary policy tightening or the reactivation of the European fiscal rules, which would require drastic cuts over a relatively limited period of time.
As for jobs, although the unemployment rate should come down, the gap relative to Spain’s main EU partners could widen (Exhibit 3). Germany and other central and northern European countries are expected to approach full employment, while others, like Portugal, have embarked on reforms to tackle labour market duality and enhance skills. The reforms contemplated in Spain’s recovery plan are therefore urgent. That is the only way to improve job prospects for those most affected by the crisis, including youth and other groups that have historically faced difficulties in finding decent work.
Notes
[1] Monitor de consumo | CaixaBank Research.
[2] Global Covid-19 Insight Dashboard for Travel Marketers / Sojern.
[3] The execution forecast –of 10 billion euros in 2021– reflects the spending programmes committed to this year against the European funds. That figure is less than the total European transfers expected this year –9 billion euros in July and another 10 billion euros in December – which are classified as non-financial income for public account purposes. Therefore, the lag between the receipt and spending of the NGEU funds could translate into a reduction in the public deficit in 2021 and an increase in subsequent years.
[4] For the purposes of these forecasts, we have assumed that those currently on furlough in the restaurant, hospitality and leisure sectors (approximately 40% of the total) will be re-employed once mobility is fully back to normal. However, we assume that employees in sectors that have fully recovered and remain on furlough (the remaining 60%) will not go back to their jobs, as they may be employed in unviable businesses.
[5] Refer to the ECB’s monetary policy strategy statement: https://www.ecb.europa.eu/home/
search/review/html/ecb.strategyreview_
monpol_strategy_statement.en.html
Raymond Torres and María Jesús Fernández. Funcas
COVID-19 and its asymmetric impact in Spain by province:
Recent trends and projections
The COVID-19 crisis in Spain has been marked by a triple asymmetrical impact in terms of timing, sector and region. While those sectors and regions hardest hit by the crisis should post strong growth, the recovery will likely be characterised by disparity across sectors and regions in Spain.
Abstract: The economic crisis in Spain has been characterised by a triple asymmetric impact in terms of timing, sector and region.
That asymmetry explains the differing impacts on the economic front and will also shape the varying speeds of recovery over the coming months. Regarding timing, the crisis began in 2Q20, resulting in a quarterly contraction of 17.8%, with a 17.1% recovery in the following quarter. Customer-facing sectors most
affected by the restrictions saw GVA contract at a quarterly rate of 41.4% in 2Q20. Due to their reliance on tourism, the Balearic and Canary Islands, along with certain provinces along the Mediterranean coast, were the regions hit hardest. Our nowcasting model [1]
points to quarterly growth of over 3% in 2Q21.
Importantly, those sectors most exposed to the restrictions are very labour intensive. As a result, they require less growth than other María Romero, Juan Sosa and Javier Serrano
sectors to increase employment. Specifically, those sectors need activity to grow by 0.24%
year-on-year to create jobs, while all other sectors require growth of at least 0.33%
year-on-year to increase employment. [2]
Nevertheless, the economic and job recovery will continue to be characterised by disparity across sectors and regions.
Introduction
The COVID-19 pandemic has been like a tidal wave for the economy, with knock-on effects on a scale not seen in the post-war period. The extent to which productive activity ground to a halt was unprecedented, with the crisis engulfing practically the whole world.
The disruption to economic activity resulted in persistent supply side shocks that are very likely to give way to a demand shock. Services and durable goods consumption are the economic areas most sensitive to economic shocks and the hardest to reconstitute in an uncertain environment.
The economic crisis in Spain has been characterised by a triple asymmetric impact: timing, sectoral and regional. That asymmetry explains the differing impacts on the economic front and will also shape the varying speeds of recovery over the coming months. This paper attempts to quantify that socio-economic impact by focusing on the recent trend and outlook at the individual provincial level in Spain.
Triple asymmetry
The asymmetry of the economic crisis caused by COVID-19 has so far manifested in three key ways:
■ Timing. The onset of the COVID-19 pandemic during the second half of March 2020 drove a particularly severe economic contraction in 2Q20. Since
then, the economy has been trying to catch up on the volume of activity lost in just a few weeks. According to Spain’s National Statistics Office, the INE, GDP contracted by a quarterly rate of 17.8% in 2Q20, going on to rebound 17.1% the following quarter.
■Sectoral. The sectors most sensitive to the business restrictions are those requiring social contact, which has translated into particularly severe contractions in revenue and employment (albeit contained by the furlough scheme) compared to other sectors of the economy. These sectors include retail, hospitality, transport (particularly air travel) and leisure and cultural activities.
Those sectors were deemed ‘non-essential’
when Spain initiated the state of emergency on March 14th, 2020. Our estimates suggest that on aggregate those sectors’ GVA contracted at a quarterly rate of 41.4%
in 2Q20, going on to rebound by 50.9% in 3Q20 (leaving it 12% below pre-pandemic levels). The other sectors experienced a much smaller rebound (12% QoQ in 3Q20), having contracted by relatively less the previous quarter.
■Regional. Because of their exposure to the hardest-hit sectors and the seasonality of some of the above sectors, the provincial economies most affected have been the Balearic and Canary Islands, along with certain provinces along the Mediterranean coast (Map 1). The Balearic Islands was particularly affected (its economy contracted by 17.4% on average in 2020), evidencing its reliance on the tourism sector and related activities. According to Exceltur (2014), the tourism sector is responsible for 44.8% of the regional economy between direct, indirect and induced effects, which is significantly above the national average (12.4% in 2019) and even other regions heavily exposed to the sector (the equivalent percentage in the Canary Islands was 35% in 2018).
“ According to the INE, GDP contracted by a quarterly rate of 17.8% in
2Q20, going on to rebound 17.1% the following quarter. ”
The intensity and uniformity of the economic recovery across Spain’s regions will determine the territorial cohesion resulting from this crisis and the economic policies best suited to addressing a potential increase in inequalities.
The trend in social security contributors in 2Q21, coupled with other leading indicators (new car registrations, manufacturing and service PMIs, exports and imports of goods, etc.), suggests that the Spanish economy is set to rebound sharply, offsetting the weak start to the year (1Q21 GDP: -0.4%). More specifically, our model points to quarterly growth of over 3% in 2Q21. Judging by the differences at the sector level and in infection rates in each region, that growth is likely to be heterogeneous at the provincial level.
According to our sector-provincial model, the provincial economies set to perform the best
in 2Q21 will be those that saw their GDP and employment suffer the most (discounting employees affected by furloughs) in 1Q21 and all of 2020 (Exhibit 2). The Balearic and Canary Islands are expected to report significant economic growth in 2Q21, underpinned by the bright outlook for their tourism sectors during the summer season. Although tourism will remain well below pre-pandemic levels, the sector will make a positive contribution to growth in those regions.
One development that could have accelerated the recovery in the Balearic Islands was the recent decision by the UK to include the islands on its green list for travel (the UK accounts for over 20% of overseas visitors to Spain). However, due to rising infection rates, the British government has moved the Balearic Islands to the amber list. The Canary Islands too will have to wait until further reviews.
Map 1 Impact of the COVID-19 crisis on GVA at the provincial level in 2020
YoY change, percentage
Sources: INE, Ministry of Inclusion, Social Security and Migration, Afi.
“ Our model points to quarterly growth of over 3% in 2Q21. ”
The provincial economies’ productive specialisation has had economic consequences.
Many establishments have remained closed as they continue to wait for the recovery to consolidate and for more tourists to arrive, particularly from abroad, before reopening.
As economic activity begins to take off, employment should grow. The first milestone is likely to be the re-engagement of those currently on furlough, before going on the create jobs with greater intensity, assuming the recovery pans out. Notably, the sectors
y = -6,2733x + 0,4214 R² = 0,7104
0,0 0,2 0,4 0,6 0,8 1,0 1,2 1,4 1,6 1,8
-20% -15% -10% -5% 0%
Index of specialisation in sectors affected by the restrictions imposed to curb the spread of COVID-19, 2019
GDP (YoY %), 2020
Exhibit 1 GDP and index of specialisation in sectors affected by the restrictions imposed to curb the spread of COVID-19 by province
Sources: INE, Ministry of Inclusion, Social Security and Migration, Afi.
0%
1%
2%
3%
4%
5%
6%
-20% -15% -10% -5% 0%
GDP (YoY %), 2Q21 Afi forecasts
GDP (YoY %), 2020
Exhibit 2 GDP by province: Year-on-year change in 2020 and 2021
Sources: INE, Ministry of Inclusion, Social Security and Migration, Afi.
1.8 1.6 1.4 1.2 1.0 0.8 0.6 0.4 0.2 0.0
y=-6.2733x+0.4214 R2=0.7104
most affected by the restrictions continue to account for over half of the total on furlough but were also the sectors to bring the greatest number people out of furlough in May.
Those sectors most exposed to the restrictions are very labour intensive. As a result, they require less growth than other sectors to increase employment. This means the pace of the recovery in jobs lost or furloughed could be faster than initially anticipated. Analysing the year-on-year growth in GDP and social security contributors in 2010-2019 yields an estimate of the rate of GDP growth required to generate jobs, i.e., the employment threshold. This is what is known as Okun’s Law (Exhibit 3). The sectors that are more sensitive to the COVID-19 restrictions need activity to grow by 0.24%
year-on-year to create jobs, while all other sectors require growth of at least 0.33% year- on-year to increase employment. Note that this exercise was conducted using social security contributor numbers, where the year-on-year movements are more pronounced than in full- time equivalents (FTEs), which is the metric that should be used in theory to calculate the employment threshold. If the FTEs metric were used, the employment threshold would be higher at an estimated 0.8%. However, that data is not broken down at the sector level to two digits (NACE codes).
Nevertheless, the growth forecast for the coming years will continue to be marked by disparity at both the sector and regional levels, potentially exacerbating existing inequalities. However, that heterogeneity is
“ The sectors that are more sensitive to the COVID-19 restrictions need activity to grow by 0.24% year-on-year to create jobs, while all other sectors require growth of at least 0.33% year-on-year to increase employment. ”
y = 0,4223x + 0,0134 R² = 0,7467 y = 0,8076x + 0,0039
R² = 0,8089
-5%
-4%
-3%
-2%
-1%
0%
1%
2%
3%
4%
5%
-6% -4% -2% 0% 2% 4% 6% 8%
SS contributors (YoY change), 4Q10-4Q19
GDP (YoY change), 4Q10-4Q19 Sectors affected by COVID-19 Other sectors
Exhibit 3 Okun’s Law by sector
Note: Employment threshold - Result of the absolute value of α between the coefficient β in relation to the YoY change in social security contributors = α + β*YoY change in GDP + ɛ.
Sources: INE, Ministry of Inclusion, Social Security and Migration, Afi.
y=0.8076x+0.0039 R2=0.8089
y=0.4223x+0.0134 R2=0.7467
not likely to be equivalent to that observed in the wake of the financial crisis (Exhibits 4 and 5). Moreover, the NGEU funds should help mitigate the adverse effects of differing
rates of economic recovery, as one of the drivers of the recovery plan is, precisely, regional cohesion and responsiveness to demographic challenges.
Exhibit 4 Dispersion in growth by province
Average annual YoY growth, percentage period analysed, forecasts for 2021-23
Sources: INE, Ministry of Inclusion, Social Security and Migration, Afi.
Exhibit 5 Dispersion in growth by sector
Average annual YoY growth, percentage, period analysed, forecasts for 2021-2023
Sources: INE, Ministry of Inclusion, Social Security and Migration, Afi.
Conclusions
The i