In cases where a diagnosis remains elusive, awareness of the next diagnostic step becomes important. By design, we subjected bone marrow cytology description to diagnostic blood count (CBC).
Physiology and Pathophysiology of Blood Cells: Methods and Test
Procedures
Introduction to the Physiology and Pathophysiology of the Hematopoietic
Cell Systems
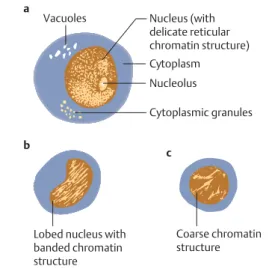
The developing cells in the granulocyte lineage (myeloblasts and promyelocytes), for example, show a delicate, fine "net-like" (reticular) structure. The blastic precursors usually reside in the hematopoietic organs (bone marrow and lymph nodes).
Principles of Regulation and Dysregulation in the Blood Cell Series and their Diagnostic Implications
It is not necessarily always observed in the blood stream, but may remain in the bone marrow. All disorders of bone marrow function are accompanied by quantitative and/or qualitative changes in the composition of blood cells or blood proteins.
Procedures, Assays, and Normal Values
Taking Blood Samples
Erythrocyte Count
Hemoglobin and Hematocrit Assay
Calculation of Erythrocyte Parameters
Red Cell Distribution Width (RDW)
Reticulocyte Count
Leukocyte Count
Thrombocyte Count
Quantitative Normal Values and Range of Cellular Blood Components
In addition, methodological variation must also be taken into account in the interpretation: in cell counts, the coefficient of variation (standard deviation as a percentage of the mean value) is usually around 10. The problems and the large variations between the different groups are discussed below. Table 2 presented in a simplified form, with values rounded up or down for ease of comparison and memorization.
The Blood Smear and Its Interpretation (Differential Blood Count, DBC)
The differential leukocyte count results (the morphologies are presented in the atlas section, p. 30 ff.) can be recorded using manual counters or mark-up systems. Drying samples as thick smears and then treating them with dilute Giemsa stain (as described above) achieves extensive hemolysis of the erythrocytes and thus an increase in released plasmodia.
Significance of the Automated Blood Count
19 cm from about 1 cm to about 3 cm from the end of the smear by moving the slide back and forth in a meandering motion across its short diameter. If only normal blood cells are present, the assignment of the clusters to the different leukocyte populations works well, and the precision of the automatic counting exceeds the manual counting of 100 cells in a smear by a factor of 10.
Bone Marrow Biopsy
The tube is then slowly withdrawn and if the procedure is successful, blood from the bone marrow fills the syringe. Figure 5 Bone marrow biopsy from the upper part of the posterior iliac spine (back side of the hip bone).

Lymph Node Biopsy and Tumor Biopsy
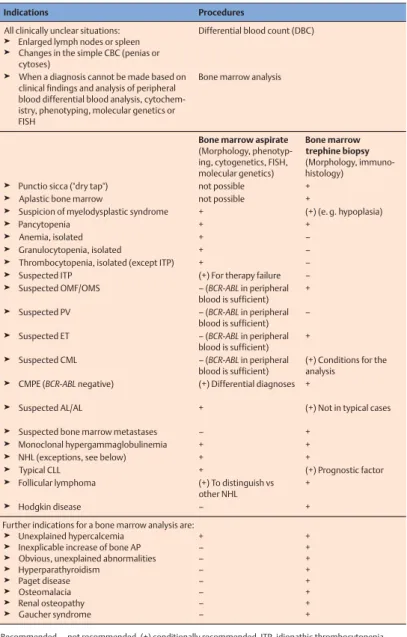
Step-by-Step Diagnostic Sequence
Examples of the decision process between bone marrow cytology and histology (biopsy) are shown in Table 3. Often only histological analysis can show structural changes or focal bone marrow infiltration.
Normal Cells of the Blood and Hematopoietic Organs
The Individual Cells of Hematopoiesis
Immature Red Cell Precursors: Proerythroblasts and Basophilic Erythroblasts
Below are two orthochromatic erythroblasts (2), on the right a metamyelocyte (3).bPro-erythroblast (1).cProerythroblast (1) next to a myeloblast (2) (see p. 34); lower part of the image shows a promyelocyte (3).

Mature Red Blood Precursor Cells: Polychromatic and Orthochromatic Erythroblasts (Normoblasts)
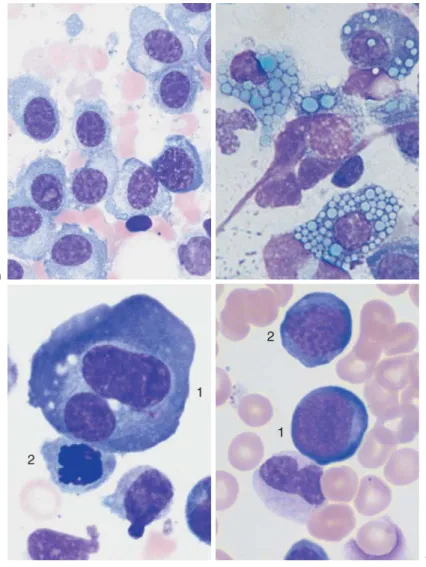
Fig.9 dThe density of the nuclear chromatin is similar in lymphocytes (1) and erythroblasts (2), but in the erythroblast the cytoplasm is wider and similar in color to a polychromatic erythrocyte (3).eNormal red blood cell findings with a slight variation in the size of the erythrocytes.

Immature White Cell Precursors: Myeloblasts and Promyelocytes
Partly Mature White Cell Precursors: Myelocytes and Metamyelocytes
Mature Neutrophils: Band Cells and Segmented Neutrophils
Progression of nuclear shrinkage and segmentation: continuous transformation from metamyelocyte to band cell and then to segmented neutrophilic granulocyte. Fig.12 Neutrophils (neutrophil granulocytes).a Transitional form between a metamyelocyte and a band cell.bAbundant granulation in a band cell (1) (toxic granulation) near band cells (2) with Döhle bodies (arrows).cTwo band cells .

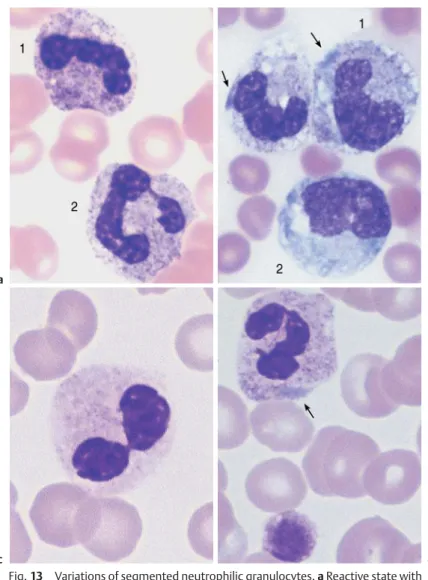
Cell Degradation, Special Granulations, and Nuclear Appendages in Neutrophilic Granulocytes and Nuclear
Fig. 13 Variations of segmented neutrophil granulocytes. a Reactive condition with toxic granulation of neutrophil granulocytes, more visibly expressed in the cell on the left (1) than the cell on the right (2) (compare with non-activated cells, p. 39). b Sepsis with toxic granulation, cytoplasmic vacuoles and Döhle bodies (arrows) in ribbon cells (1) and monocyte (2).cPseudo-Pelger cell that looks like sunglasses (toxic or myelodysplastic cause).dDöhle-like basophilic inclusion (ar- row) without toxic granulation. Nuclear appendages, not to be confused with small segments, are tiny (smaller than the size of a platelet) chromatin bodies that remain connected to the main body of the nucleus by a thin bridge and consequently appear like a drumstick. , a sessile nodule or a small tennis racket.
Eosinophilic Granulocytes (Eosinophils)
Basophilic Granulocytes (Basophils)
Fig. 14 Eosinophilic and basophilic granulocytes.a-Eosinophilic granulocytes with corpuscular granules, colored orange. dIn contrast, neutrophil granulocyte granules are not round, but more bud-shaped. of Basophilic Granulocyte. The granules are corpuscular like those of the eosinophilic granulocyte, but stain deep blue to purple.

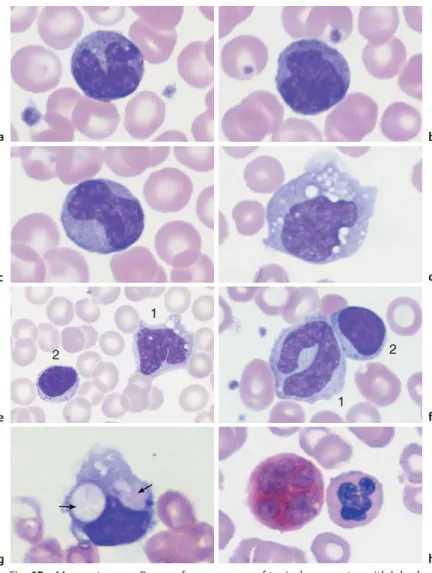
Monocytes
Fig.15 Monocytes.a–c Serial appearance of typical monocytes with lobulated, nucleus, grey-blue stained cytoplasm and fine granulation.dPhagocytic monocyte with plasma vacuoles.eMonocyte (1) to the right of a lymphocyte with azurophilic granules (2). f Monocyte (1) with nucleus resembling that of a banded neutrophil, but its cytoplasm typically stains grey-blue. Lymphocyte (2).g A monocyte that has phagocytized two erythrocytes and houses them in its wide cytoplasm (arrows) (sample taken after bone marrow transplantation). hEsterase staining, a typical marker enzyme for cells of the monocyte lineage.
Lymphocytes (and Plasma Cells)
Megakaryocytes and Thrombocytes
The broad cytoplasm shows fine, cloudy granulation as a sign of incipient platelet nucleation.bNormal density of platelets among the erythrocytes, with little variation in platelet size.canddPeripheral blood smears with aggregations of platelets. When such aggregates are seen against a background of apparent thrombocytopenia, the phenomenon is called "pseudo-thrombocytopenia" and is usually an effect of the anticoagulant EDTA (see also p. 167).

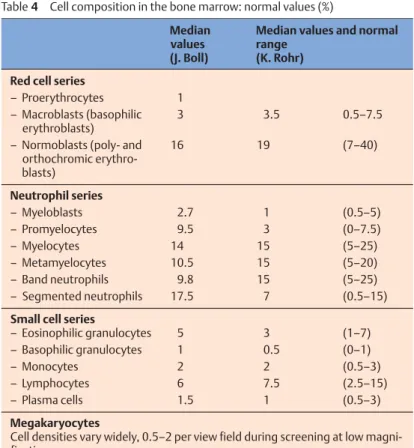
Bone Marrow: Cell Composition and Principles of Analysis
Ratios of red cell series to white cell series. In the final analysis, bone marrow cytology allows quantitative assessment only in relative terms. Not only the individual cell, but its relative proportion is important in the diagnosis of bone marrow.
Bone Marrow: Medullary Stroma Cells
Fig.20 Bone marrow stroma.a Spindle-shaped fibroblasts form the structural framework of the bone marrow (shown here: aplastic hematopoiesis after therapy for multiple myeloma).b A macrophage has phagocytized residual nuclear material (here after chemotherapy for acute leukemia). cBone marrow osteoblasts are rarely found in the cytological assessment. The characteristics that distinguish osteoblasts from plasma cells are their more loosely structured nuclei and the cloudy, "busy" basophilic cytoplasm. dOsteoclasts are multinucleated giant cells with wide, diffuse cytoplasm.
Abnormalities of the White Cell Series
A very old-fashioned, intuitive way to classify CBCs is to divide them into cells in which round to oval (mononuclear) cells predominate, and cells in which segmented (polynuclear) cells predominate. However, this old method does allow the relevant differential diagnosis to be deduced from a cursory screening of a slide.
Predominance of Mononuclear Round to Oval Cells (Table 5)
Table 5 Diagnostic examination for abnormalities in white blood cells with mononuclear cell predominance.
Reactive Lymphocytosis
Fig.21 Lymphatic reactive states.a–eHigh variability of the lymphatic cells in a lymphotropic infection (in this case cytomegalovirus infection). Varying amounts of the mononuclear cells (at least 20%) may be quite extensively transformed round cells (Pfeiffer cells, virocytes).

Diseases of the Lymphatic System (Non-Hodgkin Lymphomas)
Table 6 a Non-Hodgkin's classification: comparison of the corresponding classes in the Kiel and WHO classifications. There is little bone marrow involvement and no lymph nodes.
Relative Lymphocytosis Associated with
Granulocytopenia (Neutropenia) and Agranulocytosis
Infection-induced
Autoimmune neutropenia
Congenital and familial neutropenias
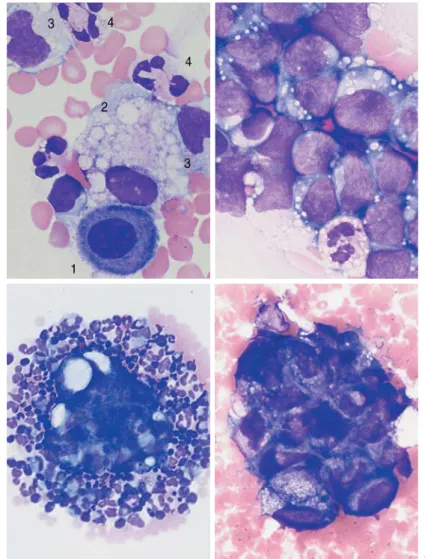
Fig. 29 Bone marrow in agranulocytosis.a In the early stage of agranulocytosis, the bone marrow shows only precursor cells of red cells (eg, 1), plasma cells (2) and lymphocytes (3); in this sample a myeloblast—a sign of regeneration—is already present (4). b Bone marrow in agranulocytosis during the promyelocytic phase, showing almost exclusively promyelocytes (eg, 1); increased eosinophilic granulocytes are also present (2). Relapsing fever – Syphilis – Tuberculosis – Endocarditis lenta – Brucellosis (Bang's disease) – Variola vera (smallpox) – Rocky Mountain spotted fever – Malaria.

Monocytosis
Fig. 30 Reactive monocytosis and monocytic leukemia. aReactive and neoplastic monocytes are morphologically indistinguishable; here two relatively condensed monocytes are shown in reactive monocytosis.b When only monocytes are found, a malignant etiology is likely: in this case AML M5 according to the FAB classification (see p. 100). Auer bodies (arrow). cMonocytes of different degrees of maturity, segmented neutrophil granulocytes (1) and a small myeloblast (2) in chronic myelomonocytic leukemia (CMML, see p. 107).

Acute Leukemias
The bone marrow is completely overwhelmed by myeloblasts and erythroblasts (more than 50% of the cells are in the process of erythropoiesis). Some are megaloblastic but coarser (arrow 2). dIron staining of the bone marrow (Prussian blue) in myelodysplasia of the RARS type: dense iron granules forming a partial ring around the nuclei (ring sideroblasts).
Prevalence of Polynuclear (Segmented) Cells (Table 19)
Neutrophilia without Left Shift
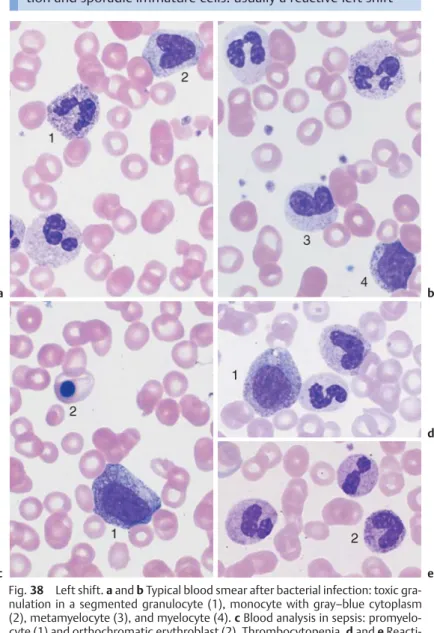
Reactive Left Shift
The granulocytic lineage predominates with abundant granulation and occasional immature cells: usually a reactive shift to the left. Figure 38 Left shift.ainbTypical blood smear after bacterial infection: toxic granulation in segmented granulocyte (1), monocyte with gray-blue cytoplasm (2), metamyelocyte (3) and myelocyte (4).c Blood analysis in sepsis: promyelocyte (1) and orthochromatic erythroblast (2).
Chronic Myeloid Leukemia and Myeloproliferative Syndrome (Chronic Myeloproliferative Disorders,
Cells in this series mature well, except for a slight shift to the left in the chronic phase of CML. Fig.40 Bone marrow cytology in CML.a Bone marrow cytology in the chronic phase: increased cell density due to increased left-shifted granulopoiesis, for example promyelocyte nest (1) and megakaryopoiesis (2).

Osteomyelosclerosis
Fig.42 Osteomyelosclerosis (OMS).ogbScreening of blood cells in OMS: precursors to red blood cells (orthochromatic erythroblast = 1 and basophilic erythroblast = 2), basophilic granulocyte (3) and droplet cells (4).

Elevated Eosinophil and Basophil Counts
Fig.43 Eosinophilia and basophilia.a Screen image of blood cells in reactive eosinophilia: eosinophilic granulocytes (1), segmented neutrophil granulocyte (2) and monocyte (3) (reaction to bronchial carcinoma). bandcThe image shows an eosinophilic granulocyte (1) and a basophilic granulocyte (2) (clinical osteomyelosclerosis).dBone marrow in systemic mastocytosis: tissue mast cell (3), which, unlike a basophilic granulocyte, has an unpatched nucleus and the cytoplasm is broad with a tail-like extension. The tissue-bound analogues of the segmented basophils, the tissue mast cells, can show benign or malignant cell proliferation, including the (extremely rare) acute mast cell leukemia (Table 21).

Erythrocyte and Thrombocyte Abnormalities
Clinically Relevant Classification Principle for Anemias
Mean Erythrocyte Hemoglobin Content (MCH)
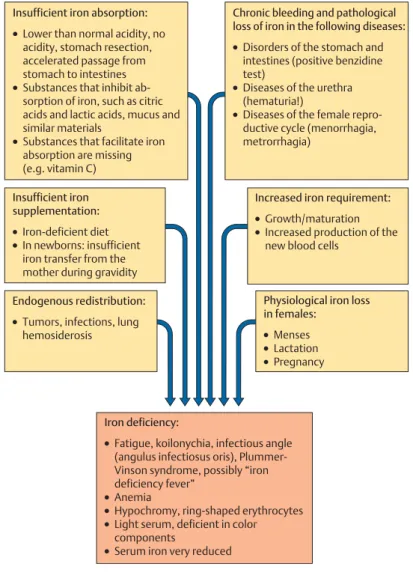
Hypochromic Anemias
Only chronic bleeding or previously severe acute blood loss leads to iron deficiency manifested as hypochromic anemia. Fig.45 Iron deficiency anemia.andbErythrocyte morphology in iron deficiency anemia: ring-shaped erythrocytes (1), microcytes (2), faintly visible target cells (3) and a lymphocyte (4) for size comparison.
Hypochromic Infectious or Toxic Anemia (Secondary Anemia)
Iron staining in the bone marrow shows no sideroblasts (normoblasts containing iron granules), or only very few (!10%, rate 30-40%). A constant finding in anemia resulting from exogenous iron deficiency is iron deficiency in bone marrow reticulum macrophages.

Hypochromic Sideroachrestic Anemias (Sometimes Normochromic or Hyperchromic)
Hypochromic Anemia with Hemolysis
Normochromic Anemias
Normochromic Hemolytic Anemias
Fig. 48 Hemolytic anemia. Newly formed erythrocytes appear as large, polychromatic erythrocytes (1) after Pappenheim staining (a); supravital staining (b) reveals spot-like precipitates (reticulocyte = 2). Thrombocyte (3).c Bone marrow cells in hemolytic anemia at low magnification: increased hematopoiesis with cell clusters.

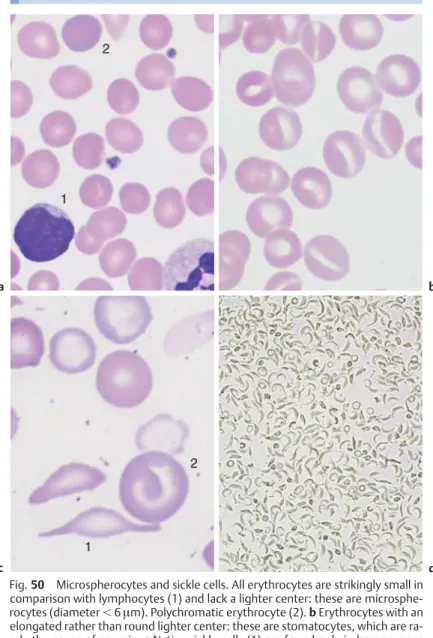
Cytomorphological Anemias with Erythrocyte Anomalies
All erythrocytes are remarkably small compared to lymphocytes (1) and do not have a lighter center: they are microspherocytes (diameter!6µm). Polychromatic erythrocytes (2). bErythrocytes with an elongated rather than round paler center: these are stomatocytes, which are rarely the cause of anemia. cIndigenous sickle cells (1) are only found in homozygous sickle cell anemia, otherwise only target cells (2) are present. dSickle cell test under reduced oxygen tension: almost all erythrocytes appear as sickle cells in the homozygous case presented here.
Normochromic Renal Anemia
Bone Marrow Aplasia
Unexplained decrease in cell counts for one or more lines: the bone marrow smear may show various forms of aplasia. Often strands and patches of reticular (stroma) cells dominate the bone marrow, which are usually barely noticed in an aspiration.

Bone Marrow Carcinosis and Other Space-Occupying Processes
Hyperchromic Anemias
In older patients, myelodysplastic syndrome should be the first item in the differential diagnosis of hyperchromic anemia. Fig.54 Myelodysplastic syndrome (MDS) as a differential diagnosis in hyperchromic anemia.aStrong basophilic stippling in the cytoplasm of a macrocyte (in myelodysplasia).bMyeloblast with hyperchromic erythrocyte as an example of a myelodysplastic blood sample in the differential diagnosis versus hyper- diagnosis. chromic anemia.cA high proportion of reticulocytes speaks against megaloblastic anemia and for hemolysis (in this case with an absence of pyruvate kinase activity).dBone marrow in myelodysplasia (type RAEB), with clinical hyperchromic anemia.

Erythrocyte Inclusions
Fig. 55 Erythrocyte inclusions.aPolychromatic erythrocyte with fine, dense basophilic stippling.bErythrocyte with Howell-Jolly bodies (arrow) next to a lymphocyte (after splenectomy).cErythrocyte with two Howell-Jolly bodies (arrow) next to an orthochromatic erythroblast with basophilic stippling (thalassemia , in this case with functional asplenia).dErythrocyte with a delicate Cabot ring (arrow) (here in the case of osteomyelosclerosis).eThrombocyte layered on an erythrocyte (arrow).fandgFixation and staining artifacts.

Hematological Diagnosis of Malaria
Fig.56 Diagnosis malariae plasmodiae differentialis in linis sanguinis (van Kayser, F., et al., Medizinische Mikrobiologie (Medical Microbiology), Thieme, Stuttgart, 1993). Fig.57 Analysis sanguinis in malaria aTrophozoitis in Plasmodium falciparum (malium falciparum vel tertiariorum malignorum) infectio.

Polycythemia Vera (Erythremic Polycythemia) and Erythrocytosis
Fig.58 Polycythemia vera and secondary erythrocytosis.a In reactive secondary erythrocytosis there is usually only an increase in erythropoiesis.b In polycythemia vera, megakaryopoiesis (and often granulopoiesis) is also increased.cBene marrow smear at low magnification in polycythemia vera, showing a hyperlobular megakaryocyte (arrow).d Bone marrow smear at low magnification in polycythemia vera, showing increased cell density and proliferation of megakaryocytes. e In polycythemia vera, iron staining does not show iron storage particles.

Thrombocyte Abnormalities
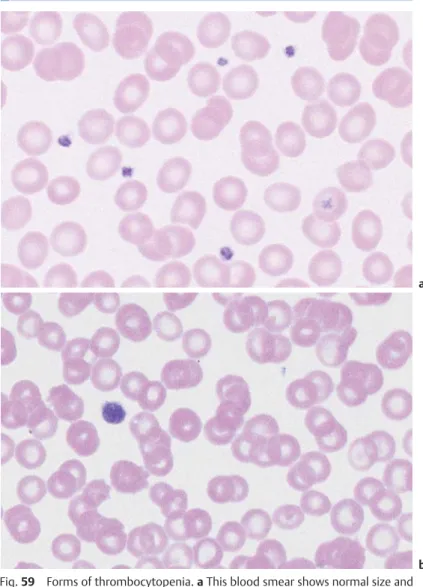
Thrombocytopenia
In these cases, thrombocytopenia is often present before anemia and leukocytopenia in the circulating blood, while the bone marrow shows many megakaryocytes that have been blocked from maturation. Different forms of morphology of platelets and megakaryocytes in the bone marrow are a diagnostic aid in thrombocytopenia.
Thrombocytosis (Including Essential Thrombocythemia)
Cytology of Organ Biopsies and Exudates*
This guide to morphology can provide only a basic indication of the materials from which a cytological diagnosis can be derived and the basic types of information that cytology can provide. Thus, the images in this chapter are primarily intended to help the clinician understand the interpretation of specimens that he or she has not personally examined.
Lymph Node Cytology
A biopsy of the thyroid (especially in the area of scintigraphically "cold" nodules), a biopsy of the liver and spleen (under laparoscopic control) in the area near the surface of the lying solids, and a biopsy of the breast and prostate are particularly important.

Reactive Lymph Node Hyperplasia and Lymphogranulomatosis (Hodgkin Disease)
Large blastic cells adjacent to small lymphocytes (if not regressed, histological analysis is required). bHodgkin disease: a giant mononuclear cell with a large nucleolus (arrow) and a broad cytoplasmic layer (Hodgkin cell), surrounded by small and medium-sized lymphocytes. Hodgkin's disease: giant binucleate cell (Reed-Sternberg giant cell).

Sarcoidosis and Tuberculosis
Fig. 64 Boeck's disease and tuberculosis.a Cytology of lymph nodes in Boeck's disease: a special form of the reactive pattern of cells with islands (often predominant) and trains of epithelioid cells (arrows), which have ovoid nuclei with delicate chromatin structure and a broad layer of smoky gray cytoplasm. bCytology of lymph nodes in tuberculous lymphadenitis: in addition to lymphocytes and some epithelial cells (1), large syncytia of epithelioid cell nuclei can be encountered within a cytoplasm (arrow): Langhans giant cell.

Non-Hodgkin Lymphoma
Metastases of Solid Tumors in Lymph Nodes or Subcutaneous Tissue
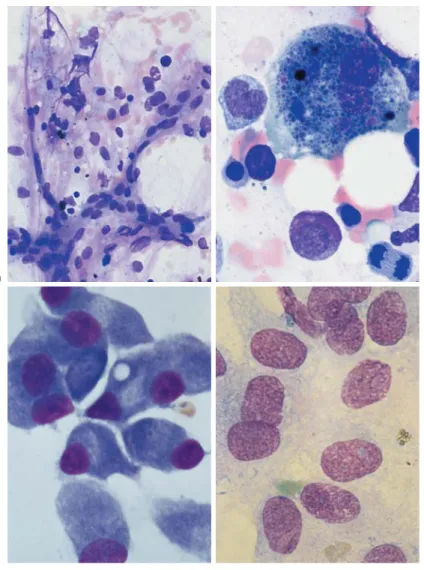
In cases of non-Hodgkin's lymphoma and tumor masses, a tentative diagnosis is possible based on lymph node cytology. Figure 65 Non-Hodgkin's lymphoma and tumor metastases. a Lymph node cytology shows small cells with relatively broad cytoplasm (arrow 1) in addition to lymphocytes.

Branchial Cysts and Bronchoalveolar Lavage
Branchial Cysts
Cytology of the Respiratory System, Especially Bronchoalveolar Lavage
Cytology of Pleural Effusions and Ascites
Fig. 67 Pleural effusion and ascites.aPleural cytology, non-specific exudate: quiescent mesothelial cell (or serosal cover cell) (1), vacuolated phagocytic macrophage (2) and monocytes (3), in addition to segmented neutrophils (4).bCell composition in a pleural aspirate (prepared using a cytocentrifuge): variable cells, the similarity of which to cells in acute leukemia must be determined by cytochemistry and marker analysis: lymphoblastic lymphoma.cAscites with tumor cell conglomerate, surrounded by granulocytes and monocytes, in this case ovarian carcinoma. dAscites cytology showing an island of tumor cells.
Cytology of Cerebrospinal Fluid