NEW TECHNIQUES AND METHODS FOR THE STUDY OF AGGREGATION, ADSORPTION, AND SOLUBILITY OF ASPHALTENES. IMPACT OF THESE PROPERTIES ON COLLOIDAL STRUCTURE AND FLOCCULATION
Jimmy Castillo a , Alberto Fernández a , María A. Ranaudo a & Sócrates Acevedo b
a Laboratories of Físicoquímica , Universidad Central de Venezuela , Facultad de Ciencias, Escuela de Química. 47102, Caracas, 1041, Venezuela
b Universidad Central de Venezuela , Físico Química de Hidrocarburos, Facultad de Ciencias, Escuela de Química. 47102, Caracas, 1041, Venezuela
Published online: 14 Feb 2007.
To cite this article: Jimmy Castillo , Alberto Fernández , María A. Ranaudo & Sócrates Acevedo (2001) NEW TECHNIQUES AND METHODS FOR THE STUDY OF AGGREGATION, ADSORPTION, AND SOLUBILITY OF ASPHALTENES. IMPACT OF THESE PROPERTIES ON COLLOIDAL STRUCTURE AND FLOCCULATION, Petroleum Science and Technology, 19:1-2, 75-106, DOI:
10.1081/LFT-100001227
To link to this article: http://dx.doi.org/10.1081/LFT-100001227
PLEASE SCROLL DOWN FOR ARTICLE
Taylor & Francis makes every effort to ensure the accuracy of all the information (the “Content”) contained in the publications on our platform. However, Taylor & Francis, our agents, and our licensors make no
representations or warranties whatsoever as to the accuracy, completeness, or suitability for any purpose of the Content. Any opinions and views expressed in this publication are the opinions and views of the authors, and are not the views of or endorsed by Taylor & Francis. The accuracy of the Content should not be relied upon and should be independently verified with primary sources of information. Taylor and Francis shall not be liable for any losses, actions, claims, proceedings, demands, costs, expenses, damages, and other liabilities whatsoever or howsoever caused arising directly or indirectly in connection with, in relation to or arising out of the use of the Content.
This article may be used for research, teaching, and private study purposes. Any substantial or systematic reproduction, redistribution, reselling, loan, sub-licensing, systematic supply, or distribution in any
form to anyone is expressly forbidden. Terms & Conditions of access and use can be found at http://
www.tandfonline.com/page/terms-and-conditions
THE STUDY OF AGGREGATION, ADSORPTION, AND SOLUBILITY OF
ASPHALTENES. IMPACT OF THESE PROPERTIES ON COLLOIDAL STRUCTURE AND FLOCCULATION
Jimmy Castillo,1Alberto Fern´andez,1Mar´ıa A.
Ranaudo,2and S´ocrates Acevedo2,∗
1Laboratories of F´ısicoqu´ımica and2F´ısico Qu´ımica de Hidrocarburos, Universidad Central de Venezuela, Facultad de Ciencias, Escuela de Qu´ımica. 47102,
Caracas, 1041, Venezuela
ABSTRACT
The solubility of Furrial asphaltene in toluene was 57g L−1. However, using a new technique, based on the precipitation of this sample by the phenol PNP, we found that a fraction (2), compris- ing 47% of the asphaltene, is of low solubility. This suggested that this material constitutes the colloidal phase, and the rest acts as the dispersing fraction. This technique allowed the fractionation of as- phaltenes in fractions A1, A2, and A3according to solubility, going from practically insoluble (A1) to low (A2, 1 g L−1) to high (A3, around 57 g L−1). The adsorption isotherms of asphaltenes on glass and silica in toluene consist of a sequence of steps or step-wise ad- sorption. The first layer or first step is formed by the adsorption
∗Corresponding author. E-mail: [email protected] 75
CopyrightC2001 by Marcel Dekker, Inc. www.dekker.com
Downloaded by [University of Connecticut] at 05:23 14 October 2014
of free asphaltene molecules and by small aggregates (aggregation number between 3 and 6) which saturate the glass or silica surface in the usual manner (L-type or H-type isotherms). However, we suggest that the second, third, and other asphaltene layers adsorb sequentially according to the above differences in solubility. The very slow changes with time and the negligible desorption from the surface measured for the above isotherms were interpreted as the effect of packing or the building up of a well packed layer. This would be achieved by the slow formation and rupture of bonds be- tween neighboring molecules at the surface. Thus, molecules with difficulties to pack, adsorbed by a kinetically controlled process, are either rejected or relocated in a thermodynamic controlled process.
The above results and ideas were used to improve the models for as- phaltene and petroleum colloids and to underscore the importance of surfaces and colloid dispersants in asphaltene precipitation dur- ing the production of crude oils. For instance, the results described below suggest that colloids are constituted by a well packed and insoluble asphaltene core, impervious to the solvent, and by a loose packed periphery which, by allowing solvent penetration, keep the colloid in solution. According to this model, desorption of com- pounds in the above loosely packed periphery, such as the one promoted by a surface, would be the main cause of asphaltene pre- cipitation from crude oils. In this case, solubility reductions caused by pressure drops during oil production would have a minor effect.
Also, preliminary number average molecular weights Mnfor four asphaltenes, obtained using a new procedure, are presented here.
The Mnvalues obtained ranged from 780 to 1150 g/mol.
Key Words: Asphaltene-colloids; Asphaltene-aggregates; Asph- altene-adsorption-solubility
GLOSSARY OF SYMBOLS English Symbols
A Asphaltene
A1 Asphaltene fraction insoluble in toluene isolated from A2
A2 Asphaltene fraction of low solubility in toluene, isolated by L-Type: precipitation with PNP, after PNP extraction Langmuir type isotherm
A3 Asphaltene fraction soluble in toluene, isolated from Furrial asphaltenes after PNP extraction
Downloaded by [University of Connecticut] at 05:23 14 October 2014
ALT-17 Crude sample from Maracaibo, Venezuela Ao,At Absorbance values
Am,AI, and Aa Asphaltene sample in the media, interface, and surface, respectively
C Solution concentration
CMC Critical micelle concentration
C-148 Crude sample from Maracaibo, Venezuela D Thermal diffusivity constant
DM-148 Crude sample from Maracaibo, Venezuela DM-22 Crude sample from Maracaibo, Venezuela DM-153 Crude sample from Maracaibo, Venezuela H-Type High energy type isotherm
k First-order rate adsoprtion of asphaltene k1,k−1 Diffusion rates
k2 Adsorption rate
K Equilibruim constant
Mf Average molecular weight of a free or non-aggregated asphaltene
M Molecular weight
Ma Average molecular weight
Mn Number average molecular weight
MA Methylated asphaltenes
NA Number of Avogadro
n number of n-octyl groups added to the asphaltene molecule
NPE Nonylphenol ethoxylated
OA Octylated asphaltene
PNP para-nitrophenol
PNT para-nitrotoluene
p Amount of asphaltene precipitated in the PNP experiments PSD Photothermal surface deformation method or technique S Surface area, surface or site on surface
THF Solvent tetrahydrofurane
VLA-711 Crude sample from Maracaibo, Venezuela
VPO Vapor pressure osmometry method for molecular weight determination
Greek Symbols
δ Width of an asphaltene molecule
ν Amount of material adsorbed on surfaces
ρ Density
σ Molecular area
Downloaded by [University of Connecticut] at 05:23 14 October 2014
1. INTRODUCTION
The idea regarding the presence of asphaltenes in crude oil as colloids dis- persed by resins and other compounds has been around since the days of Pfeiffer and Saal (1). So far many experimental evidence has been gathered in support of this theory (2). Measurements of the size and shape of the colloids have been reported, and some theoretical studies regarding phase behavior have used the colloidal approach (3–5). Undoubtedly, this interest is due to the negative impact of asphaltene precipitation during production and other industrial operations, and hence research in this area is very active.
Despite all the evidence collected so far, many points remain obscure. This is expected in view of the very high complexity of asphaltenes discussed many times in the literature. A point, regarding phase behavior, is whether a molecular or colloidal approach should be used to represent solutions of asphaltenes. The literature on the subject is not clear in this regard, and models using molecular (6,7) and colloidal (see above) theories have been reported recently. The results shown below support the colloidal model very strongly, and we suggest that the molecular model should be abandoned in view of the absence of any experimental evidence supporting it.
Another point is related to the so-called asphaltene micelles forming at a particular critical micelle concentration (CMC). By definition micelles are sur- factant aggregates forming sharply at the CMC in water with a sharp aggregation number. This very particular behavior is due to the hydrophobic effect, whereby the surfactant forms a closed volume with the lowest energy, to enclose the maxi- mum number of hydrophobic tails. The undesired contacts between water and the hydrocarbon tails are thus kept to a minimum. Thus, a necessary condition for a CMC is the presence of water, and even in the case of ordinary surfactants in oily media, such CMC have been strongly questioned (8). A step-wise aggregation process for micelle formation in the oily case is now widely accepted (9).
For asphaltenes the above CMC process is more unlikely due to polydis- persity. This would inhibit any packing procedure at any particular concentration, and the difficulties to pack in the aggregate could only be overcome by increasing the trend of the solute to be adsorbed; that is, by increasing the concentration in solution. In other words, the aggregate would grow in a step-wise form.
Other important aspects regarding structure, such as the nature of the material in the core and periphery of the colloid are also obscure, and are matters of much speculation.
Clearly, new techniques and methods should be developed in order to shed light on the above and similar matters. This paper condenses the description of new techniques and methods developed in our laboratories to study the solubility, aggre- gation, and adsorption properties of asphaltenes and the impact of these properties on colloid solubility and asphaltene flocculation. Part of the research with some of
Downloaded by [University of Connecticut] at 05:23 14 October 2014
these techniques (PSD and thermal lens) has been published in recent times (10,11).
The treatment of asphaltene solutions with PNP, and the treatment of crude oils with silica, devised to obtain information on phase solubility and colloidal struc- ture, are described here for the first time. Also, preliminary published results on kinetic and asphaltene isotherm (12) are discussed in terms of new ideas regarding asphaltene tendency to adsorb on asphaltene surfaces, and packing ability.
We hope that the results and discussion given below will clarify some of the obscure points mentioned above.
2. EXPERIMENTAL
2.1. Materials and Area Determination
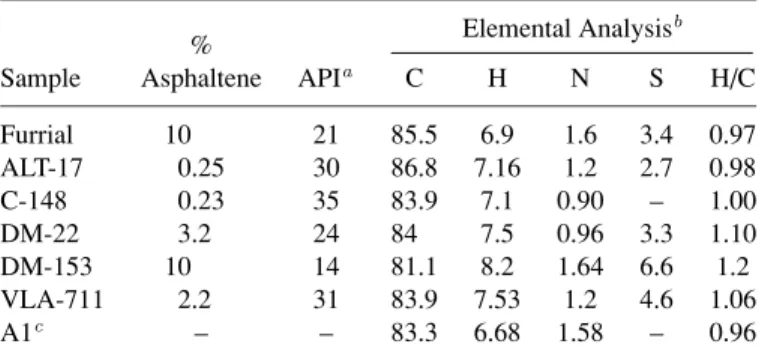
Some properties of the Venezuelan crude oils and their asphaltenes used in this work are shown in Table 1. Samples ALT-17, C-148, DM-22DM-153 and VLA-711 from Maracaibo Lake (in the western part of the country) are stable crude oils without precipitation problems, whereas Furrial, from Monagas state (in the eastern part of the country), has severe flocculation problems. The compounds para-nitrophenol (PNP) and p-nitrotoluene (PNT) were commercial samples used as received.
Asphaltenes, thoroughly Soxhlet extracted with n-heptane to remove resins, were obtained from Furrial crude oil by the addition of 40 volumes of n-heptane as described elsewhere (13). Commercial samples of silica gel were used as adsorbent.
Using the dye method (14) and PNP as the dye, an area of 13.7 m2/g was found for silica in toluene when the molecular areaσ =52.5 ˚A2, reported for the PNP (14) was used (see Eq. 1 below).
Table 1. Properties of Crude Oils and Asphaltenes Elemental Analysisb
%
Sample Asphaltene APIa C H N S H/C
Furrial 10 21 85.5 6.9 1.6 3.4 0.97
ALT-17 0.25 30 86.8 7.16 1.2 2.7 0.98
C-148 0.23 35 83.9 7.1 0.90 – 1.00
DM-22 3.2 24 84 7.5 0.96 3.3 1.10
DM-153 10 14 81.1 8.2 1.64 6.6 1.2
VLA-711 2.2 31 83.9 7.53 1.2 4.6 1.06
A1c – – 83.3 6.68 1.58 – 0.96
aAPI gravities of crude oils.bCorresponding to asphaltenes.cSample of low solubility in toluene isolated by treatment with PNP.
Downloaded by [University of Connecticut] at 05:23 14 October 2014
By a similar procedure a surface area of 91 m2/g was found when Furrial asphaltene was employed as the adsorbing surface in n-heptane. Since the solubility of PNP in this solvent is very low, we used PNT as the dye and theσ value for PNP. Surface areas S, in m2/g, were calculated using Equation 1 (14).
S=νmσ×NA10−20 (1)
In this equationνmis the amount of dye adsorbed in mg g−1,σ is the dye area in ˚A2/molecule, and NAis the number of Avogadro.
2.2. Methods 2.2.1. Solubility and Precipitation Methods
Toluene solutions of PNP and asphaltene were prepared in separated flasks and then mixed in 100 ml volumetric flasks to make final concentrations of PNP in the range of 500 to 8000 mg L−1and a final constant concentration of 8 g L−1 in asphaltene. The solutions were allowed to stand at room temperature for one week, and after this time the contents were filtrated, the filtrated was set aside and the precipitate solid was washed with toluene, dried, weighted, and dissolved in chloroform. This solution was washed once with aqueous sodium hydroxide (5%) to extract the PNP into the aqueous solution, which was then determined as phenolate by UV. The precipitated solids obtained before and after the extraction of PNP are hereafter calledpand A2, respectively. The seperation scheme used is shown in Figure 1.
The precipitated asphaltene p is reported here in percentage of total as- phaltene in solution. The amount of adsorbed PNP (ν), coprecipitated with the asphaltenes, is in mg g−1. The soluble fraction A3was isolated after evaporation of the above filtrate, dissolution of the residue in chloroform, and extraction of PNP, as described above. A solution of A2 in toluene was prepared after mixing with A3in proportions (1:3 and 2:3). Sample A1 was the residue in the thimble, obtained after a thorough Soxhlet extraction of A2with toluene.
The solubility of samples at room temperature was determined as usual, by preparing saturated solutions in toluene using the following procedure. A weighted amount of sample was added in small portions to toluene and contained in the test tube placed in an ultrasonic bath. Using a capillary a drop of solution was withdrawn and placed on filter paper. Undersaturated solutions give a continuous stain on the paper, whereas saturated solutions give a stain with solid at the application point. The amount of sample added just before solid appearance was equal to the solubility. These solubility measurements afforded the following results in g L−1: A1, 0.00; A2, 1.14; and the solubility of A3 was similar to the one for Furrial asphaltenes: 57 g L−1.
Downloaded by [University of Connecticut] at 05:23 14 October 2014
A2
A1
Thimble Extraction in Soxhlet
with toluene
A3
Evaporation Organic Layer
Evaporation
A2
wash with water, dry with MgSO 4 rotaevaporation Measure u by UV
PNP
Organic Layer Aqueous Layer
Extract with aqueous NaOH (5 %)
CHCl3
Disolve in
A3 + PNP p = A 2 + PNP
Filtrate Precipitate ( p)
Filtration Allow contact for 7 days Final solutions: 0.5 to 8 g L -1 PNP
Constant asphaltene conc. = 8 g L-1 in all solutions Add PNP
Solution in toluene Asphaltene Solutions
(Toluene)
Figure 1. Flow diagram showing the separation of A1,A2andA3after the treatment of toluene solutions of Furrial asphaltenes withpara-nitrophenol (PNP).
Flocculation experiments were carried out using 25 ml of crude oil in the presence of 5 g of silica gel. When heating was required, the mixture was placed in a flask attached to a condenser and heated for 12 h, then allowed to cool and stand overnight. For the experiments below room temperature, the mixture was shacked for one day. After this time (in all cases) the mixture was allowed to reach room temperature, the solid (silica plus precipitate) was filtered, washed with n-heptane until a clear filtrate was obtained, dried, and weighted. The amount of precipitate asphaltene was obtained by weight difference. When required, the asphaltenes were extracted from the silica in a Soxhlet with a boiling mixture of chloroform–methanol 3:1.
Downloaded by [University of Connecticut] at 05:23 14 October 2014
2.2.2. Adsorption Methods
Asphaltene-toluene solutions were prepared by toluene dilution of a stock solution (500 mg L−1). The stock solution was prepared by weighting the appropri- ated amount of dried asphaltene, which was dissolved in toluene using ultrasonic bath. The solution was allowed to stand for two days before it was used.
For kinetic runs, small silica plates (2.5×1 cm2, 24 mg of silica) were intro- duced in small glass vials containing 8 mL of asphaltene-toluene solution. Changes in absorbance with time were continuously monitored by passing a He-Ne laser beam (632.8 nm) through the vials, and the intensity was registered by using a photodiode. In one experiment (asphaltene concentration equal to 200 mg L−1) the solution was stirred by using a small magnetic stirrer. Since no difference in rate was observed with and without stirring, all experiments were carried out without stirring.
From these kinetic plots, the amount of adsorbed solute at any time in each caseνt(mg g−1), as well as the corresponding solution concentration Ct(mg L−1), could be obtained using Equations 2 and 3 below:
νt=[(A0−At)a/A0w]C0 (2)
Ct=(At/A0)C0, (3)
where A0 and At are the absorbances at zero and t minutes, respectively, C0
(mg L−1) is the initial concentration,ais the aliquot, andwis the solid weight (g).
A desorption experiment was performed as follows. Asphaltenes were ad- sorbed on a silica plate from a 200 mg L−1solution as described above. After 72 h, the quantity of sample adsorbed was equivalent to 133 mg L−1. The plate was withdrawn, dried, and embedded in pure toluene. The absorbance increase was monitored as usual, and after 50 h no further change was observed. The amount desorbed was equivalent to 4 mg L−1.
Isotherms were measured using the photothermal surface deformation (PSD) method described earlier (10). Briefly, in this method the amount of solute adsorbed on the surface is determined directly. That is, by using a procedure similar to the one described for the kinetic runs (see above), the sample was adsorbed on the silica plate. After the required time, the plate was withdrawn, allowed to dry in a desicca- tor, and set for analysis. This was performed by using two lasers, one for pumping and the other as the probe. The pumping beam heats the sample and produces a di- latation that is proportional to the sample mass. This is measured by the probe beam.
Signal calibration was performed by comparing with the adsorption mea- sured by transmission measured as described in the kinetic runs.
Downloaded by [University of Connecticut] at 05:23 14 October 2014
2.2.3. Area Per Asphaltene MoleculeσA
σAwas estimated from Equation 4:
σA=0.166(MSS/ν) (4)
Here Ssis the area of the silica in m2/g,ν is the amount of asphaltene in the first layer in mg g−1,σAis in ˚A2per molecule and M is the molecular weight.
When required, an M value near 1000 was used (see below and Tab. 3).
2.2.4. Thermal Lens Method
The thermal lens method has been reported elsewhere (11), so only a brief description will be given here. In the thermal lens, the asphaltene in solution absorbs energy from the excitation beam as usual. Through fast non-radiative relaxation of excited species, part of this energy is then transferred as thermal energy (heat) to the solvent, and a density change within the excitation region is induced. Another laser is used as a probe to monitor the refractive index gradient (thermal lens) so induced, and after the appropriate measurements and calculations the thermal diffusivityDis obtained.
2.2.5. Molecular Weight Methods
The general procedure of asphaltene alkylation with potassium naphtalide and octyliodine in THF have been described earlier (13,15). Briefly the method can be described as follows. A solution of naphtalene in THF is treated with potassium to form potassium naphtalide. This compound is an ion radical with a high reduction potential. When asphaltenes are added to the solution, they react with the ion radical to form ionic sulfides and carbanions. After this reaction is complete, the alkyl iodine (octyl or methyl iodine) is added to form the alkyl asphaltene.
Molecular weights of samples were measured in nitrobenzene at 100◦C using the VPO method described elsewhere (16). The usual range of solution concentra- tions was employed (more than 1 and less than 10 g L−1) and the number average molecular weights Mnwere obtained by extrapolation to infinite dilution.
The number n of octyl groups incorporated in the asphaltene per 100 carbons was calculated from the elemental analysis using the equation below.
(H/C)OA=[100(H/C)A+17n]/(100+8n) (4-1) In this equation, (H/C)OAand (H/C)Aare the hydrogen to carbon ratio corresponding to octylated asphaltenes (OA) and asphaltenes, respectively.
Downloaded by [University of Connecticut] at 05:23 14 October 2014
2.2.6. Rate Equations
An adsorption process in two steps, one for diffusion to the surface and the other for adsorption, can be described as follows:
Am=AI, (5)
AI+S→Aa. (6)
In these equations, Am, AI, and Aarepresent samples in the solvent media, in the interface, and adsorbed on the surface. S stands for a site on the surface. The first step refers to diffusion from the solvent to the surface, whereas the second refers to adsorption. Let k1 and k1 be the rate constants for the first process and the reverse, and let k2be the adsorption rate constant.
Then, assuming the adsorption to be irreversible (see Fig. 5 and the Desorp- tion section below), the rate would be:
rate=k2[AI][S]. (7)
Using the stationary state approximation, for AIEquation (8) is obtained:
k1[Am]=k−1[AI]+k2[AI][S]=[AI](k−1+k2[S]). (8) Then:
[AI]=k1[Am]/(k−1+k2[S]). (9)
Substitution in 7 leads to Equation 10:
Rate=k2k1[Am][S]/(k−1+k2[S]). (10)
Equation 10 shows that if the second step is too fast in comparison with the first (k2[S] k−1), the rate equation is:
Rate=k1[Am]. (11)
Therefore, a first-order reaction should indicate that diffusion is the slow step.
If, on the other hand, the second step is very slow so that k2[S]k−1, the rate would be:
rate=k2k1[Am][S]/k−1, (12)
or
rate=k2K[Am][S], (13)
where K is the equilibrium constant of the first step.
Downloaded by [University of Connecticut] at 05:23 14 October 2014
In this case, the adsorption step would be the slowest path, and a second-order kinetics is obtained.
3. RESULTS
3.1. Precipitation with Silica and PNP
In Figure 2 the precipitation results are shown. In this figure both the amount of precipitate (p) and the amount of PNP adsorbed on the precipitate (ν) are plotted as a function of the concentration of PNP in solution.
It should be emphasized that solidpis obtained before extraction of PNP.
Solid A2was obtained fromp, after the extraction of PNP (see section 2.2). Since the PNP adsorbed onpis small, the amount of p and A2are considered here to be equal.
In Figure 3, these results were plotted in the way of an inverse Langmuir or L-plot, and the following lines were obtained in each case:
1/p=1.175/CPNP+0.00012, R2=0.98, (14)
1/ν=12.78/CPNP+0.012, R2 =0.97 (15)
Using Equation 14, a maximum of 8.3 g L−1 of precipitate could be expected (inverse of intercept in Eq. 14). Since the asphaltene concentration is 8 g l−1, this is an encouraging result. In any case, the percentages of precipitate are high, suggesting a high percentage of colloidal phase in solution. This is consistent with the 47% of precipitate material collected for the asphaltene solution in toluene (8 g l−1) saturated with PNP.
( p) (ν )
0 5 10 15 20 25 30 35 40
0 2000 4000 6000 8000 10000
Relative Weight (w)
CPNP (mg/L)
Figure 2. Yields of asphaltenes precipited (p, percentage of sample in solution) and co- precipitated PNP (ν, mg per gram of precipitated asphaltene) as function of concentration of PNP in solution (CPNP). Room temperature.pis in mg/100 ml andνin mg g−1.
Downloaded by [University of Connecticut] at 05:23 14 October 2014
-0,005 0 0,005
0,01 0,015 0,02 0,025 0,03
0 0,001 0,002 0,003
1/C (PNP)
1/w
a (1/p)
b (1/n)
Figure 3. Inverse Langmuir type plot corresponding to the results in Figure 2 (see text).
Also for a monolayer coverage (83 mg g−1, inverse of intercept in Eq. 15), an area about 190 m2/g for the colloid in solution could be calculated using Equa- tion 1. The area determined for the solid asphaltene in n-heptane using PNT was about 97 m2/g (see section 2.1). However, as described in the literature (17), this corresponds to the amount required to saturate theexternalarea of asphaltenes (about 41 mg g−1 for PNT in our case), the actual area being higher. Therefore, the above colloid area appears to be a reasonable value.
It should be mentioned that when this technique was applied to other as- phaltenes (see section 2 and Tab. 1 for sample details), no significant formation of precipitate was observed in toluene. However, preliminary tests with the sol- vent cumene (isopropyl benzene) have afforded large quantities of precipitate in all cases. Thus, this precipitation behavior appears to be a general property of asphaltenes.
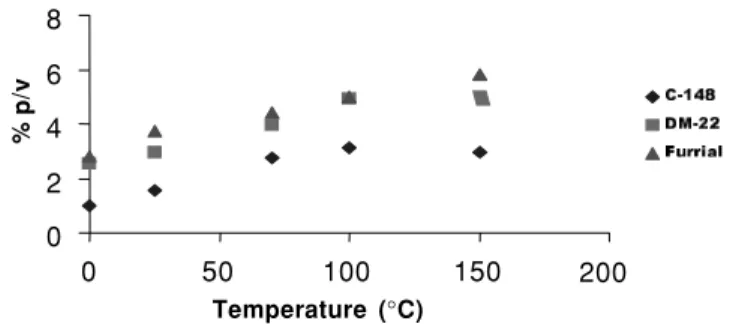
Figure 4 shows the precipitation results using crude oils and silica. As shown, the amount of asphaltene precipitated increases with temperature, approaching
0 2 4 6 8
0 50 100 150 200
Temperature (°C)
% p/v
Figure 4. Induction of crude oil precipitation by silica as a function of temperature. Y axis:
percentage of asphaltene precipitated per 100 ml of crude oil.
Downloaded by [University of Connecticut] at 05:23 14 October 2014
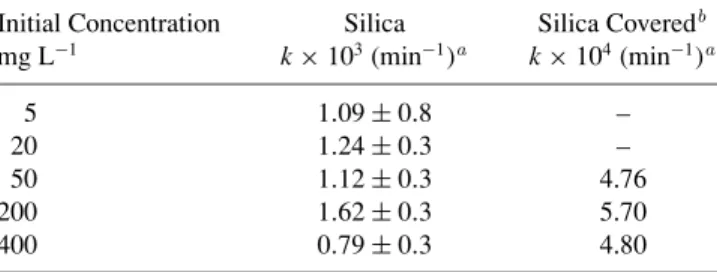
Table 2. Apparent First-Order Rate Constantkfor the Adsorption of Toluene Solution of Furrial Asphaltenes
Initial Concentration Silica Silica Coveredb mg L−1 k×103(min−1)a k×104(min−1)a
5 1.09±0.8 –
20 1.24±0.3 –
50 1.12±0.3 4.76
200 1.62±0.3 5.70
400 0.79±0.3 4.80
aCovered with asphaltenes adsorbed after one week from a toluene solution (200 mg L−1initial conc.).bAt room temperature.
asymptotically the total amount of asphaltene present in the crude. It is interesting to note that in the C-148 case, the usual precipitation by n-heptane addition (see Tab. 1) affords a much lower asphaltene yield than the ones shown in Figure 4. It should be mentioned that no precipitation at all was observed for these crudes in the absence of silica.
3.2. Adsorption Results
In Table 2 the values for the apparent first-order kinetic constants k, ob- tained for the studied solutions and surfaces, are shown. These were obtained by fitting the results to a first-order kinetics. The fittings were quite good for the 5–50 mg L−1 runs. However, for the 200 and 400 mg L−1 runs, the results sug- gested that the readings at long times should correspond to a slower rate (see Fig. 5).
Figure 6 shows the kinetic results for the desorption experiment. After 3000 min only 0.26% of the material initially adsorbed was desorbed in this experiment (see Experimental).
3.3. Adsorption Isotherms
The results of these experiments are shown in Figures 7a–7c. Note that for 18 and 48 h, the isotherms are L-type, whereas the one measured at 96 h shows a tendency toward H-type. This H-type form was finally obtained after 8 days (see Fig. 8). The very slow changes with time of these curves are an important property of these isotherms (see the discussion below).
Downloaded by [University of Connecticut] at 05:23 14 October 2014
0 10 0 0 20 0 0 30 0 0 40 0 0 50 0 0 60 0 0 70 0 0 80 0 0 90 0 0 10 0 00 0.4
0.6 0.8 1.0 1.2 1.4 1.
Absorbance
Time (min)
Figure 5. Adsorption kinetics for a toluene solution of Furrial alphaltenes (200 mg L−1) obtaines on silica at room temperature. Points are experimental and the curve is the fiting to a first order. (Reprinted from (18), with permission.)
0 500 1000 1500 2000 2500 3000
0.000 0.005 0.010 0.015 0.020 0.025 0.030 0.035
Absorbance
Time (min)
Figure 6. Desorption kinetics of Furrial asphaltenes from silica plate at room temperature in toluene. (Reprinted from (18), with permission.)
Downloaded by [University of Connecticut] at 05:23 14 October 2014
20 22 24 26 28 30 32 34 36 38 40
Solution concentration (mg L )
Asphaltenes in silica (Mg g )
19.5 20 20.5 21 21.5 22 22.5 23 23.5 24
Solution concentration (mg L )
Asphaltenes in silica (Mg g )
19 20 21 22 23 24 25
0 100 200 300 400 500
Solution concentration (mg L )
Asphaltenes in silica (Mg g )
a )
b )
c )
0 100 200 300 400 500
0 100 200 300 400 500
-1-1-1
-1 -1
-1
Figure 7. Adsorption isotherm of toluene solutions of Furrial asphaltenes on silica mea- sured by PSD at room temperature. a) after 18 hours; b) after 48 hours; c) after 96 hours.
Downloaded by [University of Connecticut] at 05:23 14 October 2014
0 10 20 30 40 50 60
0 100 200 300 400 500
Equilibrium concentration (mg L )
mg Asphaltenes/g silica
-1
Figure 8. Adsorption isotherm for the system: Furrial asphaltene/silica/toluene. Obtained after 8 days at room temperature. Each point is an average of at least three replicates.
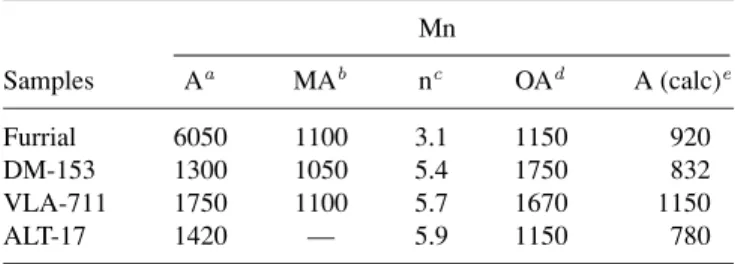
3.4. Molecular Weight Values
The Mn values measured in this work are shown in Table 3. The last col- umn was obtained after subtracting the value 113n from the fourth column (113 is the molecular weight of an octyl group). This procedure should give the ex- pected Mnfor asphaltenes (fifth column in Tab. 3). That is, the molecular weight corresponding to the free or non-aggregated sample (see below).
The following aspects are noteworthy. (1) There is no correlation between the MA and OA molecular weights and sulfur content (see Tab. 1 for sulfur content).
(2) The molecular weight reductions observed after methylation by the present method are either similar (Furrial case) or lower than others observed after methy- lation with diazomethane or other methylating reagents, where rupture of covalent bonds is not possible (15,16). Hence, these values are not consistent with possible de-polymerization reactions, where the rupture of covalent bonds involving sulfur or any other atoms would lead to low molecular weights.
Table 3. Number Average Molecular Weight (Mn) for Asphaltene and Derivative Samples in Nitrobenzene at 100◦C
Mn
Samples Aa MAb nc OAd A (calc)e
Furrial 6050 1100 3.1 1150 920
DM-153 1300 1050 5.4 1750 832
VLA-711 1750 1100 5.7 1670 1150
ALT-17 1420 — 5.9 1150 780
aasphaltene;bmethylated asphaltene;csee Equation 4-1;doctylated asphaltene;eexpected Mn value (see text).
Downloaded by [University of Connecticut] at 05:23 14 October 2014
4. DISCUSSION 4.1. Molecular Weights
The presence of the long octyl chains and the use of a polar solvent (nitroben- zene) and high temperatures warrant the absence of intermolecular interactions for the OA case. Due to steric hindrance, these long chains would inhibit the formation of aggregates. It is noteworthy that even under the present conditions asphaltene aggregation is apparent, particularly in the case of Furrial (compare first and fifth column in Tab. 3). As described above, Furrial crude oil has asphaltene precipita- tion problems. Thus, the large tendency for aggregation suggested by the high Mn
for this sample is somewhat anticipated.
The results for the methylated derivative ensure that any possible bond break- ing leading to reduction of molecular weight could be discarded. As shown previ- ously, the potassium naphtalide could easily break sulfide bonds (13,15). Accord- ing to the Mnvalues for the methylated asphaltenes, the sulfides in asphaltenes should be in thiophene rings, in which case the rupture of the corresponding C----S bonds does not reduce the molecular weight.
The most important conclusion regarding the results in Table 3 is that asphal- tene molecular weights should be around 1000 or lower (see column 5 in Tab. 3).
These results are in agreement with others reported using mass spectra (19–21) and other techniques (22). Thus, it appears that the long-standing question regard- ing asphaltene molecular weight has finally found the right answer: asphaltene molecular weights are near to or below 1000 g/mol on average.
4.2. Thermal Lens
As reported earlier, a plot of the thermal diffusivityDversus the logarithm of asphaltene concentration (log C) for toluene solutions afforded a curve with a minimum around C=50 mg L−1. A similar plot in THF showed no effect of the concentration onD(11). These results suggested a sequential aggregation of asphaltenes and a threshold for aggregation near the above concentration.
4.3. Precipitation Studies
The L-type isotherms of Figure 2, the corresponding linear plots of Figure 3, and the low solubility in toluene of the recovered precipitate (A2; see section 2.2) are clear evidence for precipitation occurring after the adsorption of PNP on the colloid surface.
Precipitation on the basis of the formation of molecular complexes could be discarded because in such a case, the amount of complex formedp(see Fig. 2),
Downloaded by [University of Connecticut] at 05:23 14 October 2014
being the result of a chemical reaction, would be related to CPNP by a straight line. These results strongly suggest that on adsorption, the PNP displaces the dispersing compounds that stabilize the colloid, leading to precipitation and to the low solubility of A2. Thus, as expected, the colloidal fraction of asphaltene (A2) has a low solubility in toluene. When the A2fraction was added to a toluene solution of A3(the soluble fraction; see section 2.2) the high solubility of the total asphaltene sample was recovered.
Since the insoluble fraction A2 represents a substantial amount of the sample (47%), the capacity of the soluble fraction A3 for dispersing the colloid should be very high. These aspects are further discussed below, where a more complete description of the colloid is given (see the desorption section below).
A similar argument could be used to account for the flocculation results (see Fig. 4). In the presence of an active surface SAand the colloid surface SC, the compounds dispersing the colloid (A3; see above) will partition between them, as shown in the Appendix. A higher affinity of A3for SAwill promote desorption from the colloid surface, reducing the stability of the colloid and promoting flocculation.
In the case of crude oils, where the solvency of the media is lower than toluene, precipitation was observed even at 0◦C, and complete precipitation was obtained at high temperatures (see Fig. 4). As expected, the precipitation increases with temperature (see Appendix).
The flocculation results in Figure 4 were performed with quite different crude oil, with small and large asphaltene content, and with and without flocculation problems (see section 2 and Tab. 1). Therefore, the presence of colloids in crude oils appears to be a general characteristic. As suggested by these results, contacting with an active surface will lead to flocculation, regardless of crude oil nature. An important consequence in this case is that there is no need for any composition or pressure change to flocculate asphaltene colloids.
As far as we know, the above results are the first ones in which desorption of dispersing compounds, leading to colloid flocculation, is possible without changing the media conditions. This is particularly the case for the silica experiments. These results provide very convincing evidence for the colloidal nature of asphaltenes, and suggest that any consideration of asphaltenes as molecular dispersion is erroneous and should be abandoned.
4.4. Adsorption Studies
Previously the adsorption isotherms on glass plates for Furrial and other asphaltenes without precipitation problems were reported (10). These are shown in Figures 9–11 for Furrial, Jobo, and Hamaca, respectively. These measurements were performed using the PSD method described above.
Several interesting features of these isotherms are discussed below.
Downloaded by [University of Connecticut] at 05:23 14 October 2014
Figure 9. Adsorption isotherm for Furrial asphaltenes measured at different times using PSD. Surface, glass plate; solvent, toluene, 25◦C. (a) 48 h; (b) 120 h. (Reprinted with permission from (10).)
Figure 10. Adsorption isotherm for Jobo asphaltenes measured at different times using PSD. Surface, glass plate; solvent, toluene, 25◦C. (a) 6 h; (b) 31 h; (c) 86 h. (Reprinted with permission from (10).)
Downloaded by [University of Connecticut] at 05:23 14 October 2014
Figure 11. Adsorption isotherm for Hamaca asphaltenes (sample PA) measured at differ- ent times using PSD. Surface, glass plate; solvent, toluene, 25◦C. (a) 6 h; (b) 31 h; (c) 86 h.
(Reprinted with permission from (10).)
The first one is related to the first step of these isotherms. As shown in these figures, saturation of the glass surface (first step) occurs forνvalues near 2×10⁻⁴ mg/cm2for the Furrial case. Higher values are apparent for the Hamaca and Jobo samples. The apparent area per molecule of asphaltenes (σ), in ˚A2/molec, could be obtained from Equation 16:
σ =Ma1019/νNA, (16)
where Mais the average molecular weight of the species adsorbed. When the aver- age molecular weight Mf, corresponding to the free or non-associated asphaltene (Mf ≈1000; see Tab. 3) and the aboveν values (in mg/cm2) are substituted in Equation 16, the value of 83 ˚A2/molec is obtained forσ. Of course, this value is much too small, suggesting that the molecular weight used in Equation 16 is too small. To have an idea of what molecular area to expect for a given molecular weight value, we could use Equation 17:
M=ρσ δNA10−24. (17)
In this equation,ρis the density in g/cm3andδis the width of the molecule in ˚A.
Assumingρ =1, a disk shape for asphaltenes, M =Mf=1000 andδ=3.5 ˚A (23), a more reasonable value, around 470 ˚A2, is obtained forσ. To obtain this area using Equation 16, Mashould be around 6000 or Ma=6 Mf.
Downloaded by [University of Connecticut] at 05:23 14 October 2014
A similar treatment could be performed with the silica isotherms (see Fig. 7c).
After 96 hours, about 24 mg g−1of asphaltene were adsorbed on the surface (first step). The correspondingσ could be obtained from Equation 4 using the Ssvalue determined for silica (13.7 m2/g; see Experimental) and the above Mf. In this way, a too-small value forσ, around 100 ˚A2, is obtained. Again a higher molecular weight should be used to obtain a more reasonable molecular area (Ma≈3 Mf).
These results suggest very strongly that, in the diluted concentration range considered (below 1000 mg L−1, see Figs. 7, 9–11), free asphaltenes, as well as small aggregates, are adsorbed on the glass or silica surfaces. Therefore, as suggested by the calculations in the above paragraphs, the average molecular weight of the sample adsorbed (Ma) should be higher than the average molecular weight of the free asphaltene (Mf) (between 3 and 6 times Mf). Hence, the first adsorption step on glass or silica is the consequence of the adsorption of free molecules and small aggregates of asphaltenes.
As usual, saturation of the surface would be the consequence of consumption of all vacant sites. Probably the surface is active enough so that no discrimination between free or aggregated asphaltenes is made.
It should be mentioned at this point that the solutions were equilibrated by allowing them to stand by for two days before contact with the surfaces (see section 2.2).
It is important to realize that the above results are not consistent with the adsorption of large aggregates in the first step. That would require a larger Ma, possibly 10 Mfor more. However, such adsorption could be expected for the second or third step (see the above isotherms).
According to the discussion above, these isotherms suggest that aggregation of asphaltenes should begin at very low concentration. This is particularly clear from the silica isotherms, where the first step is completed below 100 mg L−1(see Fig. 7). These arguments are substantiated by the thermal lens results described above.
Another important feature, common to all samples, relates the step-wise nature of these isotherms (see Figs. 7–11). It should be realized that whatever the effect causing this behavior, this should be one with the property of starting and stopping at certain solution concentration values. When the results for the adsorption on glass were first published, we discussed them in terms of micelle formation, since micelles have the above start–stop property, and several reports on micelle formation at CMC had been reported at the time (10). However, since the above data on thermal lens and the above close analysis of the glass and the silica isotherms are not consistent with any CMC, that micelle hypothesis now appears doubtful or wrong (see also section 1). At this time, the new results described above lead us to suggest that the step-wise isotherms appear to be the consequence of properties of the surface and the presence in the sample of fractions
Downloaded by [University of Connecticut] at 05:23 14 October 2014
of different solubility in the media. Certainly, in a mixture containing different fractions in solution, the dependence between solubility and concentration should be step wise. Thus, for a mixture of total concentration c, containing compounds c1, c2, c3, etc. with solubilities s1,s2,s3, such that s1<s2<s3, sequential or step-wise precipitation will occur for any value of c above these solubilities. As suggested by the silica–crude oil results (see Fig. 4), this fractional precipitation would be promoted by the surface.
Thus, the first step would correspond to the adsorption of the sample on the glass surface as described above, whereas the other steps should be the consequence of sequential adsorption according to differences in solubility. Thus, after the first step, mainly determined by properties of the mineral surface, the other steps would follow a sequence determined by solubility differences between the different fractions comprising the asphaltene mixture.
According to the PNP results, asphaltenes are a mixture of compounds with different solubilities. Of course, solubility and adsorption are related phenomena, and thus it could be expected that the less-soluble fraction will be adsorbed first.
It is expected that packing of the adsorbed layers would be a slow process because it occurs on the surface (mostly solid phase). As discussed below, this is likely to be the reason for the very slow changes observed in the isotherms (see Figs. 7, and 9–11). A slower process, other than mere adsorption, is also apparent in Figure 5 at long times (see section 3.2).
4.5. Kinetics
Since a first-order rate constant was obtained, the diffusion of solute to the solid surface should be the slow step (see section 2 and 3.2). If so, changing the surface should have no effect on the order. As shown in Table 2, this is the case when the surface is changed from silica to silica covered by asphaltenes. In order to analyze this point further, let us consider the rate for formation of products in both cases (see Methods).
For the silica case:
d[AI]/dt=k2[AI] [S]. (18)
For the asphaltene case, different site concentration [S] and adsorption rate con- stant k2should be considered. A similar equation is then obtained:
d[AI]/dt=k2[AI] [S], (19)
when k2 k−1 and also k2 k−1 diffusion to the surface is the slow step in both cases, and these rates become equal to the rate of disappearance of reactants.
Downloaded by [University of Connecticut] at 05:23 14 October 2014
Then:
−d[Am]/dt=k2[AI] [S], (20)
and
−d[Am]/dt=k2[AI] [S]. (21) The relation between these rates, R, is:
R= {d[Am]/dt/d[Am]/dt} =k2[AI] [S]/k2[AI] [S], (22) or
R=k1/k1=k2[AI] [S]/k2[AI] [S]. (23) Since diffusion is the slow step, the concentration of asphaltenes in the interface should be similar in both cases. Therefore, [AI]≈[AI] and:
k1/k1 =k2[S]/k2[S]. (24)
This equation shows that when the surface is changed the rate constant will change in all cases except when k2 [S] =k2 [S]. Thus, although the rate on both surfaces depends on diffusion, in general their relative values will depend on adsorption.
Taking average values for k1(1.17×10⁻³) and k1(5.08×10⁻⁴), then k1/ k1≈0.43, or less than 1. (see Tab. 2). This is expected in view of the high activity of the silica (a high value of k2) which usually leads to H-type isotherms in many systems, as is the case in Figure 8. Of course, this fact suggests that the affinity of the asphaltene surface by the asphaltene in solution (measured by k2) is also very high. Otherwise, a much lower value of k1/k1should be expected.
It is quite likely that the high values of k2, k2, and asphaltene composition combine to produce the precipitation results and step-wise isotherms described above for crude oils and adsorption on glass, respectively. For crude oils, the asphaltene surface adsorbed on silica will promote flocculation by irreversible adsorption of the soluble fractions, which keeps the colloidal phase in solution (see below). For the adsorption results, a high value of k2reflects the low solubility in toluene of the fraction being adsorbed.
4.6. Desorption and Irreversible Adsorption
The very low desorption of asphaltenes shown in Figure 6 strongly suggests that adsorption is mainly an irreversible process. As described above, the adsorbed asphaltene layer is not a monolayer formed by free asphaltenes. To be consistent with the results, that layer should contain aggregates. Due to the high adsorption capacity of silica, irreversible adsorption could be expected for compoundsin
Downloaded by [University of Connecticut] at 05:23 14 October 2014
Figure 12. Model to illustrate packing leading to insoluble adsorbed layer. (a) Adsorption of monomer (1) dimers (9-4) and trimers (2-6-5 and 3-8-7). Irreversible adsorption could be expected for molecules 1 to 4, but not for the others. (b) bonding between neighbors (packing) leading to insoluble layer or irreversible adsorption.
contactwith or bonded to the surface. However, this should not be the case for molecules, where such contact is not present (see Fig. 12a).
Thus, the above behavior suggests that after adsorption, the asphaltenes could bond to neighbor molecules in the surface, thereby leading eventually to a network insoluble in toluene (see Fig. 12b). It is plausible that the slow changes with time shown by the isotherms on glass (Figs. 9–11) and silica (Figs. 5 and 7) would be due to the building up of such a network. The following analysis and arguments are useful in this regard.
The average of the adsorption rate constants for the silica case is 1.17 × 10⁻³ min−1 (see Tab. 2). Thus, the average half time is t1/2=591 min. Then, after 4 t1/2=2366 min=40 hours, 94% of the sample has been adsorbed or the process is about to finish. However, as shown by the isotherms, important changes apparently occur at much later times (see also Fig. 5).
Thus, a process slower than the rate of adsorption must occur in the surface.
Of course, these changes are not due to adsorption because this is the fast step.
Therefore, in view of the almost irreversible adsorption described above, these slow changes are likely to be due to the building up on the solid surface of the above insoluble asphaltene network. That is, in a kinetically controlled process the molecules are adsorbed or precipitated. This would be followed by a thermody- namic controlled process, where those molecules packing badly are either expelled or relocated in the layer.
This discussion could also be relevant to the PNP results in particular and to colloidal behavior in general. For instance, the above large differences in solubility found for the fractions A1, A2, and A3(see section 2.2 and PNP sections) could in part be due to differences in packing rather than to large differences in chemical composition or structure. In fact, no significant differences were found in the elemental analysis of these samples (see Tab. 1).
Since fractions A1and A2should come from the colloidal phase, the molecules in that phase could engage in the formation of an insoluble network similar to the one described above. As shown in the experimental part (see solubility and precip- itation methods), the usual solubility is recovered when fraction A2is mixed with
Downloaded by [University of Connecticut] at 05:23 14 October 2014
Figure 13. Model for colloidal particle (cross-sectional cut). The core region c is inside the discontinuous curve, whereas the peripherial region is outside this curve. Molecules in c are well packed, whereas those in P are loosely packed. Solvent penetration of P (but not c) leads to colloid dispersion.
fraction A3. Evidently, this solubility behavior is acollectiveproperty depending on all species present.
The above results and comments could have important consequences on asphaltene colloidal structure and behavior, particularly when the connection be- tween solubility and packing is made. That is, we expect that low solubility indi- cates a good ability of the sample to pack.
Thus, colloid particles could be envisaged as being composed by a series of layers in which the capacity to form well-packed or low-soluble networks will decrease from the inside to the periphery (see Fig. 13). Molecules packing badly would be located at the periphery or relegated to the solution. Penetration of this loosely packed region or periphery by the solvent or media would allow solubilization of the colloid (see Fig. 13).
When the molecules in the periphery are removed (as in the case of the silica–crude oil experiments, in which they are removed by the silica) the better packed region, impervious to the solvent, will be exposed. This would lead to the observed flocculation.
An analogous situation could be envisaged for the PNP experiments. Here, the loosely bonded molecules will be displaced by the phenol, leading to precipi- tation. The A2sample resulting from extraction of the phenol is well packed, and cannot be dissolved by toluene.
In another experiment a sample of asphaltenes was modified by heating to reduce solubility in toluene. When this sample was used as the adsorption surface to adsorb toluene solutions of asphaltenes, the resulting isotherm was also of the step-wise or multilayer type. Besides, adsorption of resins on asphaltenes also yielded step-wise isotherms when measured in hexane, or toluene–hexane mixtures (24). Thus, the step-wise adsorption phenomena appear to be a general property of asphaltenes and resins. Thus, in this sense, surfaces such as silica or glass are convenient media to observe the phenomena, but they are not responsible for it.
Downloaded by [University of Connecticut] at 05:23 14 October 2014
As was the case for asphaltenes, the two-step isotherm found for the adsorp- tion of resins on asphaltenes, should be due to differences in solubility or packing.
That is, the resin molecules adsorbed in the first step would have a better ability to pack than those adsorbed in the second.
In this way we see that the above model can easily be extended to petroleum colloids, to afford a picture consistent with all the experimental evidence described above. As shown in Figure 13 and described above, the core of the particle is formed by a sequence of asphaltene layers in which the ability to pack decreases from the center to the periphery, whereas the solubility has the opposite trend. These asphaltene layers will be followed by layers of resins with the same trend in packing capacity. Since a loose packing is expected for the resins in the periphery section, the solvent or media can easily penetrate or diffuse into this section, providing a favorable increase in mixing entropy. This fact, together with a favorable (negative) enthalpy of mixing, will lead to the negative free energy of mixing required for colloid dispersion.
4.7. Adsorption in the Presence of Surfactants
The results corresponding to this section will be published elsewhere. Here we will comment briefly on some results relevant to the present article.
It is interesting to compare the isotherm on silica with and without surfac- tant (Figs. 8 and 14). Figure 14 shows the isotherm in the presence of 1% NPE (nonylphenol ethoxylated), a quantity small enough to inhibit the adsorption but not enough to stop it completely. It is apparent that this isotherm resembles the step-wise isotherms on glass described above.
Thus, it is quite likely that by adsorbing on very active sites of the surface, the surfactant reduces the adsorbing capacity of the silica surface, thereby leading to a more selective adsorption. Although the step-wise behavior is somewhat present in the isotherm without surfactant, this is blurred by dispersion in the experimental points (see Fig. 7).
It should be noted that the steps in Figure 14 are displaced to the left when compared with the steps observed for the glass case (see Figs. 9–11). This is likely to be due to the differences in surfaces. Thus, location of the steps appears to be a function of the surface. This is consistent with the hypothesis discussed above, which disregards any major influence of aggregation or micelle formation in solution on the location of the steps (see above).
As shown in Figure 14, more than 1% surfactant would be required to stop asphaltene adsorption effectively. According to the results above and the model depicted in Figure 12b, to reach the silica surface, the surfactant should break many bonds in order to effectively penetrate and dislodge the asphaltene layer.
From this analysis is apparent that the best results would be expected in cases
Downloaded by [University of Connecticut] at 05:23 14 October 2014
Figure 14. Adsorption isotherm for the system Furrial asphaltene/silica/toluene +1% PNE at room temperature.
where the number of bond ruptures is keep to a minimum. This would be the case for surfactants capable of dislodging large aggregates from the surface; or, in other words, with a capacity to disperse asphaltene colloids.
Although the 1% of surfactant above appears to be a large quantity compared with the asphaltene present, one should bear in mind that the surface is very active.
Perhaps a more fair evaluation of surfactant efficiency would require the use of another surface, such as glass or clay. However, the use of low activity surfaces in general is difficult because the amount adsorbed is so low that special techniques, such as the PSD method described above, must be used to obtain quantitative results.
An alternative method for the convenient evaluation of surfactants could be achieved by treating the silica with enough surfactant so as to obtain a surface activity similar to others more representative of any real situation, such as clays and glass. The similarity could be judged by the corresponding isotherms, such as the case of glass and silica +1% NPE described above.
4.8. Relevance of the Present Results to Precipitation during Oil Production
The above results, discussion, and comments are relevant to the problem of asphaltene precipitation during the production of crude oils. A point we have tried
Downloaded by [University of Connecticut] at 05:23 14 October 2014
to underscore is that the published theoretical and experimental treatment of this problem had been focused on the effect of pressure on solubility and had neglected the role of surfaces contacted by the crude during production operations.
There is no doubt that a reduction in pressure will reduce solubility in general and asphaltene solubility in particular. However, as shown above, 47% of Furrial asphaltene is insoluble in toluene, and yet the solubility of the complete mixture in toluene is very high (57 g L−1). As shown above, the colloidal or insoluble phase in the crude oils examined could also be very high, and yet no precipitation at all is observed at room conditions. That reveals that the dispersion capacity of the soluble compounds or compounds in the external layer of the colloid is very high.
For instance, the crude oil can be diluted with large quantities of poor solvents and no asphaltene precipitation is produced. This is the case for Furrial, where more than one volume of n-heptane is required. Thus, even large reductions in solubility parameter do not necessarily lead to flocculation.
However, the sole contact of any asphaltene solution with an active surface, or the dislodging of the dispersion compounds from the colloids, will lead to substantial precipitation of asphaltenes.
The above comments and results suggest that although low solubility is the reason for colloid formation, it is not necessarily the reason for colloid precipita- tion or flocculation.
The results and data above point out very clearly that flocculation is caused by the desorption of soluble asphaltenes or soluble resins from the surface of asphaltene or petroleum colloids, respectively.
5. CONCLUSIONS
Use of the reductive alkylation technique, combined with measurements in nitrobenzene at high temperature, showed that the molecular weight of asphaltene is comparatively small, being around 1000 g/mol or smaller. From the analysis of the first layer, corresponding to the step-wise adsorption isotherms on glass and silica, the adsorption of free asphaltenes and small aggregates was proposed.
The analysis of results suggests the formation of small aggregates in very diluted toluene solutions (less than 100 mg L−1). This proposition is in agreement with previous results obtained using the thermal lens technique, which suggests that aggregation in toluene should begin around 50 mg L−1. These data and results are consistent with a sequential aggregation process rather than a process like micelle formation at the CMC.
Precipitation experiments performed with toluene solutions of Furrial as- phaltenes using PNP showed the presence of fractions of very low (A1) and low (A2) solubility in toluene (47% of total sample). This suggests that these fractions
Downloaded by [University of Connecticut] at 05:23 14 October 2014