The potential of a combination of pungent spices as a novel
supplement in gilthead seabream ( Sparus aurata ) diets to aid in the strategic use of fi sh oil in
aquafeeds: a holistic perspective
Alberto Ruiz
1,2*, Ignasi Sanahuja
1, Karl B. Andree
1,
Dolors Furones
1, Paul G. Holhorea
3, Josep A. Calduch-Giner
3, Jose J. Pastor
4, Marc Viñas
5, Jaume Pe ´ rez-Sa ´ nchez
3,
So fi a Morais
4and Enric Gisbert
11Aquaculture Program, Institut de Recerca i Tecnologia Agroalimentàries (IRTA), Centre de La Ràpita, La Ràpita, Spain,2Ph.D. Program in Aquaculture, Universitat de Barcelona, Barcelona, Spain,
3Nutrigenomics and Fish Growth Endocrinology Group, Institute of Aquaculture Torre de la Sal, Consejo Superior de Investigaciones Cientı´ficas (CSIC), Castello´n, Spain,4Innovation Division, Animal Science Unit, Lucta S.A. Bellaterra, Spain,5Sustainability in Biosystems, Institut de Recerca i Tecnologia Agroalimentàries (IRTA) Torre Marimon, Caldes de Montbui, Barcelona, Spain
This work studied the potential of a combination of pungent spices (capsicum, black pepper, ginger, and cinnamaldehyde) to be used as a supplement in diets of gilthead seabream (Sparus aurata; 44.1 ± 4.2 g). During 90 days, fish were fed three experimental diets with low inclusion offish oil and containing poultry fat as the main source of lipids, supplemented with graded levels of the tested supplement: 0 (control), 0.1 (SPICY0.1%), and 0.15% (SPICY0.15%). As a result, the pungent spices enhanced the growth performance, the activity of the bile-salt- activated lipase in the intestine, and decreased fat deposit levels within enterocytes. The SPICY0.1% diet reduced the feed conversion ratio and the perivisceral fat index and lipid deposits in the liver. Moreover, the ratio of docosahexaenoic acid/eicosapentaenoic acid infillet increased infish fed the SPICY0.1%diet, while the hepatic levels of docosahexaenoic acid and total n-3 polyunsaturated fatty acids increased infish fed the SPICY0.15%diet. Furthermore, there was an effect on the expression of some biomarkers related to lipid metabolism in 2-h postprandialfish (fasn,elovl6,scd1b,cyp7a1,lpl, andpparb), and in 48 h fasted-fish fed with the SPICY0.1%diet, a regulation of the intestinal immune response was indicated. However, no significant differences were found in lipid apparent digestibility and proximate macronutrient composition. The spices did not affect biomarkers of hepatic or oxidative stress. No differences in microbial diversity were found, except for an increase in Simpson’s Index in the posterior intestine offish fed the SPICY0.1%diet, reflected in the increased relative abundance of the phylum Chloroflexi and lower relative abundances of the generaCampylobacter,Corynebacterium, andPeptoniphilus. In conclusion, the supplementation of gilthead seabream diets with pungent spices at an inclusion of 0.1% was beneficial to enhance growth performance and feed utilization;
OPEN ACCESS
EDITED BY Roy Ambli Dalmo,
UiT The Arctic University of Norway, Norway
REVIEWED BY Murat Arslan,
Atatürk University, Türkiye Xu-Fang Liang,
Huazhong Agricultural University, China
*CORRESPONDENCE Alberto Ruiz
RECEIVED13 May 2023 ACCEPTED08 September 2023 PUBLISHED25 September 2023
CITATION
Ruiz A, Sanahuja I, Andree KB, Furones D, Holhorea PG, Calduch-Giner JA, Pastor JJ, Viñas M, Pe´rez-Sa´nchez J, Morais S and Gisbert E (2023) The potential of a combination of pungent spices as a novel supplement in gilthead seabream (Sparus aurata) diets to aid in the strategic use of fish oil in aquafeeds: a holistic perspective.
Front. Immunol.14:1222173.
doi: 10.3389/fimmu.2023.1222173
COPYRIGHT
© 2023 Ruiz, Sanahuja, Andree, Furones, Holhorea, Calduch-Giner, Pastor, Viñas, Pe´rez-Sa´nchez, Morais and Gisbert. This is an open-access article distributed under the terms of theCreative Commons Attribution License (CC BY).The use, distribution or reproduction in other forums is permitted, provided the original author(s) and the copyright owner(s) are credited and that the original publication in this journal is cited, in accordance with accepted academic practice. No use, distribution or reproduction is permitted which does not comply with these terms.
reduce fat accumulation in the visceral cavity, liver, and intestine; and improve thefish health status and condition. Results suggest that the tested supplement can be used as part of a nutritional strategy to promote a more judicious use of fish oil infish diets due to its decreasing availability and rising costs.
KEYWORDS
phytogenics, spices, anti-inflammatory, DHA/EPA ratio, digestion, bile salts, docosahexaenoic acid, microbiota
1 Introduction
It is well-established that n-3 long-chain polyunsaturated fatty acids (n-3 LC-PUFAs), particularly eicosapentaenoic (C20:5n-3;
EPA) and docosahexaenoic (C22:6 n-3; DHA) acids, have multiple beneficial effects in vertebrate health, such as promoting a correct neurophysiological development and in the prevention of cancers, cardiovascular, and inflammatory diseases (1–3). The main source for humans of these n-3 LC-PUFAs has traditionally been the dietary intake of fish and seafood. However, fish are also dependent on their dietary intake, since many marinefishes have a restricted ability to biosynthesize DHA and EPA due to their low capacity to desaturate and elongate linoleic (C18:2 n-6) and alpha- linolenic (C18:3 n-3) acids (4). Thus, n-3 LC-PUFAs have been usually incorporated to aquafeeds as fish oil. Nevertheless, the decreasing availability of fish oil to sustain the growth of aquaculture worldwide, coupled with its rising cost, have been a strong driver to search for functional ingredients to reducefish oil in aquafeeds while maintainingfish health and welfare, and n-3 LC- PUFA levels within the recommended and expected range for the consumer.
During recent decades, the use of plant-based oils as an alternative source to fish oils for dietary energy has been widespread among aquafeed manufactures, given their lower cost and higher availability. The partial replacement offish oil by vegetal oils does not usually affectfish performance in terms of growth and feed utilization (5, 6). Nonetheless, some studies have reported important changes in the fatty acid profile of the fillet, with a reduction in the levels of EPA and DHA and an increase in alpha- linolenic, linoleic, and oleic (C18:1 n-9) acids (5–7). Rendered fats from animals are another affordable and widely available resource, with a growing interest in its improved use in the context of a circular bioeconomy. Moreover, besides containing more n-3 LC-PUFAs and less n-6 PUFAs than plant-based oils (8), they have a higher level of saturated fatty acids (SFAs) and monounsaturated fatty acids (MUFAs), which are preferential substrates for metabolic energy production (b-oxidation), sparing LC-PUFAs from catabolism (9).
For these reasons, rendered animal fats have been advocated as a better alternative, compared to vegetable oils, to partially replacefish oil infish feeds. Nonetheless, the substitution offish oil by rendered animal fats still leads to a reduction in the levels of DHA and EPA in thefillet, even if less marked than with vegetable oils, although it does
not normally compromisefish performance (10). Furthermore, n-3 LC-PUFA are important regulators of metabolic pathways, with well- known hypolipidemic and hypocholesteremic effects in vertebrates (11), including fish (12). Therefore, fish oil replacement by either vegetal or land-based animal oils can cause important changes in lipid and energy metabolism (13, 14), which may lead to physiological disorders, such as a high accumulation of fat deposits within enterocytes, hepatic vacuolization and steatosis, and high levels of perivisceral fat (10,15).
However, the reduction infish oil levels in aquafeeds is inevitable, and although alternative sources of n-3 LC-PUFA are emerging (e.g., algal oils, heterotrophic single cell organisms, genetically modified oilseeds), available volumes and production costs are still not at a level that they could bridge the gap in the near future. Therefore, in the meantime, new strategies are required to mitigate some of the negative effects associated with the reduction infish oils infish diets. The present study explores the use of supplements with a lipotropic function.
Several studies have demonstrated that the incorporation of ingredients with a lipotropic function in fish diets can regulate thefishes’lipid profile, reducing physiological disorders such as inflammation and improving their performance (16,17). Considering studies in higher vertebrates, spices are promising candidates as feed additives, which should be further explored in this context. Pungent vegetal substances are valued in cooking for their intenseflavor and aroma and for their properties as food preservatives, but they also have many well- demonstrated physiological benefits (18, 19). For instance, mammalian studies have established that pungent spices act as hypocholesterolemic and hypotriglyceridemic agents (similarly to n-3 LC-PUFA infish oils) and stimulate digestion, and having antioxidant, antimicrobial, and anti-inflammatory effects. Thanks to these properties, spices are also commonly used as nutraceuticals in humans, with many therapeutic and prophylactic applications, such as prevention or reduction in obesity, diabetes, and carcinogenesis, among others (18,19).
The aim of this work is to offer a holistic insight of the effects of supplementing a reducedfish oil diet containing poultry fat as the major lipid source (high in SFAs) with a product based on a combination of capsicum, black pepper, and ginger oleoresins, and cinnamaldehyde, in terms of fish performance and overall physiological status, including nutrient metabolism, immune response, and gut microbial profile. The study was performed in gilthead seabream (Sparus aurata), since this is one of the most
important farmed marinefish species in the Mediterranean area.
2 Materials and methods
2.1 Ethics statement
All procedures involvingfish manipulation and tissue sampling complied with the Spanish (law 32/2007 and Royal Decree 1201/
2015) and the current European legislation (EU2010/63) and were authorized by the Ethical Committee of the Institute of Agrifood Research and Technology and the Generalitat of Catalunya (CEEA 219/2020).
2.2 Animals, diets, and experimental design
The 90-day feeding trial was carried out at the Institute of Agrifood Research and Technology (IRTA) in La Ràpita (Tarragona, Spain). After an acclimation period of 2 weeks, juveniles of gilthead seabream (initial body weight, BWi= 44.1 ±
4.2 g; mean ± standard deviation, SD) obtained from a commercial fish farm (Piscicultura Marina Mediterranea SL, Andromeda Group, Valencia, Spain) were randomly distributed in 12 tanks of 450 L (30fish per tank; initial density = 3 kg m−3; N = 360). To guarantee water quality maintenance, tanks were connected to an IRTAmar™ water recirculation system, following the natural photoperiod (June to August at 40.63N–0.66E). Water temperature, dissolved oxygen, and pH were kept at 22.5 ± 0.5°C, 6.3 ± 0.2 mg/L (OXI330, Crison Instruments, Barcelona, Spain) and 7.6 ± 0.01 (pH meter 507, Crison Instruments), respectively.
Salinity, nitrite, and ammonia levels were 36‰ (MASTER-20 T Hand-Held Refractometer, ATAGO Co. Ltd., Italy), 0.16 ± 0.1 mg NO2−/L, and 0.22 ± 0.08 mg NH4+/L (HACH DR 900 Colorimeter, Hach Company, Spain), respectively.
Three experimental diets (Table 1; 3 mm pellet size) were designed to evaluate the potential use of an encapsulated combination of capsicum, black pepper, and ginger oleoresins, and cinnamaldehyde (Lucta S.A., Spain; Patent Number WO/
2022/117810) as a feed additive. The encapsulation serves to enable the manipulation of the pungent spices during feed preparation but has no functional effect (in the animal), as the
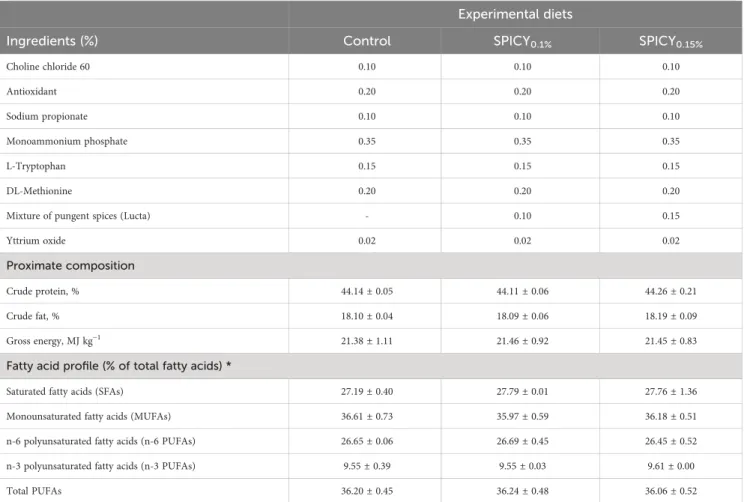
TABLE 1 Ingredient formulation, proximate, and fatty acid composition of experimental diets: a control and two basal diets supplemented with a mixture of pungent spices (capsicum, black pepper, ginger, and cinnamaldehyde) at a dietary inclusion level of 0.1 (SPICY0.1%) and 0.15% (SPICY0.15%).
Experimental diets
Ingredients (%) Control SPICY0.1% SPICY0.15%
Fishmeal Super Prime 7.50 7.50 7.50
Fishmeal 60 5.00 5.00 5.00
Fish protein concentrate 2.00 2.00 2.00
Feathermeal hydrolysate 5.00 5.00 5.00
Porcine blood meal 3.00 3.00 3.00
Poultry meal 15.00 15.00 15.00
Aminopro NT70—C. glutamicum 4.00 4.00 4.00
Corn gluten meal 8.00 8.00 8.00
Soybean meal 48 12.00 12.00 12.00
Sunflower meal 5.00 5.00 5.00
Wheat meal 10.31 10.31 10.31
Whole peas 5.00 5.00 5.00
Pea starch (raw) 2.40 2.40 2.40
Fish oil 3.02 3.02 3.02
Soybean oil 2.35 2.35 2.35
Poultry fat 8.04 8.04 8.04
Vitamin and mineral premix 1.00 1.00 1.00
Vitamin C35 0.05 0.05 0.05
Vitamin E50 0.02 0.02 0.02
Betaine HCl 0.20 0.20 0.20
(Continued)
active ingredients should be released during the extrusion process.
A basal diet was formulated, which included a high content of poultry fat and lower levels offish oil and soybean oil. This formula was chosen to increase the levels of SFAs (27% of total fatty acids;
Table 1) compared to traditional fish oil replacement strategies based on vegetable oils, and was hypothesized to result in increased body fat deposition. The two other experimental diets had the same ingredient formulation and proximate composition, but were supplemented with the encapsulated product at two different inclusion levels before extrusion: 0.1 (SPICY0.1%) and 0.15%
(SPICY0.15%). The choice of these inclusion levels was based on a previous dose–response trial performed in the same species in which the same combination of pungent spices was tested at doses between 0.05% and 0.15% (20), obtaining the best results in performance at 0.1% and 0.15%. In particular, at these inclusion levels, an improvement on feeding efficiency and lipid apparent digestibility, a reduction in hepatic lipid stores, decreased fat accumulation in fillet, and increased levels of n-3 PUFA (including EPA and DHA) in fillet. The three diets were isonitrogenous (44% crude protein), isolipidic (18% crude fat), and isoenergetic (21.4 MJ/kg), and were manufactured by Sparos Lda. (Portugal) following the procedures described by Salomón et al. (21). Yttrium oxide (Y2O3, Sigma Aldrich, Spain) was included in the diets at 0.2 g/kg as an inert marker to assess apparent
digestibility coefficients (ADCs) of macronutrients. Each experimental diet was randomly assigned to four tanks before the beginning of the nutritional assay. During the 90-day trial, feed was distributed twice a day in 12 takes spread over an hour (one each 5 min) with automatic feeders (Arvo-Tec T Drum 2000, Finland).
Once a month, fish were anesthetized with buffered tricaine methanesulfonate (MS-222, Sigma-Aldrich, Spain; 100 mg/L) for measuring growth in body weight (BW) and standard length (SL) in order to monitor somatic growth. In addition, the uneaten dried pellets from each tank were collected and weighed to ensure that sufficient amount of feed was being offered and to calculate the daily feed intake (22). For assessing ADCs of lipids and proteins, feces were collected by means of a sedimentation column 10–12 h after removal of uneaten feed during three consecutive days. Then, pooled samples from the same tank were frozen at−20°C until biochemical analyses.
2.3 Sampling and fi sh performance indicators
At the end of the trial,fish were fasted for 48 h and anesthetized with 100 mg/L of MS-222, and theirfinal body weight (BWf) and standard length (SLf) were individually measured. The following key performance indicators were also calculated:
TABLE 1 Continued
Experimental diets
Ingredients (%) Control SPICY0.1% SPICY0.15%
Choline chloride 60 0.10 0.10 0.10
Antioxidant 0.20 0.20 0.20
Sodium propionate 0.10 0.10 0.10
Monoammonium phosphate 0.35 0.35 0.35
L-Tryptophan 0.15 0.15 0.15
DL-Methionine 0.20 0.20 0.20
Mixture of pungent spices (Lucta) - 0.10 0.15
Yttrium oxide 0.02 0.02 0.02
Proximate composition
Crude protein, % 44.14 ± 0.05 44.11 ± 0.06 44.26 ± 0.21
Crude fat, % 18.10 ± 0.04 18.09 ± 0.06 18.19 ± 0.09
Gross energy, MJ kg−1 21.38 ± 1.11 21.46 ± 0.92 21.45 ± 0.83
Fatty acid profile (% of total fatty acids) *
Saturated fatty acids (SFAs) 27.19 ± 0.40 27.79 ± 0.01 27.76 ± 1.36
Monounsaturated fatty acids (MUFAs) 36.61 ± 0.73 35.97 ± 0.59 36.18 ± 0.51
n-6 polyunsaturated fatty acids (n-6 PUFAs) 26.65 ± 0.06 26.69 ± 0.45 26.45 ± 0.52
n-3 polyunsaturated fatty acids (n-3 PUFAs) 9.55 ± 0.39 9.55 ± 0.03 9.61 ± 0.00
Total PUFAs 36.20 ± 0.45 36.24 ± 0.48 36.06 ± 0.52
*Complete fatty acid profile of experimental diets is detailed inSupplementary Table S1. The proximate and fatty acid composition of diets were analyzed in duplicate; values are represented as mean ± standard deviation (SD).
Specific growth rate (SGR; %=day)
= 100ln ½BWf(g) − ln BWi(g)=time (days):
Fulton0s condition factor (K) = 100BWf(g)=SLf(g)3
Feed intake (FI, g=fish)
= total feed intake per tank (g)=number of fish per tank (g)
Feed conversion ratio (FCR)
= total feed intake per tank (g)=fish biomass increase per tank (g) In addition, eightfish per tank (32 per dietary treatment) were randomly selected and euthanized with an overdose of MS-222 (300 mg/L) for sampling different tissues for the analyses described below. In particular, the perivisceral fat was gently separated from the gastrointestinal tract in sixfish per tank (four replicate tanks per diet) with the aid of a round-ended scalpel and individually weighed to calculate the perivisceral fat index (PVFI; %) = perivisceral fat weight (g)/BWf(g). The livers of sixfish per tank were also weighed to calculate the hepatosomatic index (HSI; %) = liver weight (g)/
BWf(g). Then, a piece of liver (1.5–2 cm2) and a piece of anterior intestine (AI; approximately 4 cm) from three individuals per tank (12fish per diet) werefixed in 10% neutral buffered formalin (pH = 7.2) and stored at 4°C until histological analysis. The AI was selected because this region of the intestine has high rates of fat digestion and absorption (23). The rest of the liver was divided in pieces and frozen at −80°C to further assess hepatic antioxidant status and metabolic biomarkers (four replicate tanks per diet). The fillet and the liver of threefish per tank were stored at−20°C until analyses of proximate and fatty acid composition. To evaluate the profile of bile acids (BAs), the walls of the gallbladders of fourfish per tank were broken with the edge of a scalpel, and the content of allfish from the same tank were emptied together into one tube (four replicate tanks per diet) and frozen at −80°C. With the purpose of studying the effect of the diet on hepatic and intestinal gene expression profile of 48 h fastedfish, a piece of the liver and a piece of AI (approximately 1 and 2 cm2, respectively) of two individuals per tank (eight per dietary treatment) were separately immersed in 5 volumes of RNAlater® (Sigma-Aldrich, USA), incubated at 4°C for 24 h and stored at −80°C. A section of AI (approximately 4 cm long cut from the pyloric caeca) and posterior intestine (PI; approximately 4 cm long cut from the anus anteriorly) from threefish per tank (12 per treatment) were taken and opened lengthwise under sterile conditions. The mucosal content was gently scraped with a round-edge spatula and immediately frozen at−80°C for further microbial analysis. Sampling was performed at 48 h after the last feeding to ensure sample stability and avoid contamination by allochthonous bacteria from the feces in the case of intestinal microbiota (24).
The rest of thefish were returned to their respective tanks and fed for 3 days. Then, 10 2-h postprandial fish per tank (40 per treatment) were netted and euthanized with 300 mg/L of MS-222 for tissue sampling. The luminal content of the AI of fourfish per tank was stripped with tweezers into one tube (four replicates per
diet) and frozen at−80°C for future analysis of the BA profile. The digestive tract of fourfish per tank was divided in two regions: i) the stomach and pyloric caeca and ii) the AI. Both regions were separately stored at −80°C until analysis of pancreatic digestive enzymes. A piece of the liver and AI from twofish per tank (eight per treatment) were dissected and conserved as previously described for gene expression analysis.
2.4 Proximate and fatty acid composition
For biochemical analysis, a pool of three liver pieces per tank were homogenized together, while three fillets per tank were individually homogenized (IKA T25 digital ULTRA-TURRAX, IKA Works, USA). The protocols described by Lowry et al. (25), Folch et al. (26), Dubois et al. (27), and AOAC (28) were followed to determine the levels of total protein, lipids, carbohydrates, and ash content in livers and fillets. Fatty acid profile was obtained as described by Ramos-Júdez et al. (29). In brief, transmethylated fatty acids from total lipids were extracted, purified, and finally quantified by gas-liquid chromatography on a Thermo Trace GC (Thermo Fisher, Spain) coupled to a TRACE™ TR-FAME GC Column (Thermo Scientific, Spain), using heneicosylic acid (21:0) as internal standard (ref. H5,149, Sigma-Aldrich, Spain).
Protein and lipid ADCs were calculated according to Cheng and Hardy (30) using Y2O3as inert marker:
ADC of nutrient ( % ) = 100 ½1 − (% Y2O3 in diet=% Y2O3 in feces) (% nutrient in feces=% nutrient in diet) The Y2O3concentration was determined using an Agilent 7700 ICP-MS (Agilent Technologies, USA).
2.5 Hepatic metabolism and antioxidant stress
Biomarkers of hepatic metabolic and antioxidant stress were evaluated following the methodology described by Ruiz et al. (31).
In brief, homogenized pools of three liver pieces (approximately 100 mg each) per tank resuspended in a lysis solution (1.24 mM Triton X-100, 1 mM EDTA, and 1 mM NaHCO3) with a stabilizer solution (3.7 mM EDTA, 5 mM b-mercaptoethanol), 1:1 v/v, were centrifuged (5,000×g, 10 min, 4°C), and supernatants were collected. Lactate dehydrogenase, aspartate transaminase, and alanine transaminase activities were quantified following the methodology of Bergmeyer and Bernt (32–34) with commercial kits (ref. 41,222, ref. 41,272, ref. 41,282; Spinreact, Spain). To evaluate the antioxidant condition of the liver, homogenized pools of three pieces (approximately 60 mg each) per tank resuspended in 5 volumes v/w of buffer (150 mM KCl, 1 mM EDTA, pH 7.4) were centrifuged (9,000×g, 30 min, 4°C), and the supernatants were collected. Then, superoxide dismutase (SOD), catalase (CAT), and glutathione reductase (GR) activities were quantified following the protocols of McCord and Fridovich (35), Aebi (36), and Carlberg and Mannervik (37). Lipid peroxidation
(LPO) levels were estimated through thiobarbituric acid reactive substances (TBARs) as described by Solé et al. (38), and total antioxidant capacity (TAC) was measured following the manufacturer’s instructions of the Total Antioxidant Capacity Assay Kit (ref. MAK187, Sigma-Aldrich, USA). The above- mentioned oxidative stress biomarkers were normalized to soluble protein content (39), except for SOD activity, which was expressed as percent of enzyme inhibition. All described measures were run in triplicate at 25°C by UV/Vis spectrophotometry (Infinite M200 Plate Reader, Tecan Switzerland) and analyzed with the Magellan™ software (v6, Tecan).
2.6 Pancreatic digestive enzymes
Pools of four samples of i) stomach and pyloric ceca and ii) AI were separately homogenized (IKA T25 digital ULTRA-TURRAX, IKA Works) in 5 volumes v/w of ice-cold distilled water and centrifuged (3,300×g, 3 min, 4°C), and the supernatant was collected for quantification of pancreatic digestive enzymes (total alkaline proteases, a-amylase, and bile-salt-activated lipase) following the guidelines of Ruiz et al. (31). Samples (enzymatic crude extracts) were handled according to Solovyev and Gisbert (40) in order to prevent their degradation during storage and handling.
2.7 Bile acid quanti fi cation
Bile acid (BA) quantification was performed as previously described by Herrero-Encinas et al. (41) with modifications. BA extraction from gallbladder bile samples was performed by extraction of 100 μL of water-diluted bile (1/2,000) with 400 μL of acetonitrile (ACN) containing internal standard (chenodeoxycholic acid-d4, CDCA-d4). After vortex and centrifugation, supernatants were diluted 1/10 in H2O:ACN (1:1 v/v) and directly injected in the liquid chromatograph–mass spectrometer (LC-MS). Intestinal digesta samples were first lyophilized and homogenized on a TissueLyzer II (QIAGEN, Germany). Then, 20 mg of homogenate was extracted with 800 mL of H2O:ACN (1:1 v/v) including the internal standard for 15 min and centrifuged (15,000×g, 10 min, 4°C), and the supernatants diluted again in H2O:ACN (1/1,000).
Quantification of BAs was performed by LC-MS using response comparison against calibration curves generated using pure BA standards. Chromatographic separation was performed on an ACQUITY UPLC I-Class connected to a Xevo-G2 QTof mass spectrometer, using QuanLynx v4.2 software for operations and quantification (Waters Corp., USA).
2.8 Histological analyses
To evaluate the histological condition, small segments offixed liver and AI (approximately 0.5–1 cm2) were dehydrated in ethanol solutions of graded concentrations, cleared with xylene, and embedded in paraffin. Serial sections of 4 μm stained with
hematoxylin and eosin were examined under light microscopy (Leica DM LB, Leica Microsystems) by means of a digital camera at 600 dpi (Olympus DP70, Olympus Europa, Germany).
Inflammation and accumulation of fat deposits were semi- quantitatively evaluated from 1 to 5 following the classification described by Ruiz et al. (31). Semi-quantitative analyses were performed following a random order of samples, under blinded conditions by two different observers (42). In the images of AI, the following parameters were also measured using the software ANALYSIS (Olympus Soft Imaging Solutions, Germany):
thickness of musculature, height of villi, height of enterocytes, and density of goblet cells in the intestinal mucosa (43).
2.9 Extraction of DNA and analysis of gut microbiota
The DNeasy PowerSoil Pro Kit (ref. 47,016, QIAGEN, Germany) was used for extracting the DNA of up to 250 mg of the scraped product of the AI and the PI of threefish from each tank (12 individuals per diet). The concentration of DNA ranged up to 500 ng/μL, and A260/A280absorbance ratios were higher than 1.85.
The region V3–V4 of the 16S rRNA gene was amplified (primers 341F/805R) and sequenced (llumina-MiSeq platform; 2
× 300 bp paired-end) according to Ruiz et al. (44), and data analysis was carried out with a workflow based on the R package dada2 (v1.16;45). In brief, all reads with a Phred quality score <28 or with an expected error >2 were excluded from the analysis. After merging of paired-ended reads, the sequences with an overlap length <12 nucleotides, more than 0 mismatches, or identified as chimeras, were also removed. Finally, for bacterial taxonomy classification of amplicon sequence variants (ASVs), the SILVA database (v138.1) was used as a reference library. Those ASVs with a bootstrapping confidence <80% were classified as unassigned (46).
According to rarefaction curves (Supplementary Figure S1), the number of reads per sample were rarefied to the minimum sample depth (49,337 reads) using the R package vegan (v2.6-4) and normalized by total sum scaling (47). Raw sequencing data are available in the Sequence Read Archive (SRA) of NCBI under the Bioproject accession numbers PRJNA915342 and PRJNA971862.
2.10 Gene expression pro fi le of the liver and anterior intestine
The TRI Reagent (Sigma-Aldrich, USA) and QIAGEN RNeasy® Mini Kit (ref. 74,106, QIAGEN, Germany) were, respectively, used for extracting RNA from the liver and AI.
Concentrations of RNA ranged between 20 and 100 ng/μL, with A260/A280absorbance ratios of 1.9–2.1 (Nanodrop-2000®, Thermo Fisher Scientific, USA). Integrity was verified through agarose gel electrophoresis (48). For cDNA synthesis, the High-Capacity cDNA Archive Kit (Applied Biosystems, USA) was used following the manufacturer’s instructions with an initial input of 500 ng of RNA.
Real-time quantitative PCR was carried out with a CFX96 Connect™ Real-Time PCR Detection System (Bio-Rad, USA),
using 96-well PCR array layouts designed for simultaneously profiling a panel of 44 genes for liver (Table 2) and intestine (Table 3) as described by Ruiz et al. (44). To improve data reproducibility, all the pipetting operations were performed using an EpMotion 5070 Liquid Handling Robot (Eppendorf, Germany).
Expression values were calculated with the delta–delta Ct method (49), taking beta-actin as a housekeeping gene, after testing its expression stability (GeNorm software; M score = 0.21). To compare the expression of multiple genes, all values in the liver
and AI were referenced to the expression levels ofgrp-170andhes1- boffish fed the control diet, respectively.
2.11 Statistical analyses
After confirmation of normal distribution and homoscedasticity of data by Shapiro–Wilk test and Levene’s test, a one-way ANOVA followed by Tukey’s range test for multiple comparison among
TABLE 2 PCR-array layout for gene expression profile in the liver of gilthead seabream fed experimental diets.
Function Gene Symbol GenBank
Fatty acids, cholesterol and phospholipid metabolism Fatty acid synthase fasn JQ277708
Elongation of very long chain fatty acids 1 elovl1 JX975700
Elongation of very long chain fatty acids 4 elovl4 JX975701
Elongation of very long chain fatty acids 5 elovl5 AY660879
Elongation of very long chain fatty acids 6 elovl6 JX975702
Fatty acid desaturase 2 fads2 AY055749
Stearoyl-CoA desaturase 1a scd1a JQ277703
Stearoyl-CoA desaturase 1b scd1b JQ277704
Cholesterol 7-alpha-monooxygenase cyp7a1 KX122017
Phospholipid transfer protein pltp XM_030418561
Lipases Adipose triglyceride lipase atgl JX975711
Hepatic lipase hl EU254479
Lipoprotein lipase lpl AY495672
85kDa calcium-independent phospholipase A2 pla2g6 JX975708
Transcription factors & nuclear receptors Hepatocyte nuclear factor 4 alpha hnf4a FJ360721
Sterol regulatory element-binding proteins 1 srebp1 JQ277709
Sterol regulatory element-binding protein 2 srebp2 XM_030408996
Farnesoid X receptor fxr XM_030426192
Liver X receptora lxra FJ502320
Peroxisome proliferator-activated receptora ppara AY590299
Peroxisome proliferator-activated receptorb pparb AY590301
Peroxisome proliferator-activated receptorg pparg AY590304
Oxidative metabolism & energy sensing Carnitine palmitoyltransferase 1A cpt1a JQ308822
Hydroxyacyl-CoA dehydrogenase hadh JQ308829
Fatty acid translocase/CD36 fat/cd36 XM_030440140
Fatty acid binding protein, heart h-fabp JQ308834
Citrate synthase cs JX975229
NADH-ubiquinone oxidoreductase chain 2 nd2 KC217558
NADH-ubiquinone oxidoreductase chain 5 nd5 KC217559
Cytochrome c oxidase subunit I coxi KC217652
(Continued)
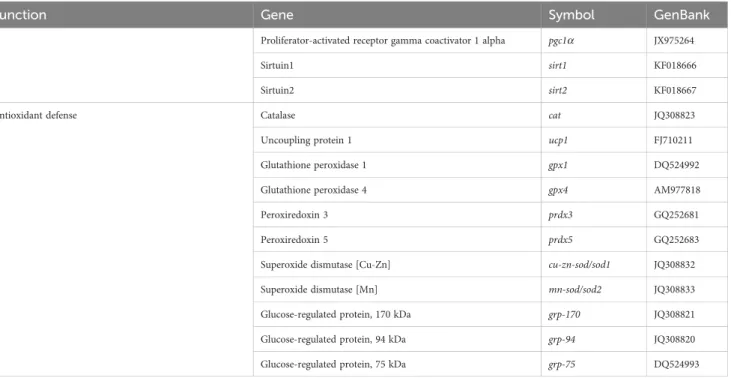
TABLE 2 Continued
Function Gene Symbol GenBank
Proliferator-activated receptor gamma coactivator 1 alpha pgc1a JX975264
Sirtuin1 sirt1 KF018666
Sirtuin2 sirt2 KF018667
Antioxidant defense Catalase cat JQ308823
Uncoupling protein 1 ucp1 FJ710211
Glutathione peroxidase 1 gpx1 DQ524992
Glutathione peroxidase 4 gpx4 AM977818
Peroxiredoxin 3 prdx3 GQ252681
Peroxiredoxin 5 prdx5 GQ252683
Superoxide dismutase [Cu-Zn] cu-zn-sod/sod1 JQ308832
Superoxide dismutase [Mn] mn-sod/sod2 JQ308833
Glucose-regulated protein, 170 kDa grp-170 JQ308821
Glucose-regulated protein, 94 kDa grp-94 JQ308820
Glucose-regulated protein, 75 kDa grp-75 DQ524993
Specific primer sequences for marker genes of liver are listed inSupplementary Table S2.
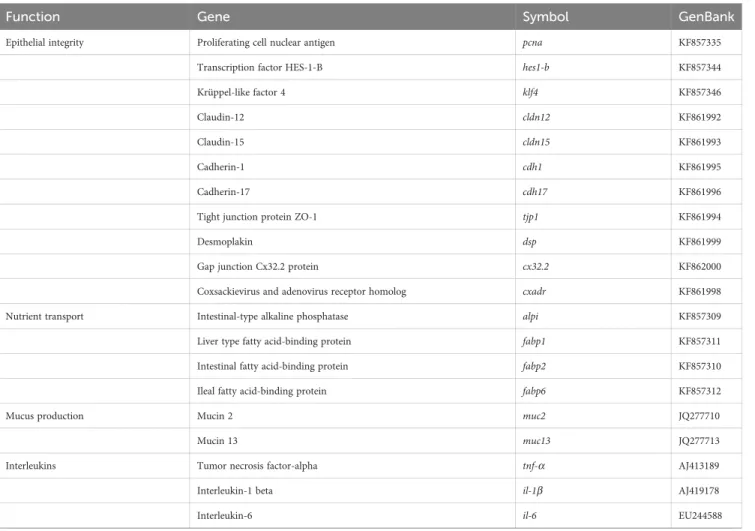
TABLE 3 PCR-array layout for gene expression profile in the intestine of gilthead seabream fed experimental diets.
Function Gene Symbol GenBank
Epithelial integrity Proliferating cell nuclear antigen pcna KF857335
Transcription factor HES-1-B hes1-b KF857344
Krüppel-like factor 4 klf4 KF857346
Claudin-12 cldn12 KF861992
Claudin-15 cldn15 KF861993
Cadherin-1 cdh1 KF861995
Cadherin-17 cdh17 KF861996
Tight junction protein ZO-1 tjp1 KF861994
Desmoplakin dsp KF861999
Gap junction Cx32.2 protein cx32.2 KF862000
Coxsackievirus and adenovirus receptor homolog cxadr KF861998
Nutrient transport Intestinal-type alkaline phosphatase alpi KF857309
Liver type fatty acid-binding protein fabp1 KF857311
Intestinal fatty acid-binding protein fabp2 KF857310
Ileal fatty acid-binding protein fabp6 KF857312
Mucus production Mucin 2 muc2 JQ277710
Mucin 13 muc13 JQ277713
Interleukins Tumor necrosis factor-alpha tnf-a AJ413189
Interleukin-1 beta il-1b AJ419178
Interleukin-6 il-6 EU244588
(Continued)
groups (p≤0.05) was performed. When data was non-parametric, a Kruskal–Wallis one-way analysis of variance by ranks and Dunn’s post-hoctest were performed. Correlations between variables were tested by the Pearson product–moment correlation test (p≤0.05).
For gene expression analyses, a Student’s t-test was performed.
A two-way ANOVA followed by a Holm–Sidak test was used for evaluating interaction between the diet and feeding time (2 h postprandial or 48 h fasted). The p-value was set to 0.05 to determine significant differences among dietary groups, whereasp
≤0.1 was considered as a tendency for gene expression data. In the case of gene expression values withp≤0.1, a partial least squares- discriminant analysis (PLS-DA) was constructed with the software EZinfo (v3.0, Umetrics, Sweden) to achieve the maximum separation among experimental groups. Cluster separation was assessed by calculating Hotelling’s T2 statistic. Points with a T2 above 95% confidence limit were considered as outliers and discarded. By means of the R package ropls (v1.22.0), each PLS-
DA model was validated by a permutations test, making sure that there was no over-fitting (Supplementary Figures S2,S3).
Regarding gut microbial communities, significant differences among dietary groups in alpha diversity metrics (indices of Chao1, ACE, Shannon, Simpson, and Faith’s phylogenetic diversity;50,51) were determined by Wilcoxon test (p ≤0.05). As a beta diversity index, the weighted UniFrac distance was used to estimate similarities among samples based on the phylogenetic relationships of their ASVs (52). A permutational multivariate analyses of variance (PERMANOVA) was performed to check significant differences in beta diversity (p ≤0.05;53). Differential abundances among groups in phyla and genera with a relative abundance ≥1% were calculated with the method Metastats, adjusting thep-value by False Discovery Rate (FDR) (54). All the described statistics for gut microbiota data were executed with the R package microeco (55), which was used together with ggplot2 for generation offigures.
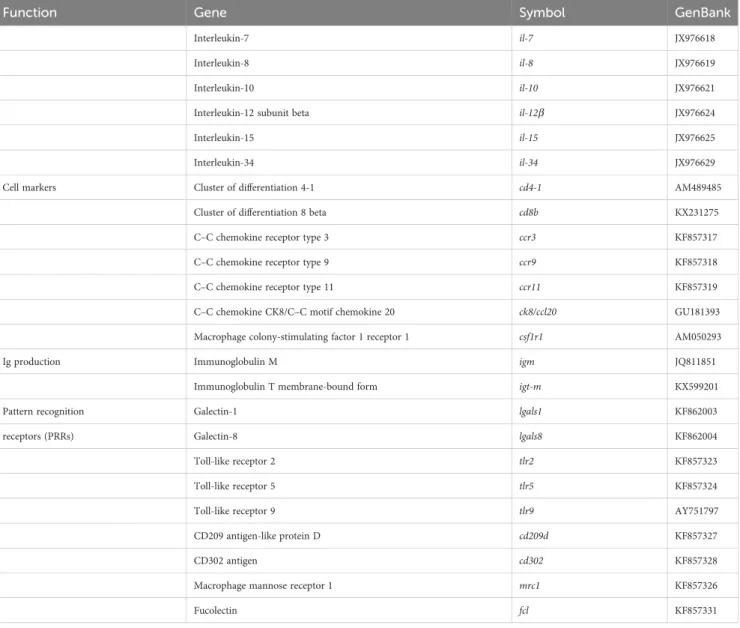
TABLE 3 Continued
Function Gene Symbol GenBank
Interleukin-7 il-7 JX976618
Interleukin-8 il-8 JX976619
Interleukin-10 il-10 JX976621
Interleukin-12 subunit beta il-12b JX976624
Interleukin-15 il-15 JX976625
Interleukin-34 il-34 JX976629
Cell markers Cluster of differentiation 4-1 cd4-1 AM489485
Cluster of differentiation 8 beta cd8b KX231275
C–C chemokine receptor type 3 ccr3 KF857317
C–C chemokine receptor type 9 ccr9 KF857318
C–C chemokine receptor type 11 ccr11 KF857319
C–C chemokine CK8/C–C motif chemokine 20 ck8/ccl20 GU181393
Macrophage colony-stimulating factor 1 receptor 1 csf1r1 AM050293
Ig production Immunoglobulin M igm JQ811851
Immunoglobulin T membrane-bound form igt-m KX599201
Pattern recognition Galectin-1 lgals1 KF862003
receptors (PRRs) Galectin-8 lgals8 KF862004
Toll-like receptor 2 tlr2 KF857323
Toll-like receptor 5 tlr5 KF857324
Toll-like receptor 9 tlr9 AY751797
CD209 antigen-like protein D cd209d KF857327
CD302 antigen cd302 KF857328
Macrophage mannose receptor 1 mrc1 KF857326
Fucolectin fcl KF857331
Specific primer sequences for marker genes of intestine are listed inSupplementary Table S3.
3 Results
3.1 Fish performance
The supplementation of pungent spices into the basal diet had a positive effect infish somatic growth in terms of BWfand SGR at both dietary inclusion levels when compared to the control diet (Table 4; p < 0.05). Furthermore, the administration of the SPICY0.1%diet reduced perivisceral fat levels (p< 0.05), whilefish fed the SPICY0.15%diet showed PVFI values that were intermediate between the abovementioned and the control diet (p> 0.05). No significant differences were found in the values of SLf, Fulton’s condition factor, and HSI among dietary groups (p > 0.05).
Regarding feed performance, whereas there were no differences in feed intake (p> 0.05), FCR values followed a similar pattern to that described for the PVFI; in particular, the lowest FCR values were found infish fed the SPICY0.1%diet (p< 0.05). On the other hand, diet supplementation with pungent spices did not significantly affect lipid and protein ADCs (p> 0.05).
3.2 Proximate and fatty acid composition
There were no differences in the proximate composition of the liver norfillets among dietary groups (Supplementary Table S4;p>
0.05). Considering the fatty acid profile of the liver, only DHA was found at different levels among dietary groups. In particular, the highest levels of DHA were found infish fed the SPICY0.15%diet (p<
0.05), whilefish fed the SPICY0.1%diet displayed intermediate values between both dietary treatments (Table 5; p > 0.05). Indeed, the content of DHA in the liver was positively correlated to the dietary inclusion levels of the combination of pungent spices (Pearson correlation coefficientr= 0.72,p= 0.008). Likewise, the total levels of n-3 polyunsaturated fatty acids (n-3 PUFAs) in the liver followed a similar trend, increasing with higher concentrations of pungent spices in the diets (r= 0.73,p= 0.007). The fatty acid profile offillet was also very conserved, although the DHA/EPA ratio significantly increased infish fed the SPICY0.1%diet (Table 6;p< 0.05).
3.3 Hepatic metabolism, oxidative stress biomarkers, and activity of pancreatic digestive enzymes
Dietary supplementation with the combination of pungent spices did not alter the specific activity of the measured metabolic or oxidative stress enzymes, nor were there changes in LPO and TAC in the liver (Supplementary Table S5;p > 0.05). Regarding pancreatic digestive enzymes, there were no significant differences in the specific activities of total alkaline proteases, bile-salt-activated
TABLE 4 Growth and feed performance indicators, somatic condition indices, and macronutrient apparent digestibility coefficients of gilthead seabream fed the control and two basal diets supplemented with a mixture of pungent spices (capsicum, black pepper, ginger, and cinnamaldehyde) at a dietary inclusion level of 0.1 (SPICY0.1%) and 0.15% (SPICY0.15%).
Control SPICY0.1% SPICY0.15%
Growth performance
BWi(g) 44.05 ± 0.04 44.08 ± 0.10 44.06 ± 0.10
SLi(cm) 12.04 ± 0.12 12.22 ± 0.16 12.08 ± 0.06
BWf(g) 215.80 ± 1.06a 221.96 ± 3.46b 223.02 ± 3.50b
SLf(cm) 19.32 ± 0.21 19.66 ± 0.30 19.51 ± 0.09
SGR (% day−1) 1.81 ± 0.01a 1.84 ± 0.02b 1.84 ± 0.02b
Somatic indices
K 3.00 ± 0.11 2.93 ± 0.12 3.01 ± 0.07
HSI (%) 1.84 ± 0.11 1.92 ± 0.09 1.95 ± 0.14
PVFI (%) 3.01 ± 0.28b 2.32 ± 0.37a 2.68 ± 0.28ab
Feed performance
FI (gfish−1) 195.89 ± 8.70 192.29 ± 9.94 198.50 ± 6.23
FCR 1.21 ± 0.05b 1.13 ± 0.02a 1.20 ± 0.04ab
Apparent digestibility coefficients (ADCs)
Lipid ADC (%) 81.60 ± 0.96 81.14 ± 1.33 79.73 ± 0.89
Protein ADC (%) 79.41 ± 3.60 81.09 ± 2.82 76.08 ± 2.18
Values are represented as mean ± SD (n = 4 tanks per dietary group) and differences among groups (p≤0.05) are indicated by the different superscript letters. BWi, initial body weight; SLi, initial standard length; BWf,final body weight; SLf,final standard length; SGR, specific growth rate; K, Fulton’s condition factor; HSI, hepatosomatic index; PVFI, perivisceral fat index; FI, feed intake;
FCR, feed conversion ratio.
TABLE 5 Fatty acid profile (mg/g lipid) of the liver in gilthead seabream fed the control and two basal diets supplemented with a mixture of pungent spices (capsicum, black pepper, ginger, and cinnamaldehyde) at a dietary inclusion level of 0.1 (SPICY0.1%) and 0.15% (SPICY0.15%).
Control SPICY0.1% SPICY0.15%
Myristic acid (C14:0) 8.61 ± 2.87 6.96 ± 2.62 8.66 ± 1.59
Pentadecylic acid (C15:0) 1.47 ± 0.29 1.35 ± 0.31 1.27 ± 0.25
Palmitic acid (C16:0) 125.93 ± 2.91 117.43 ± 9.82 132.13 ± 9.26
Stearic acid (C18:0) 46.63 ± 2.66 50.24 ± 6.98 52.10 ± 5.64
Saturated fatty acids (SFAs) 176.52 ± 19.53 179.57 ± 13.97 197.27 ± 12.73
Palmitoleic acid (C16:1 n-7) 26.20 ± 4.93 24.56 ± 2.82 28.42 ± 1.74
Vaccenic acid (C18:1 n-7) 34.41 ± 3.06 33.67 ± 8.12 35.80 ± 5.39
Oleic acid (C18:1 n-9) 238.38 ± 8.25 246.14 ± 35.72 261.72 ± 30.28
Eicosenoic acid (C20:1 n-9) 4.08 ± 0.39 5.06 ± 1.96 4.43 ± 0.77
Nervionic acid (C24:1 n-9) 1.76 ± 0.15 1.99 ± 0.37 1.93 ± 0.33
Monounsaturated fatty acids (MUFAs) 307.14 ± 13.72 311.83 ± 44.12 332.29 ± 36.43
Linoleic acid (C18:2 n-6) 126.14 ± 6.76 124.04 ± 10.12 138.17 ± 9.49
Gamma-linolenic acid (C18:3 n-6) 6.94 ± 1.24 7.84 ± 2.32 7.10 ± 0.77
Arachidonic acid (C20:4 n-6; ARA) 4.47 ± 0.73 5.02 ± 0.73 5.47 ± 0.37
n-6 polyunsaturated fatty acids (n-6 PUFAs) 137.90 ± 5.82 136.90 ± 12.21 150.74 ± 9.92
Alpha-linolenic acid (C18:3 n-3) 8.48 ± 0.35 8.06 ± 0.53 8.99 ± 0.38
Stearidonic acid (C18:4 n-3) 1.52 ± 0.04 1.43 ± 0.26 1.73 ± 0.22
Eicosatetraenoic acid (C20:4 n-3) 1.67 ± 0.22 1.75 ± 0.13 1.81 ± 0.16
Eicosapentaenoic acid (C20:5 n-3; EPA) 15.17 ± 0.39 15.48 ± 1.39 16.96 ± 1.80
Docosapentaenoic acid (C22:5 n-3) 7.96 ± 1.10 9.02 ± 1.93 8.92 ± 0.49
Docosahexaenoic acid (C22:6 n-3; DHA) 15.85 ± 2.21a 17.77 ± 0.63ab 20.80 ± 2.58b
n-3 polyunsaturated fatty acids (n-3 PUFAs) 49.15 ± 4.88a 53.65 ± 2.72ab 59.21 ± 4.61b
Total PUFAs 189.48 ± 5.85 190.55 ± 14.73 209.95 ± 14.45
DHA/EPA 1.11 ± 0.09 1.15 ± 0.07 1.23 ± 0.09
EPA + DHA 32.05 ± 0.81 33.24 ± 1.95 37.76 ± 4.15
n6/n3 2.67 ± 0.12 2.55 ± 0.12 2.55 ± 0.06
Non-represented fatty acids were not detected in the analysis. Values are represented as mean ± SD (n = 4 tanks per dietary group) and differences among groups (p≤0.05) are indicated by the different superscript letters.
TABLE 6 Fatty acid profile (mg/g lipid) of thefillet in gilthead seabream fed the control and two basal diets supplemented with a mixture of pungent spices (capsicum, black pepper, ginger, and cinnamaldehyde) at a dietary inclusion level of 0.1 (SPICY0.1%) and 0.15% (SPICY0.15%).
Control SPICY0.1% SPICY0.15%
Myristic acid (C14:0) 8.60 ± 1.35 8.34 ± 1.59 8.72 ± 1.88
Pentadecylic acid (C15:0) 1.21 ± 0.10 1.14 ± 0.12 1.14 ± 0.11
Palmitic acid (C16:0) 129.29 ± 3.49 125.17 ± 5.42 128.34 ± 9.20
Stearic acid (C18:0) 32.41 ± 1.39 32.20 ± 1.07 32.70 ± 0.64
Lignoceric acid (C24:0) 1.44 ± 0.16 1.49 ± 0.05 1.48 ± 0.28
Saturated fatty acids (SFAs) 173.63 ± 2.79 169.19 ± 7.07 172.77 ± 11.93
Palmitoleic acid (C16:1 n-7) 33.50 ± 2.27 31.87 ± 2.63 34.05 ± 5.60
(Continued)
lipase, anda-amylase among diets in the stomach and pyloric ceca samples (Table 7;p> 0.05). On the other hand, the activity of bile- salt-activated lipase increased in the AI in gilthead seabream fed both supplemented diet with respect to the control group (p< 0.05), whereas the activities of total alkaline proteases and a-amylase followed the same numerical trend, but differences were not significant due to large interindividual variability (p> 0.05).
3.4 Composition of bile
Two primary BAs in their tauro-conjugated form were detected in the bile of gilthead seabream: the taurocholic acid (T-CA) and the taurochenodeoxycholic acid (T-CDCA), both at similar levels among dietary groups (Table 8; p > 0.05). While the concentration of BAs did not change among dietary treatments in
TABLE 6 Continued
Control SPICY0.1% SPICY0.15%
Oleic acid (C18:1 n-9) 247.55 ± 10.03 239.58 ± 12.32 249.47 ± 23.17
Eicosenoic acid (C20:1 n-9) 3.39 ± 0.14 3.51 ± 0.35 3.26 ± 0.39
Nervionic acid (C24:1 n-9) 1.43 ± 0.22 1.54 ± 0.11 1.58 ± 0.14
Monounsaturated fatty acids (MUFAs) 285.59 ± 12.55 276.50 ± 13.65 287.93 ± 28.38
Linoleic acid (C18:2 n-6) 143.89 ± 7.49 141.64 ± 5.88 143.51 ± 11.97
Gamma-linolenic acid (C18:3 n-6) 3.26 ± 0.37 3.44 ± 0.63 3.34 ± 0.12
Arachidonic acid (C20:4 n-6; ARA) 5.03 ± 0.43 5.17 ± 0.34 5.06 ± 0.96
n-6 polyunsaturated fatty acids (n-6 PUFAs) 152.56 ± 8.17 150.26 ± 6.44 151.91 ± 11.40
Alpha-linolenic acid (C18:3 n-3) 9.82 ± 0.78 9.41 ± 0.75 9.92 ± 0.89
Stearidonic acid (C18:4 n-3) 1.56 ± 0.15 1.60 ± 0.25 1.64 ± 0.24
Eicosatetraenoic acid (C20:4 n-3) 1.63 ± 0.23 1.65 ± 0.15 1.58 ± 0.17
Eicosapentaenoic acid (C20:5 n-3; EPA) 23.87 ± 2.38 22.58 ± 0.48 23.71 ± 3.64
Docosapentaenoic acid (C22:5 n-3) 9.92 ± 1.22 9.60 ± 0.13 9.32 ± 0.55
Docosahexaenoic acid (C22:6 n-3; DHA) 29.37 ± 2.75 30.83 ± 1.58 30.37 ± 4.95
n-3 polyunsaturated fatty acids (n-3 PUFAs) 77.88 ± 9.41 75.68 ± 2.29 76.39 ± 8.28
Total PUFAs 230.43 ± 15.81 225.94 ± 8.28 228.30 ± 12.78
DHA/EPA 1.23 ± 0.03a 1.37 ± 0.08b 1.28 ± 0.06ab
EPA + DHA 53.24 ± 5.08 53.41 ± 1.62 54.07 ± 8.50
n6/n3 1.97 ± 0.18 1.99 ± 0.06 2.01 ± 0.29
Non-represented fatty acids were not detected in the analysis. Values are represented as mean ± SD (n = 4 tanks per dietary group), and differences among groups (p≤0.05) are indicated by the different superscript letters.
TABLE 7 Specific activity (mU/mg protein) of total alkaline proteases,a-amylase, and bile-salt-activated lipase in gilthead seabream fed the control and two basal diets supplemented with a mixture of pungent spices (capsicum, black pepper, ginger, and cinnamaldehyde) at a dietary inclusion level of 0.1 (SPICY0.1%) and 0.15% (SPICY0.15%).
Control SPICY0.1% SPICY0.15%
Stomach and pyloric caeca
Total alkaline proteases 78.52 ± 8.01 90.20 ± 15.61 89.73 ± 12.03
a-amylase 398.32 ± 51.08 410.19 ± 25.24 418.92 ± 30.81
Bile salt-activated lipase 21.49 ± 6.26 23.48 ± 1.54 22.90 ± 4.83
Anterior intestine
Total alkaline proteases 133.64 ± 13.45 145.24 ± 11.82 160.35 ± 25.63
a-amylase 402.98 ± 130.44 492.51 ± 80.53 475.20 ± 60.72
Bile salt-activated lipase 50.00 ± 9.57a 65.19 ± 4.84b 63.94 ± 2.81b
Values are represented as mean ± SD (n = 4 tanks per dietary group) and differences among groups (p≤0.05) are indicated by the different superscript letters.
the gallbladder, the numerical values in the AI of each group notably varied even though this trend was not statistically significant due to large interindividual variability (p > 0.05). In particular, the mean levels of T-CA and T-CDCA increased 50%
and 20%, respectively, infish fed the SPICY0.15%diet, with respect to the control diet. That resulted in an increase of more than 35% of the mean levels of total BAs, although statistically there were no significant differences due to the high deviation among specimens within each dietary group.
3.5 Histomorphology of the liver and anterior intestine
Under the present experimental conditions, the hepatic parenchyma showed a typical histological organization in all dietary groups. In particular, hepatocytes were polyhedral in shape, with varying degrees of vacuolization in their cytoplasm, and arranged in anastomosed plates separated by sinusoidal capillaries leading to central veins. No signs of inflammation nor infiltration of lymphocytes were observed in any of the diets. The SPICY0.1%diet had a clear effect on the accumulation of fat deposits within hepatocytes, halving the number of individuals with high lipid accumulation in liver (score classification of 4) and increasing the number of those with low and moderate lipid accumulation (classifications 2 and 3;Figures 1A,B).
The histological organization of AI was also typical, without signs of enteritis. In brief, the mucosa was lined with the columnar epithelial layer, supported by connective tissue of the lamina propria-submucosa and surrounded by the tunica muscularis. The epithelium was mainly composed of enterocytes with acidic microvilli, a basal basophilic nucleus, eosinophilic cytoplasm, and different amount and size of clear supranuclear vacuoles depending on the dietary treatment. In particular, both diets supplemented with the mixture of pungent spices were able to reduce vacuolization with respect to the control group (Figures 1C, D). No differences in villus or enterocyte height, density of goblet cells,
and thickness of the tunica muscularis were found among treatments (Supplementary Table S6;p> 0.05).
3.6 Microbial diversity, structure, and composition
Based on the rest of the results, only the control and SPICY0.1%
diets were selected for the microbiota and gene expression analyses.
After rarefaction, a total of 2,269,502 reads clustering into 19,379 ASVs were obtained. The alpha diversity indices of ACE, Shannon, and Faith’s phylogenetic diversity (PD) were not different among dietary treatments (control vs. SPICY0.1%) regardless of the region of the intestine considered (Figures 2A,B,D;p> 0.05), while in the PI, the values from Simpson’s Diversity Index increased in fish fed the SPICY0.1% diet (0.99 ± 0.00; mean ± SEM) in comparison to the control group (0.96 ± 0.02) (Figure 2C; p <
0.05;Supplementary Table S7). Results of beta diversity based on the weighted UniFrac analysis did not show separation among specimens regarding diets in the AI (Figure 2E; PERMANOVA,F= 0.666, R2 = 0.029, p = 0.827) nor in the PI (Figure 2F;
PERMANOVA,F= 0.950,R2 =0.045,p= 0.408).
In terms of microbial composition, the most abundant phyla were Firmicutes, Proteobacteria, and Bacteroidota, accounting for 81% of the total microbial population (Figure 3A). There were no significant differences in the relative abundance of any of these three phyla among dietary treatments (Supplementary Table S8;p> 0.05).
On the other hand, there was a significant increase in the phylum Chloroflexi in the PI infish fed the SPICY0.1%diet with respect to the control group (p< 0.05). The Firmicutes/Bacteroidetes (F/B) ratio was maintained at 1.67–1.70 in the AI and at 1.92–2.13 in the PI (p > 0.05). Similarly, the relative abundances of the most dominant genera (≥1.0%) did not change among diets in the AI (Figure 3B;Supplementary Table S9; p> 0.05). Nevertheless, the relative abundances of the generaCampylobacter,Corynebacterium, andPeptoniphilusin the PI decreased when adding the combination of pungent spices to the diet (p< 0.05).
TABLE 8 Bile acid profile in the gallbladder and the anterior intestine in gilthead seabream fed the control and two basal diets supplemented with a mixture of pungent spices (capsicum, black pepper, ginger, and cinnamaldehyde) at a dietary inclusion level of 0.1 (SPICY0.1%) and 0.15% (SPICY0.15%).
Control SPICY0.1% SPICY0.15%
Gallbladder (mg/mL)
T-CA 108.23 ± 9.59 108.89 ± 1.11 100.23 ± 8.14
T-CDCA 47.67 ± 3.69 46.76 ± 5.14 46.76 ± 9.04
Total BAs 155.90 ± 9.58 155.65 ± 5.62 146.98 ± 15.27
Anterior intestine (µg/mg)
T-CA 30.00 ± 15.83 44.44 ± 13.05 34.32 ± 12.06
T-CDCA 19.94 ± 13.72 23.90 ± 6.18 17.26 ± 4.26
Total BAs 49.94 ± 29.41 68.34 ± 19.07 51.58 ± 16.28
Non-represented bile acids were not detected in the analysis. Values are represented as mean ± SD (n = 4 tanks per dietary group). T-CA, taurocholic acid; T-CDCA, taurochenodeoxycholic acid;
total BAs, total bile acids.
3.7 Gene expression pro fi le of the liver and anterior intestine
The expression patterns of 33 out of 44 genes analyzed in the liver were affected by the feeding time (2 h postprandial vs. 48 h fasted) (Supplementary Table S10;p< 0.1). Analysis of differences among diets for each feeding time highlighted an upregulation of fasn,elovl6, andcyp7a1(p< 0.05) and to a lower degree ofscd1b(p<
0.1), whilelpl(p< 0.05) andpparb(p< 0.1) were downregulated in 2-h postprandialfish fed the SPICY0.1%diet with respect to those fed the control diet. In 48-h fasted animals, experimental diets only
affected srebp1 and prdx5 expression patterns, which were upregulated in fish fed the SPICY0.1% diet (p < 0.05). The PLS- DA model of liver expression was based on three components, with an explained variance [R2Y(cum)] of 66% and a predicted variance [Q2(cum)] of 55% (Figure 4A). Separation among individuals regarding the different assayed feeding times (2 h postprandial vs.
48 h fasted) was not clear, nor was there a differential distribution of individuals based on diet (Figure 4B).
In the AI, feeding time caused major changes on the expression of 29 out of the 44 analyzed genes (Supplementary Table S11;p< 0.1).
Regarding diet differences at each feeding time, the SPICY0.1%diet
A B
D C
FIGURE 1
(A)Semi-quantitative scoring used for evaluating the levels of fat accumulation in the liver of gilthead seabream [adapted from Ruiz et al. (31)].(B) Results (%) of hepatic scoring from gilthead seabream (n = 12fish per dietary group) fed the control and two basal diets supplemented with a mixture of pungent spices (capsicum, black pepper, ginger, and cinnamaldehyde) at a dietary inclusion level of 0.1 (SPICY0.1%) and 0.15% (SPICY0.15%).
(C)Semi-quantitative scoring used for evaluating the levels of fat accumulation in the anterior intestine of gilthead seabream [adapted from Ruiz et al. (31)].(D)Results (%) of intestinal scoring from gilthead seabream (n = 12fish per dietary group) fed the experimental diets.