Searches for Higgs bosons decaying to lepton pairs with the CMS detector!
Jan Steggemann (CERN)!
on behalf of the CMS collaboration!
4 July 2014!
Motivation!
2!
!
• Does the Higgs boson decay to leptons/fermions? (H→ττ)!
• Measurement of fermionic and bosonic couplings
(H→ττ)!
• Enhanced decay rate to 2 nd generation leptons? (H→µµ)!
• Lepton flavour violation?
(H→µτ) – new result!
Jan Steggemann!
V
0 0.5 1 κ 1.5
f
κ
0 0.5 1 1.5
2
95% C.L.
b
→ b H
τ τ H →
→ ZZ H
→ WW H
γγ H →
CMS Preliminary s = 7 TeV, L ≤ 5.1 fb-1 s = 8 TeV, L ≤ 19.6 fb-1
SM Higgs Fermiophobic Bkg. only
Higgs couplings as of Moriond 2013
Higgs Production and Event Categories!
3!
Gluon fusion (87%)
$0-jet/≥1-jet!
Jan Steggemann!
2 2 Analysis overview
and vector boson fusion (VBF), final states with H ! tt decays contain only two charged leptons, defining theLL0 channels. All sixt-pair final states are studied: LL0 = µth, eth,thth, eµ,µµ, and ee.
q
g g
H
W/Z W/Z
q q
q H q
W /Z
q
¯ q
W/Z H
Figure 1: Leading-order Feynman diagrams for Higgs boson production through gluon-gluon fusion (left), vector boson fusion (middle), and the associated production with a W or a Z boson (right).
Sensitivity to the associated production with a W or a Z boson is achieved by requiring one or two additional electrons or muons compatible with leptonic decays of the W or Z boson. The four most sensitive final states are retained in the `+Lth channels aiming at the associated production with a W boson, `+Lth = µ+µth, e+µth/µ+eth, µ+thth, and e+thth. In the``+LL0 channels that target the associated production with a Z boson decaying to``, the t-pair final statesµth, eth, eµ, and thth are considered, leading to eight channels in total. The ee and µµt-pair final states are excluded because the corresponding events are already used in the search for H!ZZ!4`[11].
To maximize the sensitivity of the analysis in theLL0channels, events are classified in categories according to the number of jets in the final state, excluding the jets corresponding to theLand L0 leptons. The events are further classified according to a number of kinematic quantities that exhibit different distributions for signal and background events (see section 6). In particular, the contribution of the VBF production process is enhanced for events with two or more jets by requiring a large rapidity gap between the two jets with the highest transverse momentum.
For the remaining events with at least one jet, requiring a largepT of the reconstructed Higgs boson candidate increases the sensitivity to Higgs boson production through gluon fusion. A complete listing of all lepton final states and event categories is given in appendix B.
With the exception of the`+Lth, ee, andµµchannels, the signal is extracted from the distribu- tion of the invariant mass of thet-lepton pair,mtt, calculated from theLandL0four-momenta and the missing transverse energy vector. In the`+Lth channels, the signal extraction is in- stead based on the invariant mass,mvis, of the visibleLth decay products because the missing transverse energy does not entirely arise from the neutrinos produced in the decay of the twot leptons. In the ee andµµchannels, a discriminating variable combining a number of kinematic quantities and other observables, includingmtt, is used.
The background composition depends on the channel and, in particular, on the number of electrons and muons in the final state. The Drell–Yan production of a Z boson decaying into a pair oft leptons constitutes the main irreducible background in allLL0 channels. Another source of background with the same leptonic final state is the production of top-quark pairs (tt), which is most important in the eµchannel. Reducible background contributions include QCD multijet production that is particularly relevant in theththchannel and W(! `n) +jets production with a jet misidentified as a th in the `th channels. In the `+Lth and ``+LL0
2 2 Analysis overview
and vector boson fusion (VBF), final states with H ! tt decays contain only two charged leptons, defining the LL0 channels. All sixt-pair final states are studied: LL0 = µth, eth,thth, eµ,µµ, and ee.
q
g g
H
W/Z W/Z
q q
q H q
W /Z
q
¯ q
W/Z H
Figure 1: Leading-order Feynman diagrams for Higgs boson production through gluon-gluon fusion (left), vector boson fusion (middle), and the associated production with a W or a Z boson (right).
Sensitivity to the associated production with a W or a Z boson is achieved by requiring one or two additional electrons or muons compatible with leptonic decays of the W or Z boson. The four most sensitive final states are retained in the `+Lth channels aiming at the associated production with a W boson, `+Lth = µ+µth, e+µth/µ+eth, µ+thth, and e+thth. In the``+LL0 channels that target the associated production with a Z boson decaying to``, the t-pair final statesµth, eth, eµ, andththare considered, leading to eight channels in total. The ee and µµ t-pair final states are excluded because the corresponding events are already used in the search for H !ZZ!4`[11].
To maximize the sensitivity of the analysis in theLL0channels, events are classified in categories according to the number of jets in the final state, excluding the jets corresponding to theLand L0leptons. The events are further classified according to a number of kinematic quantities that exhibit different distributions for signal and background events (see section 6). In particular, the contribution of the VBF production process is enhanced for events with two or more jets by requiring a large rapidity gap between the two jets with the highest transverse momentum.
For the remaining events with at least one jet, requiring a large pT of the reconstructed Higgs boson candidate increases the sensitivity to Higgs boson production through gluon fusion. A complete listing of all lepton final states and event categories is given in appendix B.
With the exception of the`+Lth, ee, andµµchannels, the signal is extracted from the distribu- tion of the invariant mass of thet-lepton pair,mtt, calculated from theLandL0four-momenta and the missing transverse energy vector. In the`+Lthchannels, the signal extraction is in- stead based on the invariant mass, mvis, of the visibleLthdecay products because the missing transverse energy does not entirely arise from the neutrinos produced in the decay of the twot leptons. In the ee andµµchannels, a discriminating variable combining a number of kinematic quantities and other observables, includingmtt, is used.
The background composition depends on the channel and, in particular, on the number of electrons and muons in the final state. The Drell–Yan production of a Z boson decaying into a pair of t leptons constitutes the main irreducible background in all LL0 channels. Another source of background with the same leptonic final state is the production of top-quark pairs (tt), which is most important in the eµchannel. Reducible background contributions include QCD multijet production that is particularly relevant in the thth channel and W(! `n) +jets production with a jet misidentified as a th in the`th channels. In the `+Lth and ``+LL0
2 2 Analysis overview
and vector boson fusion (VBF), final states with H ! tt decays contain only two charged leptons, defining theLL0 channels. All sixt-pair final states are studied: LL0 = µth, eth,thth, eµ,µµ, and ee.
q
g g
H
W/Z W/Z
q q
q H q
W /Z
q
¯ q
W/Z H
Figure 1: Leading-order Feynman diagrams for Higgs boson production through gluon-gluon fusion (left), vector boson fusion (middle), and the associated production with a W or a Z boson (right).
Sensitivity to the associated production with a W or a Z boson is achieved by requiring one or two additional electrons or muons compatible with leptonic decays of the W or Z boson. The four most sensitive final states are retained in the `+Lth channels aiming at the associated production with a W boson, `+Lth = µ+µth, e+µth/µ+eth, µ+thth, and e+thth. In the``+LL0 channels that target the associated production with a Z boson decaying to``, the t-pair final statesµth, eth, eµ, andththare considered, leading to eight channels in total. The ee and µµ t-pair final states are excluded because the corresponding events are already used in the search for H!ZZ!4`[11].
To maximize the sensitivity of the analysis in theLL0channels, events are classified in categories according to the number of jets in the final state, excluding the jets corresponding to theLand L0leptons. The events are further classified according to a number of kinematic quantities that exhibit different distributions for signal and background events (see section 6). In particular, the contribution of the VBF production process is enhanced for events with two or more jets by requiring a large rapidity gap between the two jets with the highest transverse momentum.
For the remaining events with at least one jet, requiring a large pT of the reconstructed Higgs boson candidate increases the sensitivity to Higgs boson production through gluon fusion. A complete listing of all lepton final states and event categories is given in appendix B.
With the exception of the`+Lth, ee, andµµchannels, the signal is extracted from the distribu- tion of the invariant mass of thet-lepton pair,mtt, calculated from theLandL0four-momenta and the missing transverse energy vector. In the `+Lth channels, the signal extraction is in- stead based on the invariant mass,mvis, of the visibleLthdecay products because the missing transverse energy does not entirely arise from the neutrinos produced in the decay of the twot leptons. In the ee andµµchannels, a discriminating variable combining a number of kinematic quantities and other observables, includingmtt, is used.
The background composition depends on the channel and, in particular, on the number of electrons and muons in the final state. The Drell–Yan production of a Z boson decaying into a pair of t leptons constitutes the main irreducible background in all LL0 channels. Another source of background with the same leptonic final state is the production of top-quark pairs (tt), which is most important in the eµchannel. Reducible background contributions include QCD multijet production that is particularly relevant in the thth channel and W(! `n) +jets production with a jet misidentified as a th in the `th channels. In the `+Lth and ``+LL0
VBF (7%)
$2-jet/VBF tag!
(2 jets with rapidity gap, no central jet)!
WH/ZH (6%)
$ VH!
(additional muons/
electrons from Z/W boson decay)!
Higgs decay branching fractions to leptons
• H→ττ: 6.3%; H→µµ = 0.02% (m
H= 125 GeV)!
• H→τµ: < 10% (exp.)!
!
H→ττ
All analyses
[GeV]
τ
mτ
0 50 100 150 200 250
[1/GeV]ττ1/dm
0 0.02 0.04 0.06 0.08 0.1 0.12 0.14 0.16
= 125 GeV mH
τ τ H →
τ τ
→ Z = 8 TeV s
CMS Simulation µτh
[GeV]
mvis
0 50 100 150 200 250
[1/GeV]vis1/dm
0 0.02 0.04 0.06 0.08 0.1 0.12 0.14 0.16 0.18 0.2
= 125 GeV mH
τ τ H →
τ τ
→ Z = 8 TeV s
CMS Simulation µτh
Visible mass
SVFit mass
τ
hτ
h42%
τ
hµ 23%
τ
he 23%
eµ 6%
ee 3%
µµ 3%
Search for H→ ττ: Strategy !
4!
!
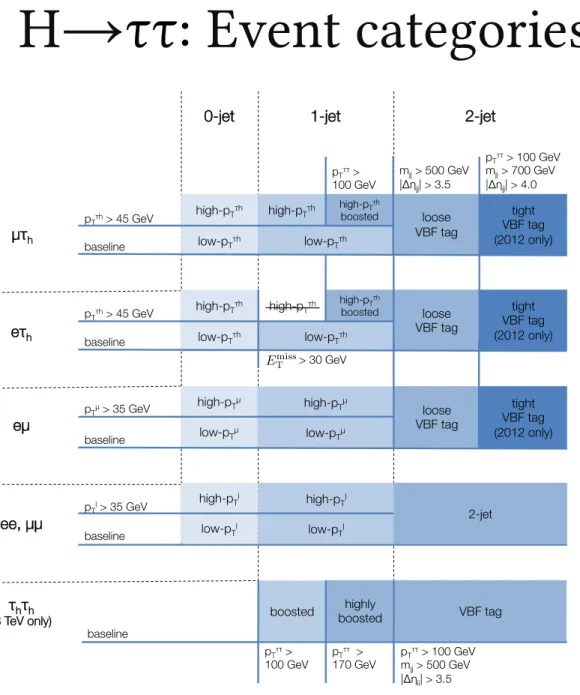
• Include all 6 di-tau decay channels
– 0-jet, 1-jet, and VBF-tag categories (gluon fusion & VBF)!
– In addition, l+ττ (WH) and ll+ττ (ZH) final states!
• Observable: reconstructed di-tau mass with ! resolution of 10-20%!
– Maximum likelihood fit!
using di-tau decay products ! and missing energy!
! !
• Optimisation!
– Further divide events in categories!
based on lepton p T , di-tau p T, and VBF-jet properties !
Jan Steggemann!
JHEP05(2014)104!
Challenges!
5!
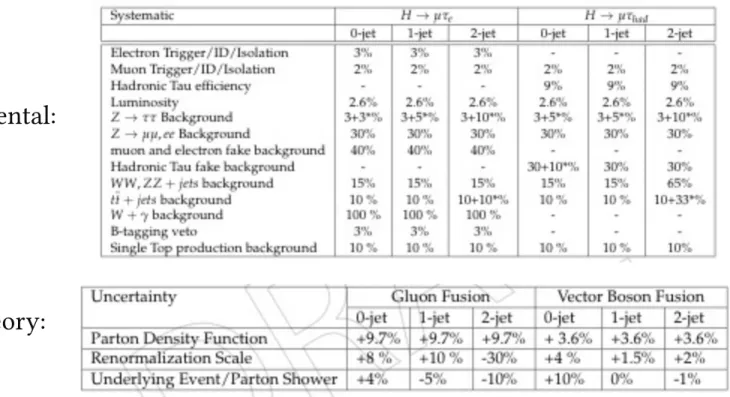
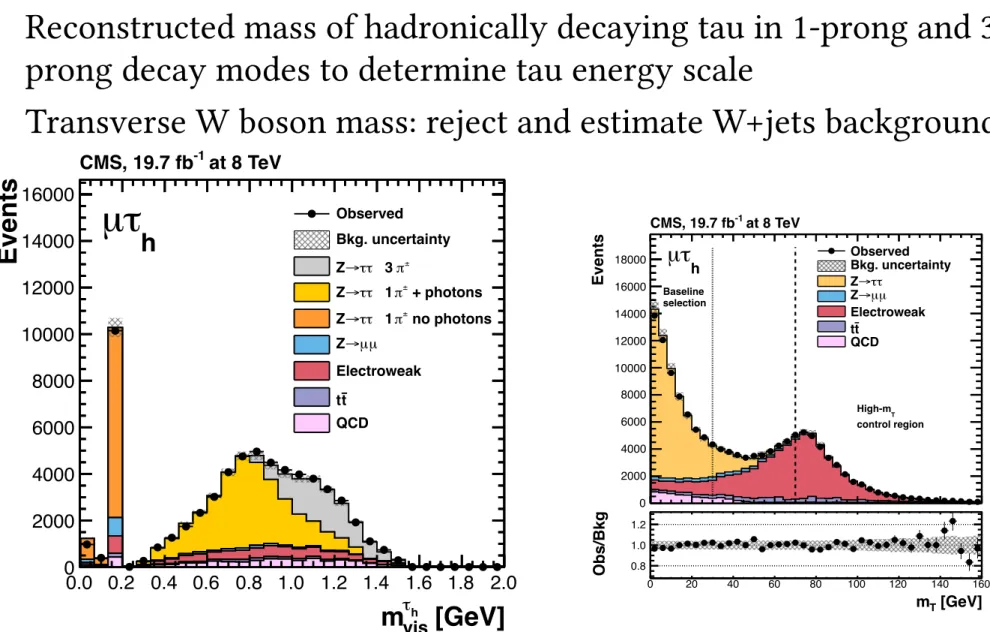
• Excellent control of all backgrounds!
• Experimental: missing energy, forward jets, hadronic tau identification!
Jan Steggemann!
41
[GeV]
τ
mτ
0 100 200 300
[1/GeV]ττdN/dm
0 5 10 15 20 25 30 35
40 at 8 TeV
CMS, 19.7 fb-1
τh
µ
τh
1-jet high pT
boosted
τ τ SM H(125 GeV)→ Observed
τ τ Z→
t t
Electroweak QCD
Bkg. uncertainty
[GeV]
τ
mτ
0 100 200 300
[1/GeV]ττdN/dm
0 20 40 60 80 100 120 140
160 at 8 TeV
CMS, 19.7 fb-1
τh
µ
τh
0-jet high pT τ τ SM H(125 GeV)→ Observed
τ τ Z→
t t
Electroweak QCD
Bkg. uncertainty
[GeV]
τ
mτ
0 100 200 300
[1/GeV]ττdN/dm
0 10 20 30 40 50 60
70 at 8 TeV
CMS, 19.7 fb-1
τh
µ
τh
1-jet high pT τ τ SM H(125 GeV)→ Observed
τ τ Z→
t t
Electroweak QCD
Bkg. uncertainty
[GeV]
τ
mτ
0 100 200 300
[1/GeV]ττdN/dm
0.0 0.1 0.2 0.3 0.4 0.5
at 8 TeV CMS, 19.7 fb-1
τh
µ
Tight VBF tag
τ τ SM H(125 GeV)→ Observed
τ τ Z→
t t
Electroweak QCD
Bkg. uncertainty
[GeV]
τ
mτ
0 100 200 300
[1/GeV]ττdN/dm
0 200 400 600 800 1000 1200 1400
at 8 TeV CMS, 19.7 fb-1
τh
µ
τh
0-jet low pT
τ τ SM H(125 GeV)→ Observed
τ τ Z→
t t
Electroweak QCD
Bkg. uncertainty
[GeV]
τ
mτ
0 100 200 300
[1/GeV]ττdN/dm
0 20 40 60 80 100 120 140 160 180 200 220
240 at 8 TeV
CMS, 19.7 fb-1
τh
µ
τh
1-jet low pT
τ τ SM H(125 GeV)→ Observed
τ τ Z→
t t
Electroweak QCD
Bkg. uncertainty
[GeV]
τ
mτ
0 100 200 300
[1/GeV]ττdN/dm
0.0 0.2 0.4 0.6 0.8 1.0 1.2 1.4 1.6 1.8
2.0 at 8 TeV
CMS, 19.7 fb-1
τh
µ
Loose VBF tag
τ τ SM H(125 GeV)→ Observed
τ τ Z→
t t
Electroweak QCD
Bkg. uncertainty
Figure 20: Observed and predicted m tt distributions in the µt h channel, for all categories used in the 8 TeV data analysis. The normalization of the predicted background distributions corre- sponds to the result of the global fit. The signal distribution, on the other hand, is normalized to the SM prediction. The signal and background histograms are stacked.
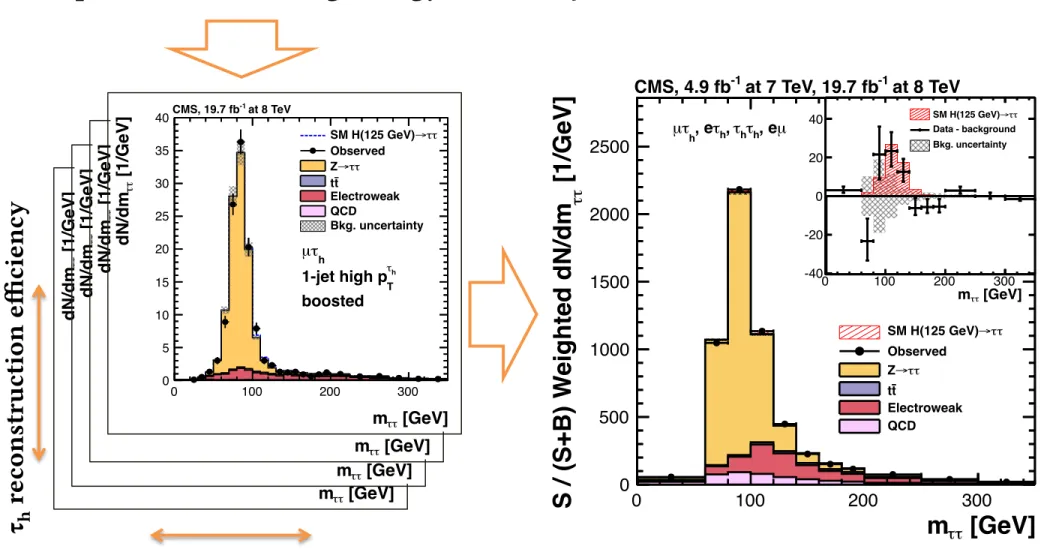
τ
hr ec on st ru ct io n e ffi ci en cy
τ
henergy scale
[GeV]
τ
m
τ0 100 200 300
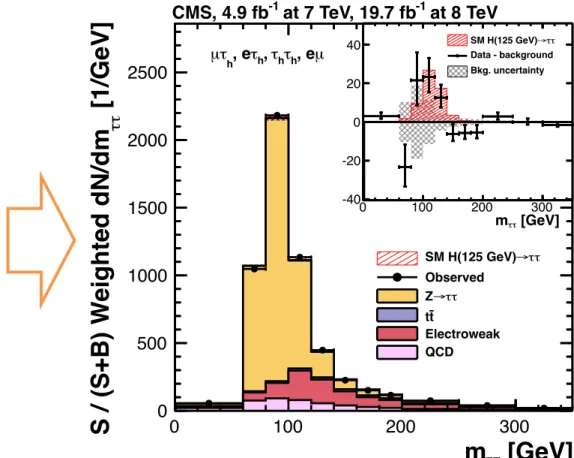
[1/GeV]
ττS / ( S+ B ) W e ig h ted d N/ dm
0 500 1000 1500 2000 2500
τ τ SM H(125 GeV)→ Observed
τ τ Z→
t t
Electroweak QCD
[GeV]
τ
mτ
0 100 200 300
-40 -20 0 20
40 SM H(125 GeV)→ττ
Data - background Bkg. uncertainty
at 8 TeV at 7 TeV, 19.7 fb-1
CMS, 4.9 fb-1
, eµ τh
τh h, , eτ τh
µ
41
[GeV]
τ
mτ
0 100 200 300
[1/GeV]ττdN/dm
0 5 10 15 20 25 30 35
40 at 8 TeV
CMS, 19.7 fb-1
τh
µ
τh
1-jet high pT
boosted
τ τ
→ SM H(125 GeV) Observed
τ τ Z→
t t
Electroweak QCD
Bkg. uncertainty
[GeV]
τ
mτ
0 100 200 300
[1/GeV]ττdN/dm
0 20 40 60 80 100 120 140
160 at 8 TeV
CMS, 19.7 fb-1
τh
µ
τh
0-jet high pT τ τ SM H(125 GeV)→ Observed
τ τ
→ Z
t t
Electroweak QCD
Bkg. uncertainty
[GeV]
τ
mτ
0 100 200 300
[1/GeV]ττdN/dm
0 10 20 30 40 50 60
70 at 8 TeV
CMS, 19.7 fb-1
τh
µ
τh
1-jet high pT τ τ SM H(125 GeV)→ Observed
τ τ
→ Z
t t
Electroweak QCD
Bkg. uncertainty
[GeV]
τ
mτ
0 100 200 300
[1/GeV]ττdN/dm
0.0 0.1 0.2 0.3 0.4 0.5
at 8 TeV CMS, 19.7 fb-1
τh
µ
Tight VBF tag
τ τ SM H(125 GeV)→ Observed
τ τ
→ Z
t t
Electroweak QCD
Bkg. uncertainty
[GeV]
τ
mτ
0 100 200 300
[1/GeV]ττdN/dm
0 200 400 600 800 1000 1200 1400
at 8 TeV CMS, 19.7 fb-1
τh
µ
τh
0-jet low pT
τ τ SM H(125 GeV)→ Observed
τ τ Z→
t t
Electroweak QCD
Bkg. uncertainty
[GeV]
τ
mτ
0 100 200 300
[1/GeV]ττdN/dm
0 20 40 60 80 100 120 140 160 180 200 220
240 at 8 TeV
CMS, 19.7 fb-1
τh
µ
τh
1-jet low pT
τ τ SM H(125 GeV)→ Observed
τ τ Z→
t t
Electroweak QCD
Bkg. uncertainty
[GeV]
τ
mτ
0 100 200 300
[1/GeV]ττdN/dm
0.0 0.2 0.4 0.6 0.8 1.0 1.2 1.4 1.6 1.8
2.0 at 8 TeV
CMS, 19.7 fb-1
τh
µ
Loose VBF tag
τ τ SM H(125 GeV)→ Observed
τ τ Z→
t t
Electroweak QCD
Bkg. uncertainty
Figure 20: Observed and predicted m tt distributions in the µt h channel, for all categories used in the 8 TeV data analysis. The normalization of the predicted background distributions corre- sponds to the result of the global fit. The signal distribution, on the other hand, is normalized to the SM prediction. The signal and background histograms are stacked.
41
[GeV]
τ
mτ
0 100 200 300
[1/GeV]ττdN/dm
0 5 10 15 20 25 30 35
40 at 8 TeV
CMS, 19.7 fb-1
τh
µ
τh
1-jet high pT
boosted
τ τ SM H(125 GeV)→ Observed
τ τ Z→
t t
Electroweak QCD
Bkg. uncertainty
[GeV]
τ
mτ
0 100 200 300
[1/GeV]ττdN/dm
0 20 40 60 80 100 120 140
160 at 8 TeV
CMS, 19.7 fb-1
τh
µ
τh
0-jet high pT τ τ
→ SM H(125 GeV) Observed
τ τ Z→
t t
Electroweak QCD
Bkg. uncertainty
[GeV]
τ
mτ
0 100 200 300
[1/GeV]ττdN/dm
0 10 20 30 40 50 60
70 at 8 TeV
CMS, 19.7 fb-1
τh
µ
τh
1-jet high pT τ τ
→ SM H(125 GeV) Observed
τ τ Z→
t t
Electroweak QCD
Bkg. uncertainty
[GeV]
τ
mτ
0 100 200 300
[1/GeV]ττdN/dm
0.0 0.1 0.2 0.3 0.4 0.5
at 8 TeV CMS, 19.7 fb-1
τh
µ
Tight VBF tag
τ τ
→ SM H(125 GeV) Observed
τ τ Z→
t t
Electroweak QCD
Bkg. uncertainty
[GeV]
τ
mτ
0 100 200 300
[1/GeV]ττdN/dm
0 200 400 600 800 1000 1200 1400
at 8 TeV CMS, 19.7 fb-1
τh
µ
τh
0-jet low pT
τ τ SM H(125 GeV)→ Observed
τ τ
→ Z
t t
Electroweak QCD
Bkg. uncertainty
[GeV]
τ
mτ
0 100 200 300
[1/GeV]ττdN/dm
0 20 40 60 80 100 120 140 160 180 200 220
240 at 8 TeV
CMS, 19.7 fb-1
τh
µ
τh
1-jet low pT
τ τ SM H(125 GeV)→ Observed
τ τ
→ Z
t t
Electroweak QCD
Bkg. uncertainty
[GeV]
τ
mτ
0 100 200 300
[1/GeV]ττdN/dm
0.0 0.2 0.4 0.6 0.8 1.0 1.2 1.4 1.6 1.8
2.0 at 8 TeV
CMS, 19.7 fb-1
τh
µ
Loose VBF tag
τ τ SM H(125 GeV)→ Observed
τ τ
→ Z
t t
Electroweak QCD
Bkg. uncertainty
Figure 20: Observed and predicted m tt distributions in the µt h channel, for all categories used in the 8 TeV data analysis. The normalization of the predicted background distributions corre- sponds to the result of the global fit. The signal distribution, on the other hand, is normalized to the SM prediction. The signal and background histograms are stacked.
41
[GeV]
τ
mτ
0 100 200 300
[1/GeV]ττdN/dm
0 5 10 15 20 25 30 35
40 at 8 TeV
CMS, 19.7 fb-1
τh
µ
τh
1-jet high pT
boosted
τ τ SM H(125 GeV)→ Observed
τ τ Z→
t t
Electroweak QCD
Bkg. uncertainty
[GeV]
τ
mτ
0 100 200 300
[1/GeV]ττdN/dm
0 20 40 60 80 100 120 140
160 at 8 TeV
CMS, 19.7 fb-1
τh
µ
τh
0-jet high pT τ τ SM H(125 GeV)→ Observed
τ τ Z→
t t
Electroweak QCD
Bkg. uncertainty
[GeV]
τ
mτ
0 100 200 300
[1/GeV]ττdN/dm
0 10 20 30 40 50 60
70 at 8 TeV
CMS, 19.7 fb-1
τh
µ
τh
1-jet high pT τ τ SM H(125 GeV)→ Observed
τ τ Z→
t t
Electroweak QCD
Bkg. uncertainty
[GeV]
τ
mτ
0 100 200 300
[1/GeV]ττdN/dm
0.0 0.1 0.2 0.3 0.4 0.5
at 8 TeV CMS, 19.7 fb-1
τh
µ
Tight VBF tag
τ τ SM H(125 GeV)→ Observed
τ τ Z→
t t
Electroweak QCD
Bkg. uncertainty
[GeV]
τ
mτ
0 100 200 300
[1/GeV]ττdN/dm
0 200 400 600 800 1000 1200 1400
at 8 TeV CMS, 19.7 fb-1
τh
µ
τh
0-jet low pT
τ τ SM H(125 GeV)→ Observed
τ τ Z→
t t
Electroweak QCD
Bkg. uncertainty
[GeV]
τ
mτ
0 100 200 300
[1/GeV]ττdN/dm
0 20 40 60 80 100 120 140 160 180 200 220
240 at 8 TeV
CMS, 19.7 fb-1
τh
µ
τh
1-jet low pT
τ τ SM H(125 GeV)→ Observed
τ τ Z→
t t
Electroweak QCD
Bkg. uncertainty
[GeV]
τ
mτ
0 100 200 300
[1/GeV]ττdN/dm
0.0 0.2 0.4 0.6 0.8 1.0 1.2 1.4 1.6 1.8
2.0 at 8 TeV
CMS, 19.7 fb-1
τh
µ
Loose VBF tag
τ τ SM H(125 GeV)→ Observed
τ τ Z→
t t
Electroweak QCD
Bkg. uncertainty
Figure 20: Observed and predicted m tt distributions in the µt h channel, for all categories used
in the 8 TeV data analysis. The normalization of the predicted background distributions corre-
sponds to the result of the global fit. The signal distribution, on the other hand, is normalized
to the SM prediction. The signal and background histograms are stacked.
Significance and mass!
6!
!
• 3.2 sigma evidence for H→ττ decays (3.7 expected) at ! m H = 125 GeV
• Mass: 122 ± 7 GeV – compatible with 125 GeV!
!
Jan Steggemann![GeV]
m
H100 120 140
lnL ∆ -2
0 5 10 15 20
Observed Parabolic fit
H (125 GeV) Expected Expected 1σ
±
Expected 2σ
±
1σ 2σ at 8 TeV at 7 TeV, 19.7 fb-1
, 4.9 fb-1
τ τ CMS H→
[GeV]
m
H100 120 140
Local p-value
10-8
10-7
10-6
10-5
10-4
10-3
10-2
10-1
1
5σ 4σ 3σ 2σ 1σ
Observed p-value
H) Expected for SM H(m
at 8 TeV at 7 TeV, 19.7 fb-1
, 4.9 fb-1
τ τ CMS H→
Best fit µ
0 2 4
0-jet
±1.09 0.34
1-jet
±0.46 1.07
2-jet (VBF tag)
±0.41 0.94
τ
hL + l ' + LL + ll
±1.02 -0.33
τ τ H →
±0.27 0.78 = 125 GeV
mH
at 8 TeV at 7 TeV, 19.7 fb-1
CMS, 4.9 fb-1
Signal strength by jet/lepton multiplicity!
7!
!
• Most of the sensitivity from VBF and 1-jet categories!
– 0-jet category constrains backgrounds and tau energy scale!
• Best fit signal strength modifier µ = 0.78 ± 0.27
!
Jan Steggemann!
Couplings!
8!
!
• Constraints on !
fermionic and bosonic!
couplings!
– compatible with SM expectation
• Sensitivity to bosonic!
coupling from VBF!
production and H→WW ! decays (in particular in ! eµ channel)!
Jan Steggemann!
H→WW decays treated as signal"
31
[GeV]
m
H100 120 140
lnL ∆ -2
0 5 10 15 20
Observed Parabolic fit
H (125 GeV) Expected Expected
1σ
±
Expected 2σ
±
1 σ 2 σ
at 8 TeV at 7 TeV, 19.7 fb-1, 4.9 fb-1
τ τ CMS H→
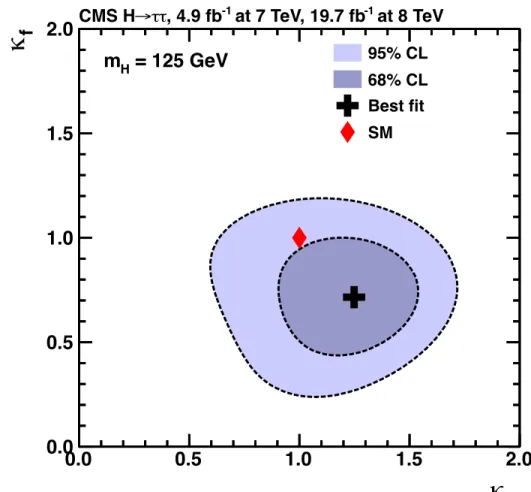
κ
V0.0 0.5 1.0 1.5 2.0
f
κ
0.0 0.5 1.0 1.5 2.0
95% CL 68% CL Best fit SM
= 125 GeV m
Hat 8 TeV at 7 TeV, 19.7 fb-1
, 4.9 fb-1
τ τ CMS H→
Figure 18: Scan of the negative log-likelihood difference, 2D ln L , as a function of m H (left) and as a function of k V and k f (right). For each point, all nuisance parameters are profiled. For the likelihood scan as a function of m H , the background-only hypothesis includes the pp ! H(125 GeV) ! WW process for every value of m H . The observation (solid line) is compared to the expectation (dashed line) for a SM Higgs boson with mass m H = 125 GeV. For the likelihood scan as a function of k V and k f , the H ! WW contribution is treated as a signal process.
10 Summary
We report a search for the standard model Higgs boson decaying into a pair of t leptons. The search is based on the full proton-proton collision sample recorded by CMS in 2011 and 2012, corresponding to an integrated luminosity of 4.9 fb 1 at a centre-of-mass energy of 7 TeV and 19.7 fb 1 at 8 TeV. The analysis is performed in six channels corresponding to the final states µt h , et h , t h t h , eµ, µµ, and ee. The gluon-gluon fusion and vector-boson fusion production of a Higgs boson are probed in the one-jet and two-jet final states, respectively, whereas the production of a Higgs boson in association with a W or Z boson decaying leptonically is tar- geted by requiring additional electrons or muons in the final state. An excess of events over the background-only hypothesis is observed with a local significance in excess of 3 standard deviations for Higgs boson mass hypotheses between m H = 115 and 130 GeV, and equal to 3.2 standard deviations at m H = 125 GeV, to be compared to an expected significance of 3.7 standard deviations. The best fit of the observed H ! tt signal cross section times branch- ing fraction for m H = 125 GeV is 0.78 ± 0.27 times the standard model expectation. Assum- ing that this excess corresponds to a Higgs boson decaying to tt, its mass is measured to be m H = 122 ± 7 GeV. These results constitute evidence for the coupling between the t lepton and the 125 GeV Higgs boson discovered in 2012 by the ATLAS and CMS Collaborations.
Acknowledgements
We congratulate our colleagues in the CERN accelerator departments for the excellent perfor-
mance of the LHC and thank the technical and administrative staffs at CERN and at other CMS
institutes for their contributions to the success of the CMS effort. In addition, we gratefully
Higgs decays to fermions!
9!
!
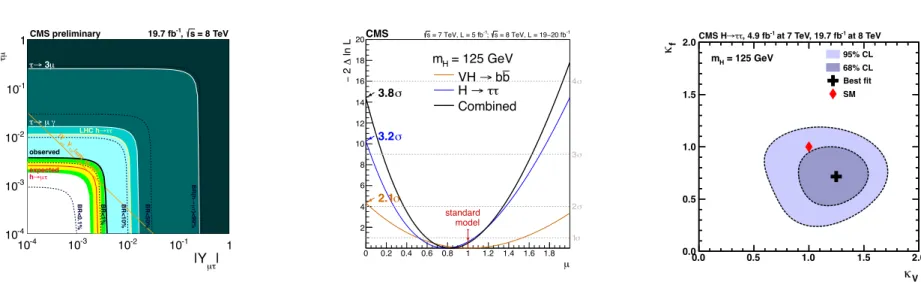
• Combination with VH→bb (previous talk)!
• Observed (expected)
combined significance of!
3.8 (4.4) sigma !
• Best-fit signal strength!
µ = 0.83 ± 0.24!
• Evidence for direct decay of the Higgs boson to
fermions
!
Jan Steggemann!µ
0 0.2 0.4 0.6 0.8 1 1.2 1.4 1.6 1.8
ln L ∆ 2 −
2 4 6 8 10 12 14 16 18 20
1σ 2σ 3σ 4σ 5σ
2.1 σ 3.2 σ 3.8 σ
= 125 GeV m
Hb
→ b VH
τ τ H →
Combined
CMS
s = 7 TeV, L = 5 fb-1; s = 8 TeV, L = 19−20 fb-1model standard
Nature Physics 10 (2014)
Advance online publica<on
2] ) [GeV/c µ M(µ 2 Events/1.0 GeV/c
0 1000 2000 3000 4000 5000 6000 7000 8000
9000 Data
Background Model
× 20
=125 GeV Signal mH
CMS Preliminary S/(S+B) Weighted
=7 TeV L = 5.0 fb-1
s
=8 TeV L = 19.7 fb-1
s
2] ) [GeV/c µ
M(µ
110 120 130 140 150 160
FitData-Fit
-3 -2 -1 0 1 2 3
2] [GeV/c mH
120 130 140 150
)µµ→ (H SMσ/σ95% CL Limit on
0 5 10 15 20 25 30 35 40
CMS Preliminary = 7 TeV L = 5.0 fb-1
s
= 8 TeV L = 19.7 fb-1
s
Combination
Search for H→ µµ !
10!
• Fit of parameterised background & signal shapes in various event categories!
• Observed limit: µ(H→ µµ ) < 7.4 x SM expectation (5.1 expected)!
– Similar results in H→ee channel!
• As expected, Higgs boson decays to leptons are not universal
!
Jan Steggemann!CMS-PAS-HIG-13-007
Signal x 20
A. Levine 3
SM H→ττ
●
H→τ μ τ h and H→τ μ τ e have a very similar signature to H→μτ
●
Allows us to use many of the same methods as the CMS SM H→ττ analysis
●
Differences in event topology
– Harder P T spectrum of muons
– Different Δ ϕ μ-MET Δ ϕ τ-MET
Search for H→ µτ !
11!
!
• Previous best limits on B(H→µτ) <~ 10% from reinterpretation of LHC H→ττ searches and from τ→µγ$
arXiv:1209.1397!– Can do better with first dedicated search
• Consider hadronic (τ h ) and electron (τ e ) tau decays!
• Same basic event selection and jet categories as SM H→ττ analysis (0-jet, 1-jet, VBF-tag)!
• Differences in kinematics!
– Harder muon p T spectrum – Δϕ between µ, τ h /τ e , !
missing energy vector
!
CMS-PAS-HIG-14-005
Jan Steggemann!
NEW RESULT
Events / 20 GeV
0 1 2 3 4 5 6 7
τe
Data, µ
Bckg Uncertainty SM Higgs
(embedded) τ
Z+τ
e)
µτ (not τ l-
Z+l+
Single top quark +Jets t t
* γ / W γ W VV Fake leptons LFV Higgs (Br=0.9%)
= 8 TeV s
-1, 19.7 fb CMS preliminary
) [GeV]
τe
collinear M(µ
0 100 200 300
Bckg (fit)Data-Bckg (fit)
-0.5 0 0.5
Events / 10 GeV
0 100 200 300 400 500 600 700
τe
Data, µ Bckg Uncertainty SM Higgs
(embedded) τ Z+τ
l-
Z+l+
Single top quark t
t VV
* γ / W γ W
Fakes (leptons) LFV GG Higgs (Br=100%) LFV VBF Higgs (Br=100%)
= 8 TeV s
-1, 19.7 fb CMS preliminary
) [GeV]
τe
collinear M(µ
0 100 200 300
BckgData-Bckg -0.5
0 0.5
Observable and final selection!
12!
• Collinear approximation to reconstruct Higgs boson mass!
• Optimise selection for each category based on various kinematic variables !
!
Jan Steggemann!Full selection
µτ
eVBF-tag pre-selection
µτ
eVBF-tag final selection
B = 100% B = 0.9%
Events / 10 GeV
0 100 200 300 400
500 had
τ µ Data, Bckg Uncertainty SM H
(embedded) τ Z+τ
had) µτ (not τ l- Z+l+ Single top quark
+Jets t t VV
) τ
→ Fakes (jet LFV Higgs (Br=0.9%)
= 8 TeV s
-1, 19.7 fb CMS preliminary
) [GeV]
τhad
collinear M(µ
100 200 300
Bckg (fit)Data-Bckg (fit)
-0.5 0 0.5
Events / 20 GeV
0 1 2 3 4 5 6 7
τe
Data, µ Bckg Uncertainty SM Higgs
(embedded) τ τ Z+
e)
µτ (not τ l-
Z+l+
Single top quark +Jets t t
* γ / W γ W VV Fake leptons LFV Higgs (Br=0.9%)
= 8 TeV s
-1, 19.7 fb CMS preliminary
) [GeV]
τe
collinear M(µ
0 100 200 300
Bckg (fit)Data-Bckg (fit)
-0.5 0 0.5
Final collinear mass distributions!
Jan Steggemann! 13!
VBF-tag
Events / 10 GeV
0 10 20 30 40 50 60
τe
Data, µ Bckg Uncertainty SM Higgs
(embedded) τ τ Z+
e)
µτ (not τ l-
Z+l+
Single top quark +Jets t t
* γ / W γ W VV Fake leptons LFV Higgs (Br=0.9%)
= 8 TeV s
-1, 19.7 fb CMS preliminary
) [GeV]
τe
collinear M(µ
50 100 150 200 250 300
Bckg (fit)Data-Bckg (fit)
-0.5 0 0.5
µτ
e
µτ
h
1-jet 0-jet
B = 0.9%
Events / 50 GeV
0 2 4 6 8 10 12 14 16 18 20
τhad µ Data, Bckg Uncertainty SM H
(embedded) τ Z+τ
had) µτ (not τ l- Z+l+ Single top quark
+Jets t t VV
) τ
→ Fakes (jet LFV Higgs (Br=0.9%)
= 8 TeV s
-1, 19.7 fb CMS preliminary
) [GeV]
τhad
collinear M(µ
0 100 200 300
Bckg (fit)Data-Bckg (fit) -0.50 0.5 1
VBF-tag
Events / 10 GeV
0 20 40 60 80 100 120 140 160 180
τhad µ Data, Bckg Uncertainty SM H
(embedded) τ Z+τ
had) µτ (not τ l- Z+l+ Single top quark
+Jets t t VV
) τ
→ Fakes (jet LFV Higgs (Br=0.9%)
= 8 TeV s
-1, 19.7 fb CMS preliminary
) [GeV]
τhad
collinear M(µ
0 100 200 300
Bckg (fit)Data-Bckg (fit)
-0.5 0 0.5
1-jet
0-jet
τ ), % µ
95% CL Limit on Br(h →
0 2 4 6 8 10
1.57% (obs.) 0.75% (exp.)
τ µ h →
3.84% (obs.) 3.77% (exp.)
, 2 Jets τ
eµ
2.38% (obs.) 1.66% (exp.)
, 1 Jet τ
eµ
2.04% (obs.) 1.32% (exp.)
, 0 Jets τ
eµ
3.29% (obs.) 1.95% (exp.)
, 2 Jets τ
hadµ
2.11% (obs.) 2.10% (exp.)
, 1 Jet τ
hadµ
2.94% (obs.) 2.35% (exp.)
, 0 Jets τ
hadµ
Observed Expected
1σ Expected ±
2σ Expected ±
= 8 TeV s
-1
, 19.7 fb CMS preliminary
Limits on H→µτ branching ratio!
14!
! !
• Comparable sensitivity!
from all channels!
• Observed limit 1.57% (exp.
0.75%)!
!
• Large improvement of previous limits!
• Background-only
p-value of 0.007 (2.46σ)
– Best-fit ! B(H→µτ) =
!
Jan Steggemann!
12 8 Results
category in Tables 7 and 8. Combining all the channels an expected upper limit of B ( H !
238
µt ) < 0.75% ± 0.38% is obtained. The observed upper limit is B ( H ! µt ) < 1.57% which
239
exceeds the expected limit due to a slight excess of events. The fit can then be used to estimate
240
the branching fraction if this excess were to be interpreted as a signal.
241
The best fit values for the branching fractions are given in table 9. The limits and best fit
242
branching fractions are also summarized graphically for comparison in Figure 5. The combined
243
categories give a best fit of B ( H ! µt ) = 0.89 + 0.40 0.37 %.
244
Finally the categories are combined in Figure 6 which also shows a MC Higgs signal for a
245
branching fraction of 0.89%. The combined excess is 2.5 s which corresponds to a p-value of
246
0.007. The combined plot in which each category is weighted by “global” significance is shown
247
in figure 7. Global significance means the significance (S / ( S + B ) ) i