The time spent in the program showed a worsening of the situation of poverty and material deprivation. Around 17% of the food organizations mentioned a decrease in the number of users of social canteens.
Food deprivation
By family type, single-parent households have been observed to have the highest proportion of this type of food insecurity, followed by other households with dependent children. 2 adults without dependent children 3.2 Other households without dependent children 4.1 1 adult with 1 or more dependent children 8.1 2 adults with 1 or more dependent children 2.3 Other households with dependent children 5.8.

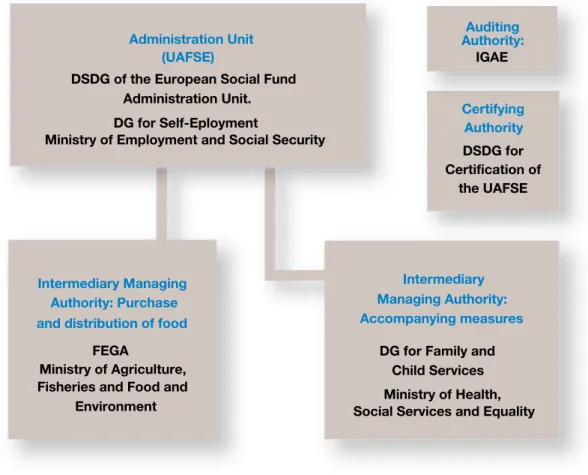
The FEAD Programme in Spain
The Ministry of Agriculture, Fisheries and Food and Environment, through the Spanish Agricultural Guarantee Fund (FEGA) and the Ministry of Health, Social Services and Equality, through the General Directorate for Family and Children Services, are the Intermediary Governing Bodies of the program. For determining the composition of the food basket, the suggestions made by the Distribution Partner Organizations and the food experts of the Ministry of Agriculture, Fisheries and Food and Environment were taken into consideration.
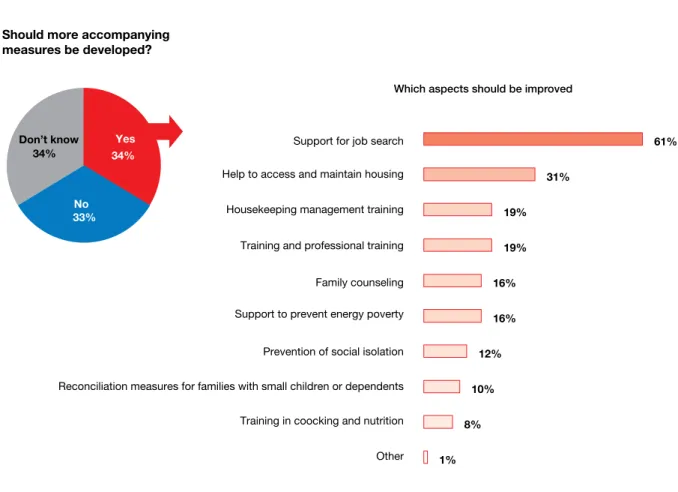
Accompanying Measures
A face-to-face survey of 27,443 beneficiaries throughout Spain, carried out by technical and voluntary staff of storage and distribution centers during the 3rd phase, developed in the months of March to April 2018. The second objective is to analyze the performance of the FEAD food aid program, at taking into account its advantages and disadvantages.
Structure of this Bulletin
Due to the low level of sampling error of the surveys, it can be concluded that the results of this study are highly representative of the reality they attempt to describe.
Part One
BENEFICIARIES
Survey description
About 88% of respondents were FEAD beneficiaries in delivery organizations and 12% in feeding organizations. Distribution of respondents according to the type of organization from which they receive food.
Socio-demographic characteristics
Considering the gender distribution, 59% of men had dependent children (46% married or in a partnership, 13% single, separated, divorced or widowed) versus 79% of women (39% married or in a partnership and 40% single, separated, divorced or widowed). In addition, 1% of households had an adult with a disability or serious illness.

Ocupational status
I have uncertain or very short contracts. I work in housekeeping/cleaning. I have been unemployed for less than a year. I have been unemployed for more than a year. I have been unemployed for more than two years. I work in the sunk economy. Distribution of people in the final recipient's household who worked in the submerged economy.

Receipt of non-contributory income
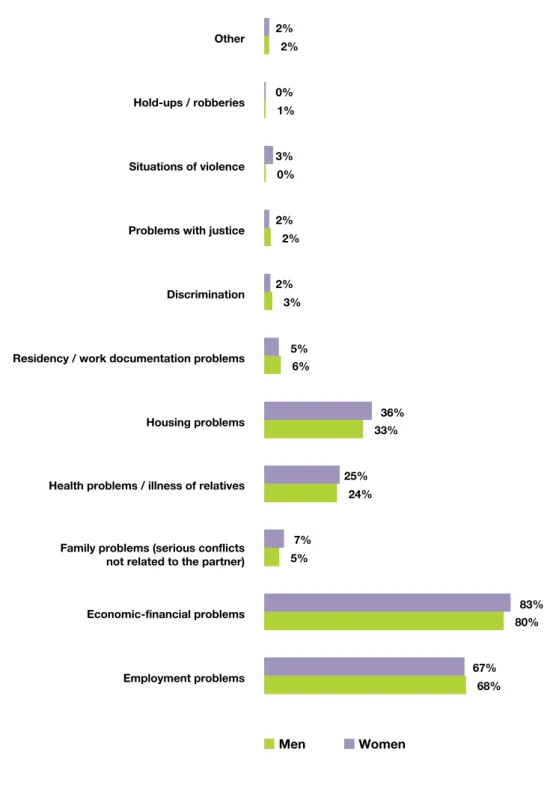
Main problems
I haven't paid the mortgage for a while I lost my house I had to go back to live with my family I live in a shelter for victims of gender violence I live in shelters, rooms or sheltered apartments I live on the street I usually to share a house with other families My family had to return to our country I can't pay for electricity, gas, telephone, municipal services I can't pay the rent I live in a dangerous neighborhood. I lost my house I had to go back to live with my family I live in a shelter for victims of gender violence I live in shelters, rooms or sheltered apartments I live on the street I usually share a house with other families My family had to move back to our country I can't pay for electricity, gas, telephone, municipal services I can't pay the rent I live in a dangerous neighborhood.
Incomes
Relative poverty
Child poverty
In-work poverty
Part Two
BENEFICIARIES’ PERSPECTIVE
Knowledge of the FEAD Food programme
Access to the FEAD programme
The Social Report
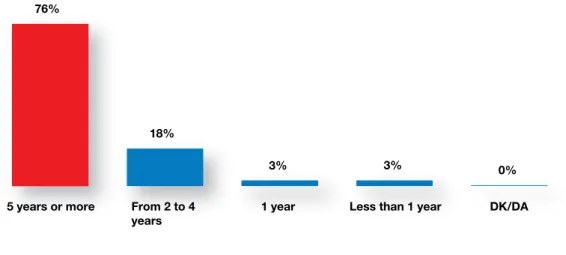
Time of permanence
By analyzing the grouped employment categories, it was noticed that the distribution of the time receiving the help by the group of employed persons is practically the same as for the group of unemployed people. The most important differences were observed with the group of retired people, where 26% of them received this help for five or more years; to a lesser extent this also occurred in the group "other employment situations".

Receipt of non-FEAD food
Delivery of FEAD food
Attendance at social canteens
General evaluation of the FEAD food
Regarding the quality of the program, within the proposed scale (value 5 out of 5), 81% of the beneficiaries surveyed attributed the highest level of satisfaction to the friendliness of the people who participated in it; Assessment of aspects related to the quality of the FEAD program (scale from 1 to 5, with 5 being the maximum score).

Evaluation of each FEAD food
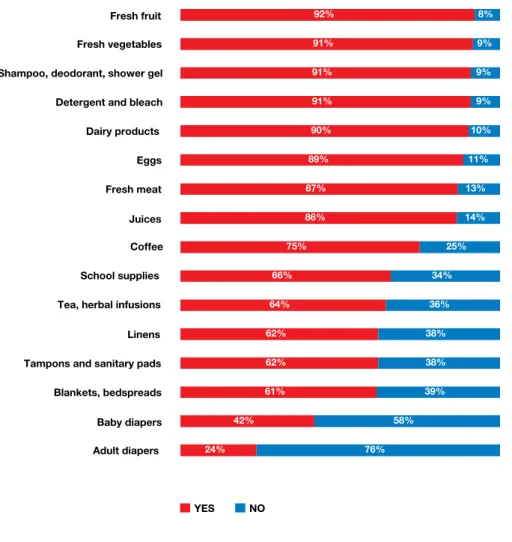
Regarding the products that the surveyed beneficiaries thought should be added to the FEAD basket because they were too expensive to consider buying, most indicated fresh vegetables and fruit (92% in both cases), followed by personal hygiene and cleaning products ( 91%). List of products that beneficiaries believe should be added to what they receive from FEAD because they consider them necessary and too expensive.
Alternatives to the FEAD programme
Reasons for not applying for FEAD food
Recommendation of the FEAD programme to others
Social & Community Resources Brochure and aid received
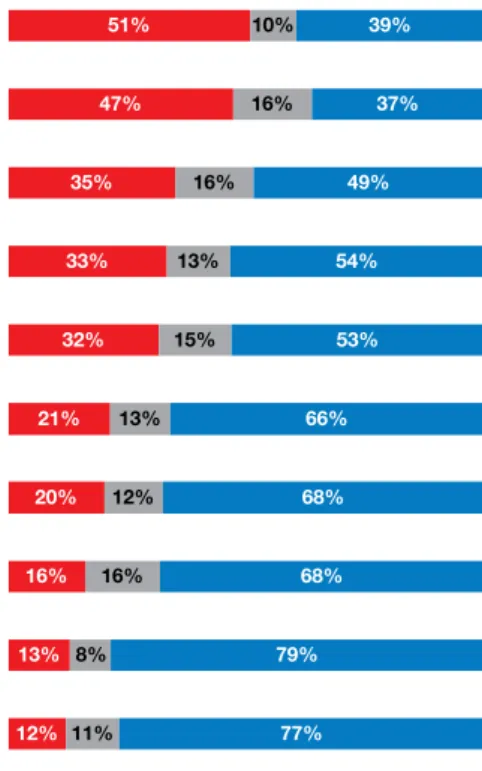
I didn't receive it Not at all helpful Somewhat helpful Very helpful I didn't know there was a brochure. Regarding the additional support (accompanying measures) that FEAD food recipients were currently receiving, 51% said they received a brochure with addresses from social services, 47% said it helped them with social service procedures, and 35 % said it gave them guidance to leave their current situation and 33% offered them guidance courses for work.
Participation in other social intervention programmes and most outstanding needs
Part Three
FROM THE SIX WORKSHOPS HELd WITH THE BENEFICIARIES
The content of this section describes the views of the beneficiaries of the FEAD grant programme. In some cases, nuances are introduced to clarify questions of context related to the foundation of the program.

Profiles
A fourth profile is that of female victims of gender violence, who, despite being recognized as such and receiving help due to this circumstance, cannot afford to support their children. Most had a low or average level of training, with the exception of people of Latin American origin, some of whom had higher level training, as well as some of the female victims of gender-based violence.
Distribution of FEAD food aid
What they give me lasts a week because the kids come from school, you have to give them an afternoon snack, dinner and breakfast to go to school. It is important to emphasize that, as previously mentioned, the organizations visited receive private donations from supermarkets or food distributors.
Content of the FEAD aid
CarMen: Muslim culture is respected, they don't eat pork, so there is nothing with pork in the jars, in the things they give them. For example, they eat less legumes on the coast, but inland they are in high demand.
Amount of food and number of members in the family unit
Salvadora: Perhaps then it would be necessary to assess the type of families, those who have children, those who do not have children, because there are different needs. Marien: Yes, with the children the biggest problem is the afternoon snack, there is a lack of pate, mini cheeses, cheese portions, there are yogurts that do not need to be refrigerated.
Modality of food delivery
There were chest freezers, for example, chests that had to be emptied, and it's fresh fish, and you have food that people can freeze. When they got this material, they gave it to the people who need it, for example skimmed milk.
Bureaucracy to access the programme
Sandra: Ugh!, they gave me up and down, they told me to go down, to social security, where they give you documentation, certificates of people who live in the house. In addition to legal documentation (convictions, protection orders), women who are victims of sexual violence must also submit a social service certificate of this condition for assistance processing. 15.
Volunteers
Some results to take into account
Parte four
VOLUNTEERS OF THE FEAD PROgRAMME
Characteristics of the staff and volunteers
Level of satisfaction of beneficiaries
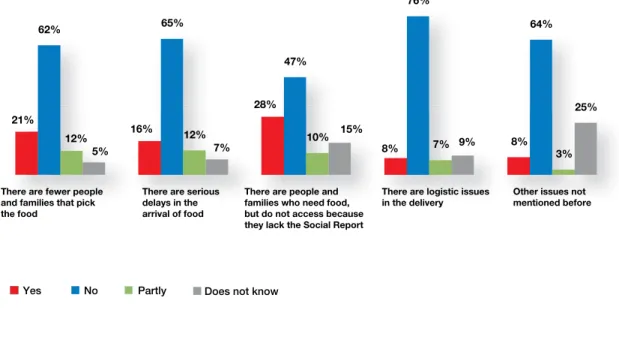
Actions with the beneficiaries: it was indicated that nutrition training would be beneficial, in addition to professional training and support in the search for work. When the technical and volunteer staff were asked if they had noticed significant changes in the program in the past year, the majority did not perceive problems of lack of interest in the collection of food by the families, or of distribution logistics; nor noticed possible delays in the deliveries.
Improvements of FEAD programme
Part five
Characteristics of Delivery Organisations
The frequency of food delivery most chosen was that of "one delivery per month" (26%), followed by that of. Any One One every 2 months Two One every 3 months Other One every 4 months Several per month One per month.

Changes seen in the last year
General evaluation of the FEAD programme
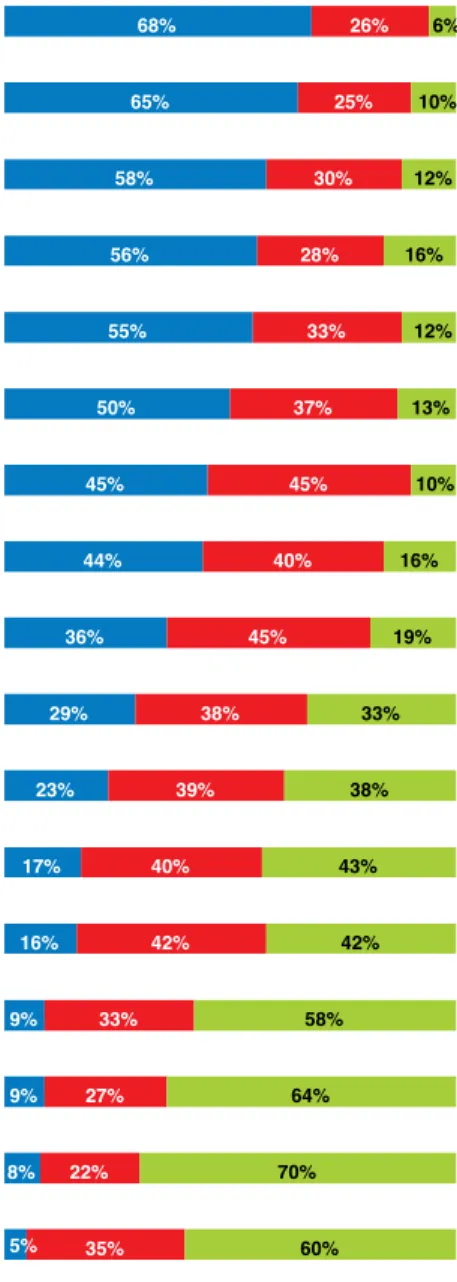
About 59% of the respondents from these organizations noted that, thanks to the FEAD program, the organizations know the social reality much better; 43% said it pays better attention to the child population; 33% indicated that they gained more capacity from technical management; and finally 21%.

Food accumulation
Distribution of non-FEAD products
Diapers of different sizes should be included for children The Social Report is fundamental Blankets and hygiene kits for the homeless people should be distributed FEAD food is correct and sufficient Feminine Hygiene products should be included The Program should allow the allocation of transport costs to be included to bring food to people and families in isolated areas, with people with disabilities or with children under 1 year. The Social Report is fundamental Blankets and hygiene kits for the homeless people must be distributed.

Evaluation of the assistance offered to individuals and families
The delivery organizations were asked who was responsible for making these reports and 54% indicated that they were made by the social worker in the public administration and 22% indicated that it was the people working in the organization itself. FESBAL's social worker Red Cross social worker Other Another type of professional Social worker in your unit Social worker in the public administration.

Suggestions
It is most appropriate that people in need become responsible for choosing the food that each family needs. Despite the good will of our organization, there are many problems.
Part Six
Characteristics of the Feeding Organisations
The relationship and coordination with program delivery organizations was excellent or good for almost all feeding organizations (99%). About 72% of feeding organizations indicated that the information received was very appropriate and sufficient.
Receipt of Non-FEAD products
The most common sources of other food are donations from individuals (51%), direct purchases by organizations (44%) and donations from supermarkets (41%). Other Donations from other social entities Donations from local producers Donations from supermarkets Direct purchase by the entity Donations from natural persons.

Improvements of the FEAD programme
The commitment we represent is excessive and we cannot continue with the human resources we have (58%). Strongly Agree Partially Agree Strongly Disagree Families receiving food have found other alternative resources.
Consensuses
We would like to have other foods to help us vary the range of products we make available in the hostel. Reduce the minimum number of families needed to be able to request accompanying measures as an independent organization (without having to be a partner)".
EXECUTIVE SUMMARY
Seniors: 7% of the population living in the respondents' households were older than 65 years. About 25% of the people surveyed face very long-term unemployment (more than two years).
BENEFICIARIES PARTICIPATION AND EVALUATION OF THE FEAD PROGRAMME
It should be emphasized that the majority of respondents indicated the need to expand the range of products, for example with fresh fruits and vegetables (92%), personal hygiene products and cleaning products (91%) and fresh dairy products (90%). Participation in other social intervention programs: About 19% of respondents indicated that they participate in other social programs of the Red Cross, 11% in programs of other social organizations, and 6% in Food Bank programs.
PROPOSALS MADE BY THE BENEFICIARIES
EVALUATION MADE BY STAFF AND VOLUNTEERS OF THE FEAD PROGRAMME
PARTNER DELIVERY ORGANISATIONS
Overall satisfaction with the program: Approximately 99% of feed organizations were satisfied or completely satisfied with the program. Similar to the delivery organizations, they only did this with certain products (65%), collected the least requested products (25%) and the accumulation occurred because they received the same foods via different routes (21%). .