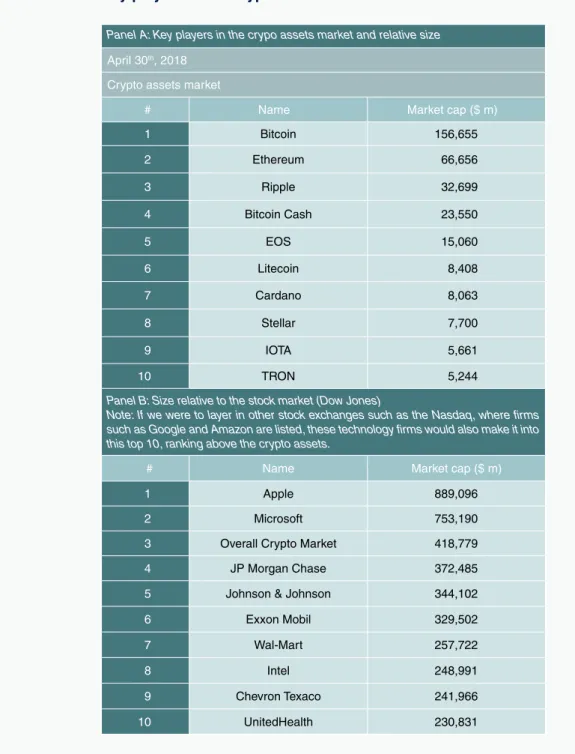
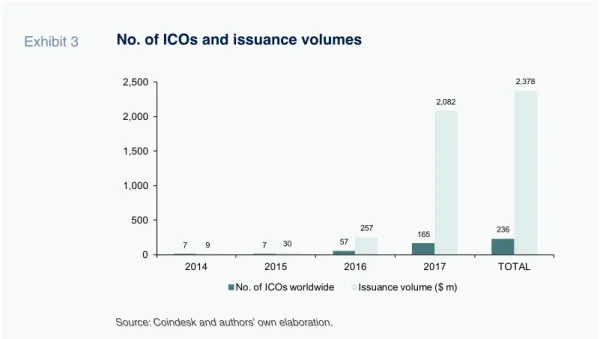
The crypto asset market has clearly been one of the fastest growing in the world in recent years, especially since 2016. The prominence of crypto currencies such as Bitcoin has made this currency manifestation the most famous of the crypto assets to date . The first relates to the extent to which the creators of the cryptocurrencies and tokens find funding.
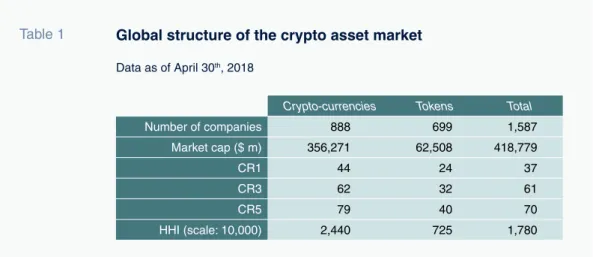
The crypto market has clearly been one of the fastest growing in the world in recent years, especially since 2016. In the case of the crypto asset market, the HHI is 1,780, and is significantly higher in the cryptocurrency segment (2 440) than in signs (725). Where most of the value of cryptocurrencies most likely lies in the associated technology (the blockchain) and the space to make payments in the absence of third-party verification, relying instead on the secure authentication provided by the blockchain presented itself.
The paper highlights the prevailing debate about the volatility represented by the crypto-assets and the suitability of the conventional valuation models for determining the intrinsic value of these assets. The suggestion is that standard price analysis should be supplemented by other methods that specifically consider the cost of producing crypto assets and the value of the underlying technology.
However, the majority of the firms tested in the first two cohorts came from the retail banking sector. According to this report, the majority of firms in the sandbox during the first two cohorts were based in London. In terms of operating efficiency (CtI), the trend was much less favorable than observed in the case of the NPL ratios.
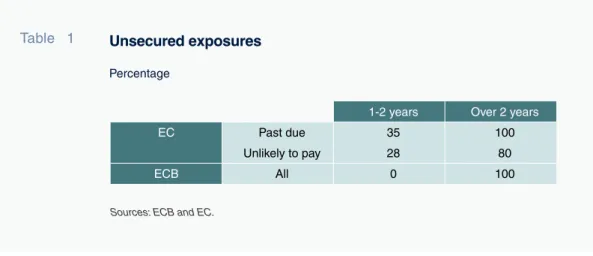
As part of the Supervisory Review and Evaluation Process (SREP) and on the basis of non-performing assets in December 2015, the ECB set out criteria to require many entities to submit a strategic plan for managing their non-performing exposures [1] . In the case of the ECB requirements, both past due and unlikely exposures require 100%. As a result, the impact of these new write-downs on otherwise performing exposures is small for the Spanish banks.
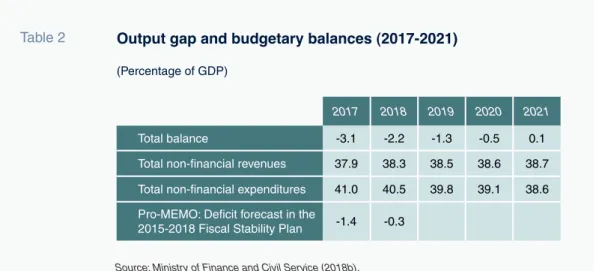
Since 2015, Spanish GDP growth has been one of the strongest in the EU. There is then an assessment of the picture depicted in the general state budget (PGE-2018) and its parliamentary procedure. This is a more easily simulated quantity because inertia and the weight of the past are significantly greater than in the deficit.
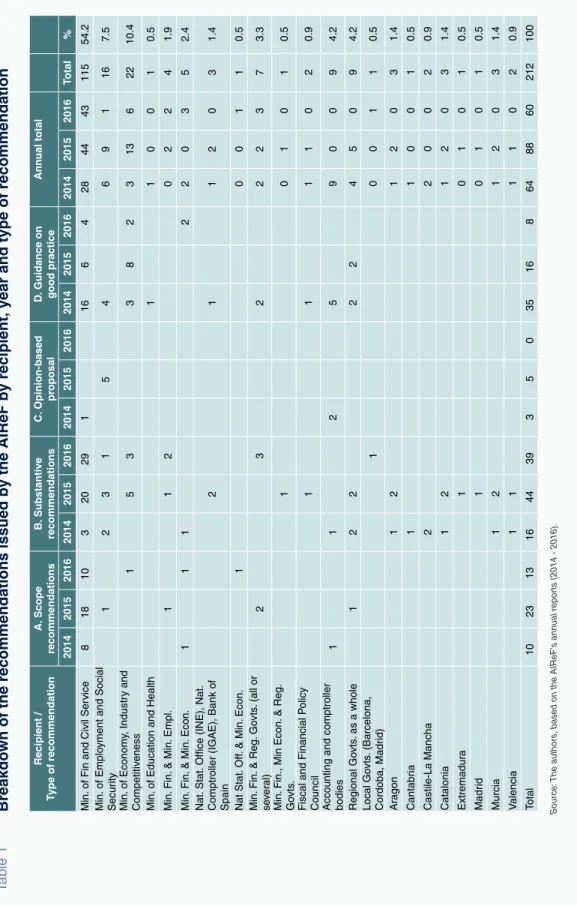
And the number would rise to 85% or more in the event that one of the simulated shocks materializes. This table reproduces a selection of the key topics addressed in the reports published by AIReF between 2014 and 2016. Realistic review of the transition period provided to comply with the borrowing target set by the Stability Act (60% of GDP in 2020).
For now, the focus of the negotiations between the EU and the United States is on the. This gap is still observed over time, albeit narrowing, in the case of the men. All the women who in 2008 had an indefinite contract and earned a salary in the private sector.
Prepared by the Regulation and Research Department of the Spanish Confederation of Savings Banks (CECA). Rates of 0.7% in the second quarter and 0.6% in the remaining quarters of the year are expected. This expected rate is in line with the forecasts of the Spanish government and the European Commission.
According to the labor force survey, seasonally adjusted employment increased by 0.5% in the first quarter of the year.
Contribution to GDP annual growth Percentage points
GDP Percentage change
Gross fixed capital formation Percentage change
Final consumption Percentage change
Gross value added at basic prices .. and fishing Total Manufacturing Construction Total Public administration, . health, education Other services Taxes minus subsidies on products Chain-linked quantities, annual percentage changes.
GVA, Industry Annual percentage change
GVA, structure by sectors Percentage of value added at basic prices
Employment (job, full-time equivalent). per job Nominal labor cost per unit Actual units. a) Nominal ULC deflated by the GDP/GVA deflator.
Real ULC, total economy Index, 2000=100
Nominal ULC, total economy Index, 2000=100
Real ULC, manufacturing industry Index, 2000=100
Nominal ULC, manufacturing industry Index, 2000=100
National income, consumption and saving rate
National income, consumption and saving
Saving, Investment and Current Account Balance
National accounts: Households and non-financial corporations accounts (ESA 2010, Basis 2010) Forecasts in yellow. savings Gross capital formation Savings rate. gross savings as a percentage of GDI). Annual percentage changes Difference from one year ago Annual percentage changes Difference from one year ago.
Households: Net lending or borrowing Percentage of GDP, 4-quarter moving averages
Non-finantial corporations: Net lending or borrowing
Public sector: Main revenues Percentage of GDP, 4-quarter moving averages
Public sector: Saving, investment and deficit (a)
Government deficit
Government debt Percent of GDP
Branches (f) Electricity consumption (temperature adjusted). confidence index Production income index. a) Seasonally adjusted, except for annual data.
General activity indicators (II) Index
General activity indicators (I) Annualized percent change from previous period
Industrial sector indicators (II) Index
Industrial sector indicators (I) Annualized percent change from previous period
Construction indicators (II) Annualized percentage changes from previous
Construction indicators (I) Annualized percentage changes from previous
Services indicators (II) Index
Services indicators (I) Percentage change from previous period
Industrial orders for consumer goods (right, balance of responses) Index of consumer confidence (right, balance of responses).
Consumption indicators
Investment indicators
Chart 11a.1 - Labor force, Employment and unemployment, S.A. Annual / annualized quarterly growth rates and percentage of active population. Annual percentage changes Difference of. one year ago Annual percentage changes Difference from one year ago. a) Percentage of employees with temporary contract over total employees.
Inflation Rate (I) Annual percentage changes
Inflation rate (II) Annual percentage changes
Housing and urban land prices Index (2007=100)
Wage costs Annual percent change
External trade (real) Percent change from previous period
Trade balance
Balance of payments: Current and capital accounts
Balance of payments: Financial account EUR Billions, 12-month cumulated
Relative Unit Labour Costs in industry (Spain/EMU)
Harmonized Consumer Prices Annual growth in % and percentage points
Recourse to the Eurosystem L/T (Eurozone financial institutions, million euros) 760,140 March 2018 Recourse to the Eurosystem L/T (Spanish financial institutions, million euros) 169,678 March 2018 Recourse to the Eurosystem (Spanish financial institutions million euros). Commentary on "Money and Interest Rates": Interbank rates followed an uneven path in the first two weeks of May. The stock market recorded an increase in the first two weeks of May with the IBEX-35 to 10,208 points and the General Index of the Madrid Stock Exchange to 1,034.
Commentary on "Financial Savings and Debt": In the fourth quarter of 2017, financial savings relative to GDP in the total economy fell to 2% of GDP. Finally, the stock of financial assets on household balance sheets grew by 3.8% and the stock of financial liabilities decreased by 0.1%. Business Development”: The latest data available as of February 2018 shows a decline in bank lending to the private sector of 0.6%.
Market structure and Eurosystem refinancing”: In March 2018, the use of Eurosystem funding by Spanish credit institutions reached 169.68 billion euros. The amount lent by Spanish banks in these programs reached 314.9 billion euros in March and 2.46 billion euros for the entire Eurozone banking system. Sources LFS LFS EPF EPF ID INE ID INE ID INE ID INE ID INE MNP.
Total Fertility Rate: The average number of children that would be born per woman living in Spain if all women lived to the end of their fertile years and gave birth to children at a given fertility rate at each age. Sources OECD OECD OECD OECD INCLAS INCLAS INCLAS INCLAS INCLAS INCLAS INCLAS INCLAS OECD: Organization for Economic Co-operation and Development.
SEFO
WHAT MATTERS