Spanish Economic and Financial OutlookVolume 4 ♦ Number 6
Volume 4 ♦ Number 6
2015
SEF O
Spanish Economic and Financial Outlook
November 2015
Spain´s financial sector post-restructuring:
Credit recovers amidst outstanding challenges
41
Unit labour costs and the evolution of the Spanish manufacturing industry between 2000 and 2014 María Jesús Fernández Sánchez05
Credit, deleveraging, and financial savings:Balancing adjustment and recovery in Spain Santiago Carbó Valverde and Francisco Rodríguez Fernández
49
The internationalisation of the Spanish economy:Progress, limitations and best practices Ramon Xifré
31
The new SME finance landscape:The rise of alternatives to bank lending Irene Peña, A.F.I.
59
Changes in the structure and composition of public-sector employment during the crisisAntonio Montesinos, Javier J. Pérez and Roberto Ramos
73
The consequences of graduating in a recession in Spain Daniel Fernández Kranz and Núria Rodríguez Planas15
Post-restructuring challenges for the Spanish banking sectorJoaquín Maudos
83
Recent key developments in the area of Spanish financial regulationPrepared by the Regulation and Research Department of the Spanish Confederation of Saving Banks (CECA)
87
Spanish economic forecasts panel: November 2015 FUNCAS Economic Trends and Statistics Department01
Letter from the EditorsOrders and information:
SPANISH SAVINGS BANKS FOUNDATION Caballero de Gracia, 28
28013 Madrid Spain
Phone: 91 596 54 81 Fax: 91 596 57 96 [email protected] www.funcas.es
Editorial
Board of Editors Carlos Ocaña Santiago Carbó Ángel Laborda José Félix Sanz Managing Editors Alice B. Faibishenko Juan Núñez-Gallego
Board of Trustees Isidro Fainé Casas (Presidente)
José María Méndez Álvarez-Cedrón (Vicepresidente) Fernando Conlledo Lantero (Secretario)
Miguel Ángel Escotet Álvarez Amado Franco Lahoz Manuel Menéndez Menéndez Pedro Antonio Merino García Antonio Pulido Gutiérrez Victorio Valle Sánchez Gregorio Villalabeitia Galarraga
Contact [email protected] Web Site www.funcas.es Orders or claims:
Spanish Savings Banks Foundation, publications
Tel.; +34-91-5965481, Fax: +34-91-5965796, e-mail: [email protected] Electronic edition
An electronic edition of this journal its available at
http://www.funcas.es/Publicaciones/Index.aspx?Id=47&ddg=0 Printed in Spain
Editorial and Production
Spanish Savings Banks Foundation (FUNCAS) Caballero de Gracia, 28. 28013 Madrid (Spain) Ownership and Copyright:
© Spanish Savings Banks Foundation 2012
ISSN print edition 2254-3899 ISSN electronic edition 2254-3880 Depósito Legal: M-10678-2012 Prints: Cecabank.
05 Credit, deleveraging, and financial savings: Balancing adjustment and recovery in Spain
Santiago Carbó Valverde and Francisco Rodríguez Fernández
Spain is among the countries having made most progress on deleveraging since 2010.
Debt reduction efforts are expected to be compatible with private sector credit growth and positive savings rates in 2016, in line with the trend for the Spanish economy as a whole since 2012.
15 Post-restructuring challenges for the Spanish banking sector
Joaquín Maudos
In the wake of the crisis, Spanish banks have become more solvent and returned to profitability. However, unique macroeconomic conditions, especially the current low interest rate environment, together with increased capital requirements, will require further efforts to boost efficiency and reinvent business strategies to secure positive profits going forward.
31 The new SME finance landscape:
The rise of alternatives to bank lending
Irene Peña, A.F.I.
SME access to multiple and stable sources of finance has become essential for fostering growth and investment in Europe after the crisis. To this end, one of the overriding objectives of the European Commission´s recently published Action Plan on Building a Capital Markets Union (CMU) is to boost the benefits for the economy from increased reliance on capital markets and non-financial intermediaries.
41 Unit labour costs and the evolution of the Spanish
manufacturing industry between 2000 and 2014
María Jesús Fernández Sánchez
Although Spain´s manufacturing sector suffered cost-competitiveness losses throughout the growth phase and early years of the crisis, falling wages during subsequent years may be underpinning the sector´s more recent recovery. At the same time, breaking down performance into export-oriented industry segments and ones that serve the domestic market reveals a need to strengthen the latter.
49 The internationalisation of the Spanish economy: Progress, limitations and best practices Ramon Xifré
Spanish exports of goods and services over recent years grew at a rate comparable only to Europe´s leading major exporters.
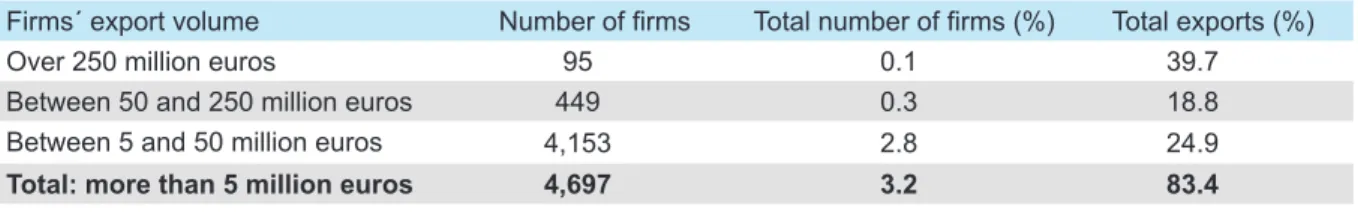
However, the level of concentration in just a few exporting companies suggests smaller companies at the base of Spain´s exporting pyramid still face considerable constraints, leaving significant room for growth and improvement.
59 Changes in the structure and composition of public-sector employment during the crisis Antonio Montesinos, Javier J. Pérez and Roberto Ramos
Following a period of growth from 2007- 2011, public sector employment cuts, in part driven by fiscal consolidation efforts, brought employee levels back in line with pre-crisis levels. The reduction, however, was mainly achieved through job losses affecting staff on temporary contracts, while the number of open-ended contracts actually increased, posing future policy challenges related to the cyclical or structural nature of the policies implemented and also related
FEATURES
to securing an adequate provision of public services.
73 The consequences of graduating in a recession in Spain
Daniel Fernández Kranz and Núria Rodríguez Planas
Rigidities in Spain´s labour market appear to increase the negative impact on workers´
earnings for those entering the market in times of recession. While the much needed recent labour market reform in Spain has changed some important aspects of the Spanish labour market, it has done little to reduce segmentation, decreasing the likelihood of improving this situation for new entrants in Spain during the latest financial crisis.
83 Recent key developments in the area of Spanish financial regulation
Prepared by the Regulation and Research Department of the Spanish Confederation of Savings Banks (CECA)
87 Spanish economic forecasts panel: November 2015
FUNCAS Economic Trends and Statistics Department
93 KEY FACTS
Economic indicators
Financial system indicators
Deleveraging has been one of the most frequently used terms in reports on Spain in recent years. It is generally understood to be a rebalancing that demands short- term sacrifices but supports long-term growth and remains a necessary condition for the consolidation of the Spanish recovery. In this context, the November issue of Spanish Economic and Financial Outlook (SEFO) starts off by taking stock of progress on the deleveraging efforts of Spanish households and firms over recent years.
Spain is among the countries having made most progress on deleveraging since 2010, and efforts appear to be compatible with an increase in new lending flows and a gradual recovery of financial savings.
Between 2010 and June 2015, Spanish households and firms reduced their debt by 450 billion euros, or 37.5% of GDP. At the same time, while the rate of change of the stock of credit to the private sector remains negative, it has dropped from -5.3% in 2012 to -2.7% in August 2015.
Credit to SMEs stood at 146.6 billion euros in 2014, and is estimated at 159.8 billion euros by year-end 2015.
Moreover, financial savings has gone from negative values in almost all sectors before the crisis to an increase of up to 2% for the country as a whole in June 2015.
In this issue of SEFO, we also explore recent progress and outstanding challenges for the Spanish financial sector post-restructuring. The adjustment (restructuring, write-offs, public aid) undergone by the Spanish banking
sector in response to the crisis has allowed Spanish banks to become well positioned on the ranking of EU banking sectors in terms of profitability and efficiency. Spanish banks´ solvency levels have also improved and capital ratios are above Basel III minimum requirements, although below the EU average. At the same time, today´s low interest rate environment, together with increased capital requirements, continue to place downward pressures on banks´
profitability. To overcome these and other outstanding challenges, banks must further boost efficiency and adopt new business strategies reliant on increasing scale, international diversification, and on-line and mobile banking service provision.
The November SEFO then shifts its focus to the challenges of the Spanish corporate sector, such as the need for increased reliance on non-traditional funding sources, competitiveness challenges in the manufacturing sector, and finally, the internationalisation process of Spanish firms. We start by looking at the rise of non-bank financing alternatives for Spanish SMEs, pointing out important developments at the EU level to increase firms´ reliance on capital markets funding, such as the European Commission´s Action Plan on Building a Capital Markets Union (CMU).
In Spain, alternative financing channels
have deepened and now include equity
financing options, such as crowdfunding
or venture capital for smaller firms, as
well as alternative exchanges and private
Letter from the Editors
equity for larger-scale entities. On the debt side, non-bank financing alternatives include debt crowdfunding platforms for smaller firms, together with fixed-income exchanges, such as MARF for medium- sized companies. These alternatives are a necessary step forward and have encountered strong institutional support.
However, many obstacles remain, such as changing the mentality of SMEs towards alternative financing and the size constraints of European and Spanish SMEs.
We then study the process of internal devaluation across Spanish manufacturing firms, which reveals broad differences in competiveness of exporting firms relative to domestic- oriented players. As a result of rising unit labour costs during the economic expansion, Spanish manufacturing firms catering to the domestic market lost cost- competitiveness as they increased prices in order to protect profit margins. By contrast, the competitiveness of export- oriented industries, in terms of costs and products, progressed more favourably.
Consequently, Spanish exporters’ market share has done well relative to global exports. Falling wages during the crisis years could be driving manufacturing’s recent take-off, a necessary preconditions for generating a more sustainable growth model in Spain, although it is still too early for definitive conclusions.
Taking our analysis of Spain´s export industry a bit further, we consider the internationalisation of Spanish firms, focusing on the performance of Spanish exporters relative to other large EU economies, to find that Spanish businesses have internationalised substantially in recent years. However, they are still
a long way from securing net exports comparable to large European exporters, such as Germany, the Netherlands, or even Italy. Moreover, at the micro level, our findings shows exports to be concentrated, where 15% of large, frequent exporters account for 90% of Spain´s exports by volume, alluding to the existence of growth constraints experienced by many smaller export businesses.
Lastly, this SEFO examines issues related to public-sector employment trends and the characteristics of Spain´s labour market. Following a period of growth from 2007-2011, subsequent cuts in public-sector employment, in part driven by the need for fiscal consolidation, brought figures back in line with 2007 levels. The impact of the cuts, however, was mitigated by the general increase in the number of hours in the working week from 35 to 37.5. Staff reductions were mainly achieved through net job losses affecting temporary contracts, posing challenges for the future as regards the cyclical or structural nature of the policies implemented, and the provision of certain public goods and services.
On the topic of labour markets, according
to empirical evidence, workers who
enter inflexible labour markets, such as
those in Spain, during times of economic
recession fare worse than those who
enter more flexible ones. Moreover, while
Spain has recently completed a much-
needed labour market reform, not enough
has been done to reduce segmentation,
so it is likely that these negative effects
will still be applicable to the current
generation of individuals that graduated
during the recent financial crisis.
5
SEFO - Spanish Economic and Financial OutlookVol. 4, N.º 6 (November 2015)
Credit, deleveraging, and financial savings:
Balancing adjustment and recovery in Spain
Santiago Carbó Valverde
1and Francisco Rodríguez Fernández
2Spain is among the countries having made most progress on deleveraging since 2010. Debt reduction efforts are expected to be compatible with private sector credit growth and positive savings rates in 2016, in line with the trend for the Spanish economy as a whole since 2012.
The process of deleveraging in Spain has been compatible with an increase in new lending flows and a gradual recovery in financial savings. While the rate of change of the stock of credit remains negative, for the private sector as a whole, it has dropped from -5.3% in 2012 to -2.7% in August 2015. This transition was from -6.4% to -2.7% for firms and -3.8% to -2.6%
for households. In the case of new lending to firms, credit to SMEs stood at 146.6 billion euros in 2014, and it is estimated at 159.8 billion euros by year-end 2015. These readjustments have been compatible with the reduction of the debt burden, as shown by the evolution of the private sector loans-to-deposits ratio, a proxy for deleveraging, which was 1.14 in 2009, but has dropped in recent years to as low as 0.96. Between 2010 and June 2015, households and firms reduced their debt by 450 billion euros, or 37.5 percentage points of GDP. At the same time, financial savings has gone from negative values in almost all sectors before the crisis to an increase of up to 2% for the country as a whole in June 2015 (3.8% for households and 1.5% for firms).
1 Bangor Business School and FUNCAS.
2 University of Granada and FUNCAS.
Introduction: Deleveraging, savings, and long-term growth
There was a considerable build-up of private debt in the years preceding the crisis in Spain.
Leveraging continued up until 2010. Since then, households and firms have taken measures to reduce their debt considerably, albeit through different ways and with different intensities, and these efforts will continue for several more years.
However, although necessary, this deleveraging implies an opportunity cost in terms of the financial resources channelled away from consumption or investment. There is also a risk that it may compromise households’ financial savings, particularly when taking place at a time of high unemployment, as is the case in Spain.
In any event, as this article aims to show, a reduction in debt levels can be compatible with an increase in new lending flows and a gradual
Santiago Carbó Valverde and Francisco Rodríguez Fernández
6
SEFO - Spanish Economic and Financial OutlookVol. 4, N.º 6 (November 2015)
recovery in financial savings. For example, in Spain, households and firms are reducing high accumulated debt burdens without having to resort to measures, which could lead to reputational damage for the country, such as write-downs.
The problems associated with deleveraging are, however, not unique to Spain nor to this crisis.
In Spain, households and firms are reducing high accumulated debt burdens without having to resort to measures, which could lead to reputational damage for the country, such as write-downs.
Like other components of the economy, deleveraging has, at times, behaved cyclically.
A recent International Monetary Fund document (Chen et al., 2015), reviews experiences of debt reduction in 36 advanced economies since 1960.
It considers the impact of debt, both during the accumulation phase and when it is necessary to reduce it. The results suggest that a gradual deleveraging of the private sector after recessions is positively and significantly related to substantial medium and long-term GDP growth gains. Also, all the policies geared towards facilitating this effort tend to have a positive effect.
In countries such as the United States, at the peak of the crisis, some studies (Glick and Lansing, 2009) suggested that to reach a “reasonable” level of private debt, a ten-year adjustment would be necessary in which the savings rate would need to increase from 4% in 2009 to 10% in 2018. This savings would imply a reduction of 0.75% in the annual rate of consumption growth, which would hold back economic recovery, but would ensure more sustainable growth over the long-term.
However, when the United States began to emerge from the crisis, studies (Bauer and Nash, 2012) pointed out that although in theory, deleveraging
could have negative effects on consumption, U.S. households held back from increasing consumption significantly when they began to have more disposable income. This suggests that factors other than deleveraging, linked to expectations or the quality of employment, may also be important for the recovery.
Similar results have been observed in some European economies particularly affected by property crises and problems associated with debt levels. This is the case in Ireland, where McCarthy and McQuinn (2014) use mortgage data to show that households have difficulties meeting their payments in the wake of the crisis, which entails a significant reduction in consumption, although they also suggest positive effects over the long-term.
Financing conditions and credit
The ability to repay debt, save, or extend new credit largely depends on the macroeconomic situation and financial conditions (primarily the level of uncertainty and interest rates).
The recent press release from the Governing Council of the European Central Bank on October 22nd, 20153 stated that “while euro area domestic demand remains resilient, concerns over growth prospects in emerging markets and possible repercussions for the economy from developments in financial and commodity markets continue to signal downside risks to the outlook for growth and inflation.” The ECB went on to say that, although monetary policy was already quite loose, it would probably be necessary to re-examine this
“degree of accommodation” at the monetary policy meeting in December. Furthermore, according to the ECB, it “is willing and able to act by using all the instruments available within its mandate if warranted in order to maintain an appropriate degree of monetary accommodation.” The ECB estimates that inflation in the euro area will rise in 2016, but will remain short of the medium-term target of 2%.
3 https://www.ecb.europa.eu/press/pressconf/2015/html/is151022.en.html
Credit, deleveraging, and financial savings: Balancing adjustment and recovery in Spain
7
SEFO - Spanish Economic and Financial OutlookVol. 4, N.º 6 (November 2015)
This monetary context, however, implies relatively favourable lending conditions. Indeed, the ECB has observed that the year-on-year rate of change in lending to non-financial corporations (adjusted for sales and securitisations) in the euro area rose to 0.4% in August, following the figure of 0.3%
in July. However, the ECB acknowledges that
“despite these improvements, developments in loans to enterprises continue to reflect the lagged relationship with the business cycle, credit risk, credit supply factors, and the ongoing adjustment of financial and non-financial sector balance sheets.”
On the objective of completing the financial adjustments in the euro area (including deleveraging), the ECB was keen to point out that the monetary policy target is to maintain price stability, but that “in order to reap the full benefits from our monetary policy measures, other policy areas must contribute decisively [...] In particular, actions to improve the business environment.”
The improvement in costs and conditions of access to finance is also perceptible in Spain, as may be deduced from the latest “Encuesta de préstamos bancarios” [Bank loan survey]
published by the Bank of Spain in its October Economic Bulletin.4 This survey suggests that lending criteria were relaxed slightly in the case of lending to households to buy residential property in Spain for the first time since 2006, while they became slightly stricter in the euro area.
On the demand side, both national and euro area institutions reported an increase in the number of loan applications from households for home
Spanish banks stated that they used liquidity from the ECB programme mainly to extend credit, and to a lesser extent to substitute for other funding sources.
purchases, consumption and other purposes in the third quarter. Interestingly, Spanish financial
institutions stated that they perceived an improvement in conditions of access to both retail finance and wholesale markets. This was also perceptible in the euro area average. They also indicated that the ECB’s expanded asset purchase programme improved their financial situation over the last six months, with this effect being stronger in the case of Spanish institutions. By contrast, the impact on approval criteria in Spain was negligible. In any event, Spanish banks stated that they used the liquidity from the programme mainly to extend credit, and to a lesser extent to substitute for other funding sources.
Another significant factor in relation to financial conditions is the perception of the country’s solvency and stability, as expressed by the rating agencies. In October, Standard & Poor’s raised Spain’s rating a notch from ‘BBB’ to ‘BBB+’ with a stable outlook, and highlighted the “positive impact of the reforms on the economy.” On October 21st, Fitch published its “Fundamental Index” for Spain, which is a report on the state of credit and financial conditions. Fitch stressed the improvement in the supply and demand for credit, and above all, highlighted the flow of lending to SMEs (as will be discussed below). On October 23rd, Fitch affirmed Spain’s rating as “BBB+,” also with a stable outlook, pointing to an improvement in the country’s financing costs and, in general, a reduction in systemic risks.
As regards recent trends in credit in Spain, Exhibit 1 shows the year-on-year change in credit to the private sector from 2012 to August 2015. The rates remain negative, although for the sector as a whole the rate had dropped from 5.3% in 2012 to 2.7% in August 2015, 6.4% to 2.7% for firms and 3.8% to 2.6% for households. In any event, few analysts expect a return to positive figures before 2016.
Debt repayments still appear to be a bigger factor in the change in credit than new lending flows.
Even so, there has been a gradual recovery in new credit, as can be seen from Exhibit 2, which shows the progress since 2010 and an estimate
4 http://www.bde.es/bde/es/secciones/informes/boletines/Boletin_economic/
Santiago Carbó Valverde and Francisco Rodríguez Fernández
8
SEFO - Spanish Economic and Financial OutlookVol. 4, N.º 6 (November 2015)
for year-end 2015 (based on the flows observed up until September). In the case of domestic economies (left pane of the Exhibit), home loans rose from 26.8 billion euros in 2014 to 30.1 billion euros in 2015, while consumer credit rose from 16.4 billion euros to 18.8 billion euros over the same period. These figures suggest gradual
progress, but are still a long way short of the 69.5 and 23.1 billion euros of credit for housing and consumption, respectively, in 2010.
In the case of new lending to firms (right pane of Exhibit 2), credit to SMEs (using transactions valued less than one million euros as a proxy) came
69.5 37.5 32.3 21.8 26.8 30.1
23.1 14.1 12.8 13.9 16.4 18.8
0 10 20 30 40 50 60 70 80
Home loans Consumer credit Exhibit 2
Flow of new credit (Billion euros)
Source: Bank of Spain, the authors, and authors’ estimates for 2015.
210.3 174.1 145.9 134.4 146.6 159.8
454.7 353.4 338.9 258.2 210.6 233.5
0 50 100 150 200 250 300 350 400 450 500
Lending to SMEs Lending to large corporations
-5.3 -5.6
-4.1
-2.9 -2.7 -2.7
-6.4 -6
-4.3
-2.5 -2.6 -2.7
-3.8
-5.1
-3.7 -3.3
-2.8 -2.6
-7 -6 -5 -4 -3 -2 -1
0 2012 2013 2014 2015-March 2015-June 2015-August
Total Firms Households Exhibit 1
Year-on-year change in lending to the private sector (2012-2015) (Percentage)
Source: Bank of Spain and the authors’ calculations.
Credit, deleveraging, and financial savings: Balancing adjustment and recovery in Spain
9
SEFO - Spanish Economic and Financial OutlookVol. 4, N.º 6 (November 2015)
to 146.6 billion euros in 2014, and it is estimated that it will end 2015 at 159.8 billion euros. This figure still contrasts with the figure of 210.3 billion in 2010. In the case of large enterprises, new credit in 2014 came to 210.6 billion euros in 2014 and is expected to rise to 233.5 billion euros in 2015.
However, large enterprises seem to be making a bigger effort to pay down debt, as the volume of transactions in 2010 was 454.7 billion euros.
Both the flows and the cost of this private sector financing have improved. Thus, the Bank of Spain’s October Economic Bulletin reported that “interest rates on new credit to non-financial corporations fell in August compared to the previous month by 31 basis points (bp) in the case of transactions for a value of over a million euros (to 1.8%) and just 1 bp for smaller transactions (to 3.7%).”
Deleveraging effort
“Deleveraging” has been one of the most frequently used terms in reports on Spain in recent years. It is generally understood to be a necessary rebalancing
that demands short-term sacrifices but supports long-term growth. In a recent speech,5 the governor of the Bank of Spain said that “debt-to-GDP ratios of both non-financial corporations and households continued to moderate and are well below the peaks reached in 2010 during the previous cycle, thus narrowing the gap between Spain and the average debt-to-GDP ratios in the Economic and Monetary Union countries. For the euro area as a whole, the gradual improvement in aggregate credit has continued, with an increase, albeit moderate, in loans extended both to financial corporations and households. The ongoing relaxing of loan approval criteria is also perceptible across the euro area as a whole, except in the case of stricter criteria for home loans, due to the regulatory changes approved in a number of countries.”
An initial perspective is given by the household sector liquidity reference, for which bank deposits are a proxy. Deposits have behaved erratically since 2009, although since 2013 they have stabilised at around 750 billion euros, as against 704.1 billion euros in 2009 (Exhibit 3). What is most striking,
704.1 727.3 726.6 731.6 758.5 753.8 746
308.9 307.2 307.6 307.8 334.7 368.7 413.8
393.3 418.7 417.6 422.6 423.2 384.7 313.9
0 100 200 300 400 500 600 700 800
Total Demand Term Other Exhibit 3
Bank deposits: Trends by types (2009-2015) (Billion euros)
Source: Bank of Spain and the authors’ calculations.
5 VI Encuentro Financiero: “De la reestructuración a la transformación” [From restructuring to transformation] Expansión/
KPMG. October 20th, 2015, http://www.bde.es/f/webbde/GAP/Secciones/SalaPrensa/IntervencionesPublicas/Gobernador/Arc/
Fic/linde201015.pdf
Santiago Carbó Valverde and Francisco Rodríguez Fernández
10
SEFO - Spanish Economic and Financial OutlookVol. 4, N.º 6 (November 2015)
however, is the change in composition, as demand deposits have increased, while term deposits have declined. This is partly due to the competition between deposit-taking institutions, offering attractive demand deposit rates to capture liquidity.
Even though it is an imperfect indicator, one of the most commonly used measures to approximate
the private sector’s leverage is the loans-to- deposits ratio. Exhibit 4 shows how this ratio was above unity in 2009 (1.14) but dropped to 0.96 in subsequent years, mainly as a result of debt reduction efforts.
Just how much have households and firms reduced debt? Exhibit 5 shows the progress
1.14 1.13 1.14
1.10
1.02
0.97
0.96
0.85 0.90 0.95 1.00 1.05 1.10 1.15 1.20 Exhibit 4
Loans-to-deposits ratio (2009-2015)
Source: Bank of Spain and the authors’ calculations.
125 128.2 131.1 132.9 132.3 124.7 117.6 111.8 111.3 108.1
81.1 81.9 84 83.5 81.4 79.4 75.2 72.4 71.1 70.6
206.1 210 215.1 216.4 213.7 204.1 192.8 184.2 182.4 178.7
0 50 100 150 200 250
2007 2008 2009 2010 2011 2012 2013 2014 2015 Q1 2015 Q2 Firms Households Total private sector
Exhibit 5
Debt in the form of debt securities and loans (2007-2015) (Percentage)
Source: Bank of Spain and the authors’ calculations.
Credit, deleveraging, and financial savings: Balancing adjustment and recovery in Spain
11
SEFO - Spanish Economic and Financial OutlookVol. 4, N.º 6 (November 2015)
of debt in the form of debt securities and loans between 2007 and 2015. According to data from the Bank of Spain’s Financial Accounts of the Spanish Economy, this ratio represented 206.1%
of GDP for the private sector as a whole in 2007, rising to 216.4% in 2010, before dropping back to 178.7% in the second quarter of 2015.
Households’ debt-to-GDP ratio reached 83.5% in 2010, but had dropped to 70.6% in the second quarter of 2015. Firms’ leverage dropped from 132.9% to 108.1% of GDP over this same period.
At the current rate of deleveraging, the government estimates that the ratio of household debt to GDP will be in line with that in Germany and France in 2018, and that the outstanding mortgage lending balance will be half of current levels between 2020 and 2023.
Exhibit 6 summarises progress on deleveraging.
Between 2010 and June 2015, households and firms had reduced their debt by 450 billion euros,
or 37.5 percentage points of GDP (households by 160 billion euros and firms by 290 billion euros).
With this rate of deleveraging, in its monthly report for investors,6 the government estimates that the ratio of household debt to GDP will be in line with that in Germany and France in 2018, and that the outstanding mortgage lending balance will be half of current levels between 2020 and 2023.
Savings and financial wealth (2007-2015)
Under the financing and debt conditions described, how have the private sector’s financial saving progressed? The first part of the answer may be found in Exhibit 7, which shows the net financial transactions to GDP ratio, or net financial savings.
This rate has gone from negative values in almost all sectors before the crisis to an increase of up to 2% for the country as a whole in June 2015 (3.8%
for households and 1.5% for firms).
This trend is a result of several factors, such as improved market conditions (it is worth recalling that assets are valued at market prices in the
13.4
24.1
37.5
0 5 10 15 20 25 30 35 40
Households Firms Total private sector
%GDP Exhibit 6
Private sector deleveraging effort (2010-2015)
Source: Bank of Spain and the authors’ calculations.
6 http://www.thespanisheconomy.com/stfls/tse/ficheros/2014/151005_Kingdom_of_Spain.pdf 160
290
450
0 50 100 150 200 250 300 350 400 450 500
Households Firms Total private sector Billion euros
Santiago Carbó Valverde and Francisco Rodríguez Fernández
12
SEFO - Spanish Economic and Financial OutlookVol. 4, N.º 6 (November 2015)
financial accounts) and increased disposable income since 2013. Exhibit 8 can be used to examine what recent factors are encouraging improvements in net financial saving, among both households and firms. The exhibit shows the balance at the start and end of the second quarter of 2015. Despite an unfavourable quarter
for the market, with firms’ assets depreciating by 31,216 million euros and households’ assets losing 22,605 million euros, volume transactions grew by around 50 billion euros across the private sector as a whole, allowing households’ and firms’
financial balance sheets to remain over 2.06 trillion and 2.11 trillion euros in June 2015, respectively.
-9.2 -8.7
-3.9 -3.3 -2.9
0.1 2.2 1.6 2.0
-3.6
-1.5
3.5
1.9
2.9 3 3.7 3.5 3.8
-9.7
-4.9
1.8
3.1
1.6 0.7 3.4
1.9 1.5
-12 -10 -8 -6 -4 -2 0 2 4 6
2007 2008 2009 2010 2011 2012 2013 2014 2015 Q2
Economy Households Firms Exhibit 7
Net financial saving/GDP (2007-2015) (Percentage)
Source: Bank of Spain and the authors’ calculations.
2,058,491 28,229
-22,604
2,064,116
2,113,538 22,589
-31,216
2,104,911
Balance sheet at start of period Financial transactions Revaluations Balance sheet at end of period
Firms Households Exhibit 8
Link between the financial balance sheet at the start and end of 2015 Q2 (Million euros)
Source: Bank of Spain and the authors’ calculations.
Credit, deleveraging, and financial savings: Balancing adjustment and recovery in Spain
13
SEFO - Spanish Economic and Financial OutlookVol. 4, N.º 6 (November 2015)
In any event, more than the recovery in assets, what has improved the situation of the private sector has been firms’ debt reduction, as discussed above. In particular, in June 2015 households had
More than the recovery in assets, what has improved the net financial wealth of the private sector has been firms’ debt reduction.
achieved net financial wealth (financial assets less liabilities on their balance sheet) of 1.26 trillion euros, compared with 0.72 trillion in 2008.
In the case of firms, their net financial balance is negative given their higher debt level, but it has gone from -1.49 trillion in 2010 to -1.33 trillion in June 2015.
In short, the data presented here show that Spain’s deleveraging effort has been significant, and is compatible with a gradual recovery in new lending flows and financial saving. These are rebalancing mechanisms in which debt repayment still outweighs new lending, but all the
signs suggest that 2016 may be the year in which the tide turns and the opposite starts to be true.
References
Bauer, r. a., and B. J. Nash (2012), "Where Are Households in the Deleveraging Cycle?," Economy in Brief , Nº 12-01, Federal Reserve Bank of Richmond.
CheN, s.; MiNsuk, k.; Otte, M.; WiseMaN, k., and a.
ZdZieNiCka (2015), Private Sector Deleveraging and Growth Following Busts, WP/15/35, International Monetary Fund.
GliCk, r., and k. J. laNsiNG (2009), U.S. Household Deleveraging and Future Consumption Growth, FRBSF Economic Letter.
MCCarthy, y., and K. MCQuiNN (2014), Deleveraging in a highly indebted property market: Who does it and are there implications for household consumption?, Research Technical Paper 05/RT/14, Central Bank of Ireland.
-2,000,000 -1,500,000 -1,000,000 -500,000 0 500,000 1,000,000 1,500,000
2007 2008 2009 2010 2011 2012 2013 2014 2015 Q2
Households Firms Exhibit 9
Net financial wealth of households and firms (2007-2015) (Million euros)
Source: Bank of Spain and the authors’ calculations.
15
SEFO - Spanish Economic and Financial OutlookVol. 4, N.º 6 (November 2015)
Post-restructuring challenges for the Spanish banking sector
Joaquín Maudos
1In the wake of the crisis, Spanish banks have become more solvent and returned to profitability. However, unique macroeconomic conditions, especially the current low interest rate environment, together with increased capital requirements, will require further efforts to boost efficiency and reinvent business strategies to secure positive profits going forward.
The crisis had a severe negative impact on the Spanish banking sector. However, profitability has returned in 2013 and has since remained in positive territory, albeit constrained below pre-crisis levels in the context of the current low interest rate environment. As regards non- performing loans (NPLs), they have declined overall since their peak. Still, the concentration of bad loans related to construction and development, as well as the overall NPL rate in this sector, remains high. Finally, in line with more stringent new capital requirements, Spanish banks have improved their solvency indicators, with capital ratios for deposit-taking institutions that are above Basel III minimum requirements. On the downside, even though there have been significant reductions in employees and number of branches, Spanish banks have not been able to sufficiently increase efficiency indicators. Thus, despite notable progress post-crisis, today´s difficult climate requires further efficiency gains, together with the adoption of new business strategies reliant on increasing scale, internationalisation, and further expansion of on-line services in order to adapt to profitability challenges.
1 Professor of Economic Analysis at the University of Valencia, Deputy Director of Research at Ivie and collaborator with CUNEF. This article was written as part of the Ministry of Science and Innovation SEC213-43958-R and Generalitat Valenciana PROMETEOII/20147046 research projects.
Introduction
The imbalances accumulated in the Spanish banking sector in the pre-crisis expansionary period ultimately forced a profound restructuring and reorganization of the sector. Imbalances were so severe in parts of the banking sector that the Spanish government had to request financial
assistance from the European Union. The conditions established in the Memorandum of Understanding (MoU) accompanying the assistance programme have helped bolster the sector’s viability. The restructuring and the end of the recession have been the cornerstones of the sector’s return to profitability and its ability to extend credit. Moreover, having provisioned resources equivalent to 27% of GDP to
Joaquín Maudos
16
SEFO - Spanish Economic and Financial OutlookVol. 4, N.º 6 (November 2015)
writing-off asset impairment losses since the start of the crisis, profitability of Spanish banks is now on the rise, along with the growth rate of new lending.
At the same time, banks have made a significant effort to bring capitalisation levels in line with even the most demanding solvency requirements, as evidenced by the their successful performance on the ECB and EBA’s 2014 stress tests.
Nonetheless, in the wake of the financial crisis, the Spanish banking system still faces significant challenges for a number of reasons: i) the process of private sector deleveraging, although intense, is still incomplete, and is holding back the potential recovery in banking activity; ii) the current low interest rate environment is having a negative impact on net interest margins, limiting profitability;
iii) the potential to offset the drop in interest income with earnings from financial transactions has lost momentum (low interest rates are making it difficult to obtain capital gains – i.e., lower interest rates on public debt have made the carry trade less attractive); iv) new capital requirements call for more and better quality capital, and capital is difficult to attract as the current yield offered to investors is low; and finally, v) the large volume of non-performing assets still held on banks´
balance sheets is slowing the recovery in profits and the reactivation of credit.
In this context, it is difficult to raise profitability above the cost of capital, making efficiency gains and cost rationalisation more necessary than ever.
This is a challenging goal bearing in mind that, although the network of branches has been cut by 31% and jobs by 25%, it is proving difficult to reduce costs per unit of assets – they have even increased in 2014 and 2015. For this reason, efficiency gains have been hard to achieve and efficiency today is below pre-crisis levels.
On top of these difficulties, increased competition poses a no less important challenge. Competition is set to increase on two fronts: domestically, manifesting itself through a narrowing of the interest margin banks are charging on their loans as they try to win business; and, internationally,
deriving from progress on the banking union.
Implementing the two pillars of this union (the Single Supervisory Mechanism and the Resolution Mechanism), together with harmonisation of standards in the singe rule book, will bring about a more competitive marketplace.
Against this background, this article aims to analyse recent developments in the Spanish banking sector, over a period that captures both the impact of the crisis and the recovery, using the most recent data available, which refer to June 2015. Given the information available from the Bank of Spain, the analysis based on income statements (margins, profitability, efficiency, income structure, etc.) refers to deposit-taking institutions (business in Spain), while the rest of the analysis (activity, specialisation, capacity indicators, etc.) refers to credit institutions.
This article is subdivided into two sections: one analysing recent developments in the Spanish banking sector in terms of activity, specialisation, margins, profitability, liquidity, asset quality, solvency and efficiency; and another discussing the challenges facing the sector and the vulnerabilities it needs to overcome.
Recent developments in the Spanish banking sector
Activity and specialisation
Following the rapid growth during pre-crisis expansion, the crisis made a clear impact on the size of the Spanish banking sector’s balance sheet. After growing at an average annual rate of 14.6% between 2000 and 2007, the rate turned negative during the crisis (Table 1). Nevertheless, assets continued to grow until 2012, subsequently dropping by 17% to June 2015. Given the weight of residential private sector lending in the balance sheet, both its intense growth in the expansionary phase (growing by a factor of 3.3 between 2000 and 2008) and the subsequent plunge (a
Post-restructuring challenges for the Spanish banking sector
17
SEFO - Spanish Economic and Financial OutlookVol. 4, N.º 6 (November 2015)
a) Assets
Total assets Interbank lending Credit
to public sector
Credit to domestic resident sector
Credit to
non-residents Fixed
income Equity Others
assets
2000 1,133 145 31 559 96 139 75 87
2007 2,946 246 43 1,760 254 268 184 191
2008 3,224 263 53 1,870 253 326 172 287
2009 3,238 247 65 1,837 237 415 184 254
2010 3,252 234 79 1,844 230 384 180 301
2011 3,400 251 90 1,783 234 406 251 387
2012 3,423 279 114 1,605 232 509 258 426
2013 3,026 211 87 1,448 180 493 280 326
2014 2,913 155 101 1,380 169 492 262 353
2015 June 2,832 160 98 1,358 174 459 245 339
Annual growth
rate 2000-07 14.6% 7.8% 4.5% 17.8% 14.9% 9.9% 13.6% 11.9%
Annual growth
rate 2007-15 -0.53% -5.6% 11.6% -3.4% -4.9% 7.4% 3.9% 7.9%
b) Liabilities
Total liabilities shareholder’sand
equity
Interbank
deposits Public sector deposits
Domestic resident sector
deposits
Deposits from non-residents Debt
issued Shareholder’s
equity Others
2000 1,133 162 21 491 237 55 77 90
2007 2,946 269 75 1,323 442 426 175 237
2008 3,224 315 76 1,433 505 395 181 320
2009 3,238 305 82 1,427 507 434 190 294
2010 3,252 270 79 1,440 511 433 178 340
2011 3,400 373 70 1,373 492 435 220 439
2012 3,423 573 69 1,317 339 394 195 535
2013 3,026 381 63 1,314 306 297 233 430
2014 2,913 312 76 1,289 320 249 230 436
2015 June 2,832 317 76 1,276 314 227 225 396
Annual growth
rate 2000-07 14.6% 7.5% 20.1% 15.2% 9.3% 34.2% 12.4% 14.8%
Annual growth rate 2007-
June15 -0.53% 2.2% 0.1% -0.5% -4.5% -8.1% 3.4% 7.1%
Table 1
Spanish banking system balance sheet (credit institutions) (Billion euros)
Note: Average values for December of each year and the preceding year.
Source: Bank of Spain.
Joaquín Maudos
18
SEFO - Spanish Economic and Financial OutlookVol. 4, N.º 6 (November 2015)
contraction of 27% between 2008 and June 2015) explains how assets have evolved. Over time, the rate of decline has slowed, dropping to around 4%
in mid-2015. The crisis barely affected growth in fixed-income investments, such that they account for a much larger share of the balance sheet today (16%) than they did in 2007 (9%). This increase is
The crisis barely affected growth in fixed- income investments, such that they account for a much larger share of the balance sheet today (16%) than they did in 2007 (9%).
This increase is explained by investment in public debt, as it has more than tripled as a share of assets: from 2.9% in 2007 to 9.1%
in 2015.
explained by investment in public debt, as it has more than tripled as a share of assets: from 2.9%
in 2007 to 9.1% in 2015. Nevertheless, the current level is only slightly higher than that at the start
of the 2000s. In the case of equities, their share of total assets is currently higher (8.7%) than it was before the crisis in 2007 (6.2%).
On the liabilities side, other resident sector (ORS) deposits have suffered the impact of the crisis. After growing at a rate of 15.2% up until 2007, since the crisis, their average growth rate has been -0.5%. This evolution is similar to that of the balance sheet as a whole, such that their share of assets remains 45%. As a consequence of banks taking full advantage of ECB financing, interbank financing peaked at 17% of assets in 2012, although it had slipped back to 11.2% in June 2015. Market issuance of debt grew strongly between 2000 and 2007, given the shortage of deposits to finance such rapid credit growth, such that it went from representing 4.8% of assets in 2000 to 15% in 2007. The difficulties accessing wholesale markets during the crisis had reduced this share to 8% in June 2015. Finally, the crisis caused own funds to shrink in relative terms to a minimum of 5.4% in 2010. However, the new regulatory requirements had obliged institutions to bring them up to 8% in the summer of 2015.
0%
10%
20%
30%
40%
50%
60%
70%
80%
90%
100%
2000 2001 2002 2003 2004 2005 2006 2007 2008 2009 2010 2011 2012 2013 2014 2015 June Construction Development Home purchases Others
Exhibit 1
Percentage distribution of credit to ORS (credit institutions)
Source: Bank of Spain.
0%
10%
20%
30%
40%
50%
60%
70%
80%
90%
100%
2000 2001 2002 2003 2004 2005 2006 2007 2008 2009 2010 2011 2012 2013 2014 2015 June Construction Development Home purchases Others
Post-restructuring challenges for the Spanish banking sector
19
SEFO - Spanish Economic and Financial OutlookVol. 4, N.º 6 (November 2015)
The composition of credit, the most significant variable concerning banks’ assets, changed substantially throughout the crisis relative to the years of expansion. As Exhibit 1 shows, lending to
Given that defaults have risen exponentially in the construction and property development sector, the biggest decline in credit has been in these two sectors, their total share of credit having halved.
construction and property development activities peaked at 27% in 2007. Considering lending for housing purchases as well, the construction and
property sector as a whole came to account for 61% of lending. This lending has subsequently declined, dropping to 13.6% and 55%, respectively, in June 2015. Given that, as we shall see, defaults have risen exponentially in the construction and property development sector, the biggest decline in credit has been in these two sectors, their total share of credit having halved.
Margins and profitability
The crisis has adversely affected the quality and value of banks’ assets, necessitating massive write-offs. Between 2008 and June 2015, the Spanish banking system devoted 282 billion euros of net margin to provisions, to cover both financial (206 billion) and non-financial assets (76 billion).
2000 2007 2008 2009 2010 2011 2012 2013 2014 2015 June*
Financial revenues 4.57 4.32 4.78 3.32 2.47 2.64 2.47 2.12 1.94 1.79
Financial costs 2.77 3.10 3.59 1.93 1.37 1.71 1.47 1.25 0.98 0.80
NET INTEREST INCOME 1.80 1.22 1.19 1.38 1.10 0.93 1.01 0.87 0.96 0.99 Non-interest income 1.19 1.25 1.05 0.79 0.93 0.87 0.82 0.94 1.00 0.96
Dividends 0.38 0.43 0.41 0.25 0.39 0.41 0.46 0.29 0.35 0.31
Net commissions 0.71 0.52 0.44 0.39 0.38 0.37 0.35 0.36 0.40 0.41
Trading gains 0.04 0.24 0.16 0.11 0.14 0.10 0.10 0.32 0.31 0.26
Other net income 0.06 0.07 0.04 0.04 0.03 -0.01 -0.08 -0.03 -0.05 -0.01 TOTAL OPERATING INCOME 2.99 2.48 2.24 2.17 2.03 1.79 1.83 1.81 1.96 1.95 Operating expenses 1.88 1.07 0.99 0.95 0.94 0.89 0.83 0.87 0.92 0.94
NET INCOME 1.11 1.41 1.24 1.23 1.09 0.90 1.00 0.94 1.04 1.00
Net provisions 0.30 0.06 0.11 0.04 0.13 0.06 0.20 0.07 0.07 0.07
Loan loss provisions 0.21 0.31 0.51 0.63 0.54 0.71 2.54 0.71 0.51 0.48 OPERATING PROFIT 0.60 1.05 0.61 0.55 0.42 0.13 -1.73 0.16 0.46 0.46 Non-financial assets loss provisions 0.00 0.05 0.03 0.24 0.17 0.68 1.03 0.13 0.05 0.07
Other income 0.37 0.11 0.10 0.15 0.06 0.00 0.08 0.11 0.06 0.07
PROFIT BEFORE TAXES 0.96 1.12 0.69 0.46 0.32 -0.55 -2.68 0.14 0.46 0.45 Net attributable income 0.81 0.96 0.62 0.42 0.31 -0.46 -0.69 -0.15 0.06 0.09 Table 2
Spanish banking system income statement (deposit-taking institutions) (Percentage of Average Total Assets)
Note: * Last 12 months.
Source: Bank of Spain.
Joaquín Maudos
20
SEFO - Spanish Economic and Financial OutlookVol. 4, N.º 6 (November 2015)
The Royal Decrees enacted in February and May 2012 required intense restructuring of banks’
property exposure, with provisions consequently coming to 356% of net margin that year, resulting in banks´ generating losses, with an ROA of -2.7%
and ROE of -42.7%. Banks also recorded losses in 2011, with write-offs equivalent to 155% of net margin.
Between 2008 and June 2015, the Spanish banking system devoted 282 billion euros of net margin to provisions, to cover both financial (206 billion) and non-financial assets (76 billion).
2013 was a turning point for banks’ profitability, as the Spanish economy emerged from recession in the second half of the year. After the restructuring of property exposure in 2013, the year ended with pre-tax profit of 4.2 billion euros – a profit of 0.14%
in terms of assets, and 2.01% in terms of equity.
The recovery in profits continued in 2014, with
ROA of 0.46% and ROE of 6.01%. Up through the first half of 2015 (last 12 months) returns remained at 2014 levels, specifically 0.45% in terms of ROA and 5.86% in terms of ROE. These levels, however, are far from those reached prior the crisis in 2007:
ROA of 1.13% and ROE of 20.2%.
The drop in money markets’ benchmark interest rates to record lows makes it difficult to make profits, as this squeezes net interest margins.
Net interest income (as a percentage of assets) has halved since the early 2000s and is currently down almost 20% on its pre-crisis level in 2007.
Nevertheless, the bigger drop in expenses than financial income in 2014 and in the first half of 2015 has allowed margins to recover slightly, and they are currently 0.99%.
Gross profit margins fell by 21% as a percentage of assets after 2007, but have been growing since 2011. Banks reacted to the drop in net interest income by increasing their income from fees and financial transactions. Fees rose between 2014 and 2015 to represent 0.41% of assets, and income from financial transactions tripled its
-3.00 -2.50 -2.00 -1.50 -1.00 -0.50 0.00 0.50 1.00 1.50
-50 -40 -30 -20 -10 0 10 20 30
2007 2008 2009 2010 2011 2012 2013 2014 2015
June*
ROE ROA (r.h.s.) Exhibit 2
Profitability of Spanish banking system (deposit-taking institutions) (Percentages)
Note: * Last 12 months.
Source: Bank of Spain.
Post-restructuring challenges for the Spanish banking sector
21
SEFO - Spanish Economic and Financial OutlookVol. 4, N.º 6 (November 2015)
share relative to its value in 2011 and 2012, with a value equivalent to 0.26% of assets in June 2015.
Without these non-recurrent revenues, Spanish banks’ current profits would be halved.
Banks reacted to the drop in net interest income by increasing their income from fees and financial transactions. Without these non- recurrent revenues, Spanish banks’ current profits would be halved.
Liquidity gap
During the credit boom, the Spanish banking system accumulated a widening liquidity gap.
However, the subsequent slump in credit has largely corrected it. Thus, the private sector loans- to-deposits ratio increased from 1.4 in 2000 to 1.7 in 2007, with the liquidity gap widening from a value equivalent to 13.8% of assets in 2000 to 25.4% in 2007 (Exhibit 4). In June 2015, it was below its 2000 level at 1.2, equivalent to 7.6% of
assets. The gap, as a percentage of assets, is currently at a record low.
The reversal of the liquidity gap was not a consequence of a recovery in deposits, but rather of a collapse in credit. Thus, whereas between 2007 and June 2015, deposits increased by 13%, credit contracted by 23%. The biggest correction of the gap took place after 2011, and particularly in 2013, as in this year alone it shrank by 38%
(165 billion euros).
Spain´s reliance on Eurosystem financing peaked in August 2012, when Spain requested financial assistance from the European Union at the height of tensions, accounting for 34%
of ECB gross total lending. Dependence has dropped by a third, but still represents a large share of Eurosystem funding (26%).
The problems accessing wholesale markets when the crisis broke out, further exacerbated