Spanish Economic and Financial OutlookVolume 6 ♦ Number 4
Volume 6 ♦ Number 4
2017
SEF O
Spanish Economic and Financial Outlook
July 2017
The fiscal outlook in Spain: Gradual consolidation
17
Spanish economic growth exceeds expectations, but persistent debt burden poses risksRaymond Torres and María Jesús Fernández
85
Shadow banking:Spain in the global context
Santiago Carbó Valverde and Francisco Rodríguez Fernández
43
Spain’s 2017 Budget:Lacking reforms to meet the deficit target Ana Aguerrea and Susana Borraz, A.F.I.
33
Spain’s fiscal consolidation path:Slow but steady Santiago Lago-Peñas
55
Spanish private debt dynamics:Indebtedness and debt service in a European context Joaquín Maudos
93
Recent key developments in the area of Spanish financial regulationPrepared by the Regulation and Research Department of the Spanish Confederation of Savings Banks (CECA)
79
Spain’s banking and insurance sectors:A contrasting story Daniel Manzano, A.F.I.
Orders and information:
Funcas
Caballero de Gracia, 28 28013 Madrid
Spain
Phone: 91 596 54 81 Fax: 91 596 57 96 [email protected] www.funcas.es
97
Spanish economic forecasts panel: July 2017 Funcas Economic Trends and Statistics Department07
Eurozone forecasts 2017-2018:Recovery gains momentum but with worrisome country disparities
Raymond Torres and Patricia Stupariu
67
Wage moderation in Spain’s economic recovery Daniel Fernández KranzCubierta Sefo 6-4con cambios.indd 1 19/07/2017 13:55:30
Editorial
Board of Editors Carlos Ocaña Santiago Carbó José Félix Sanz Raymond Torres
Managing Editors Alice B. Faibishenko Juan Núñez-Gallego Board of Trustees Isidro Fainé Casas (Presidente)
José María Méndez Álvarez-Cedrón (Vicepresidente) Fernando Conlledo Lantero (Secretario)
Miguel Ángel Escotet Álvarez Amado Franco Lahoz Manuel Menéndez Menéndez Pedro Antonio Merino García Antonio Pulido Gutiérrez Victorio Valle Sánchez Gregorio Villalabeitia Galarraga
Contact [email protected] Web Site www.funcas.es Orders or claims:
Funcas, publications
Tel.; +34-91-5965481, Fax: +34-91-5965796, e-mail: [email protected] Electronic edition
An electronic edition of this journal its available at
http://www.funcas.es/Publicaciones/Index.aspx?Id=47&ddg=0 Printed in Spain
Editorial and Production Funcas
Caballero de Gracia, 28. 28013 Madrid (Spain) Ownership and Copyright:
© Funcas 2012
ISSN print edition 2254-3899 ISSN electronic edition 2254-3880 Depósito Legal: M-10678-2012 Prints: Cecabank.
Cubierta Sefo 6-4con cambios.indd 2 19/07/2017 13:55:30
07 Eurozone forecasts 2017-2018:
Recovery gains momentum but with worrisome country disparities
Raymond Torres and Patricia Stupariu The eurozone recovery gains traction.
However, cross country divergence is becoming more pronounced, weakening the sustainability of the single currency in the absence of a banking union and the establishment of a European fiscal capacity to respond to shocks.
17 Spanish economic growth exceeds expectations, but persistent debt burden poses risks
Raymond Torres and María Jesús Fernández Spain’s economic growth this year is exceeding expectations and the outlook for next year remains positive. To maintain this momentum, domestic issues, such as over-indebtedness and high long-term unemployment levels, must still be tackled in parallel to the reinforcement of the eurozone’s institutional framework.
33 Spain’s fiscal consolidation path:
Slow but steady Santiago Lago-Peñas
After several upward revisions to original targets, the Spanish general government complied with EU deficit targets for 2016.
Analysts are largely optimistic that the 2017 targets will be met, but not without challenges.
43 Spain’s 2017 Budget: Lacking reforms to meet the deficit target
Ana Aguerrea and Susana Borraz, A.F.I.
Even though the State looks set to have a hard time meeting ambitious deficit targets
this year, the expected overall overshoot is likely to be small, thanks to positive contributions once again from the anticipated surplus at the local administration level.
However, risks from possible one-offs could increase slippage above current projections.
55 Spanish private debt dynamics:
Indebtedness and debt service in a European context
Joaquín Maudos
The deleveraging efforts of Spanish households and corporates has helped to bring down debt levels as a percent of GDP, as well as the debt servicing burden – both in absolute terms and compared to other EU countries. Ongoing deleveraging efforts, together with the persistence of benign funding conditions, will be needed to further bring down debt ratios and reduce financial vulnerability.
67 Wage moderation in Spain’s economic recovery
Daniel Fernández Kranz
Following a period of severe job destruction throughout the crisis years, since 2014, the Spanish economy has maintained a consistent pace of job creation. Nevertheless, the Spanish job market remains characterized by a high level of unemployment and substantial wage moderation, particularly in the case of young, first time workers.
79 Spain’s banking and insurance sectors: A contrasting story Daniel Manzano, A.F.I.
Both the Spanish banking and insurance sectors have seen a major improvement in solvency over the last decade. In terms of profitability, however, the insurance sector has held up reasonably well, while banks
have struggled in recent years to generate profits above their cost of capital.
85 Shadow banking: Spain in the global context
Santiago Carbó Valverde and Francisco Rodríguez Fernández
The scale of shadow banking in Spain remains limited and has traditionally been contained by regulation and supervision.
However, the proliferation of non-bank operators in the euro area, and the potential for contagion and systemic risk, requires constant surveillance.
93 Recent key developments in the area of Spanish financial regulation
Prepared by the Regulation and Research Department of the Spanish Confederation of Savings Banks (CECA)
97 Spanish economic forecasts panel: July 2017
Funcas Economic Trends and Statistics Department
103 KEY FACTS
Economic indicators
Financial system indicators
We initiate this month’s SEFO with the first time ever publication of Funcas’
eurozone forecasts. The eurozone economy has improved significantly.
Recent indicators point to a recovery in both domestic demand and exports.
This is due to the continuation of the low interest rate environment, stemming from ultra-expansive ECB policy, the recovery in international markets and increased optimism among consumers and companies. Funcas’ projections are for GDP growth of 2% this year and 1.9%
in 2018, making a significant dent in the unemployment rate. Even so, by 2018 the economy is still likely to be 1.7 million jobs short of the pre-crisis employment situation. Furthermore, there continues to be significant divergence across eurozone economies, weakening the sustainability of the single currency.
Spain continues to be one of the fastest growing European economies. Spain’s economic growth in 2017 is exceeding expectations and the outlook for next year remains positive. Stronger exports are supported by the global recovery and the favourable competitive position of Spanish firms, while the slowdown in domestic demand is proving milder than initially foreseen. In short, the economy, which had lost steam in the second half of 2016, is gathering momentum once
again. Growth is forecast at 3.2% in 2017 and 2.8% in 2018.
Nevertheless, the legacy of the crisis still weighs down on overall results, the main risks to the recovery being the stock of public debt and long-term unemployment.
Public debt is expected to reach 98.1%
of GDP in 2017 – high in comparison with other European countries and almost three times the pre-crisis level.
And although the drop in unemployment keeps accelerating, reforms are needed to address outstanding labour market issues. It will be crucial to tackle these two main weaknesses, and in parallel reinforce the eurozone’s institutional framework, before the ECB scales down its exceptional arsenal of stimulus measures.
In this context, the July SEFO provides an assessment of the outlook for fiscal consolidation in Spain. Following several upward revisions, the Spanish government closed 2016 with a public deficit of 4.3% of GDP,
1or below the 4.6% of GDP official objective. Target compliance was achieved with the help of the surplus recorded at the local government level, which compensated for slippage by Social Security and the slowdown in consolidation at the central government level.
1 Excluding aid to the financial system.
Most analysts believe Spain will come close to reaching the deficit target of 3.1% of GDP for this year. Optimism is underpinned by the growth outlook, together with scope for additional discretionary spending cuts in the event of 2017 targets coming under pressure.
However, as evidenced by the latest (April) version of the 2017-2020 Stability Plan: i) the consolidation effort will come 80% from expenditure adjustment and 20% from revenues; ii) progress remains systematically slow and the current level of structural deficit needs to be further reduced; and, iii) spending cuts must be taken carefully to avoid a scenario where the quality of Spain’s public services falls below that of its peers.
Furthermore, the 2017 budget reveals a dependence primarily on favourable cyclical developments. The strong performance of tax revenues in the first part of the year, together with stagnation in discretionary departmental spending, bode well for a significant reduction in the deficit, bringing it mostly in line with the official target for this year.
However, the lack of substantive reforms foreshadows difficulties in fully delivering on deficit targets over the longer-term.
While the public sector strives to reign in deficit and debt ratios, the private sector has made notable progress on reducing its outstanding debt burden. The significant deleveraging effort by Spanish households and companies since 2010 has successfully reduced the weight of debt in GDP by 50 percentage points (pp), allowing for a reduction of the gap relative to the eurozone average to 3.4pp, albeit remaining 13.4pp above the average for the EU-28. Deleveraging, together with an improvement in corporate earnings and
household gross income, has significantly improvement debt sustainability. The combination of deleveraging, rebounding profitability and lower funding costs has also helped bring about a reduction in debt servicing costs for Spanish households and firms. Consolidation of the current economic recovery and a continuation of existing benign financing conditions are crucial prerequisites for the continued reduction in financial vulnerability.
The July SEFO also analyses progress on tackling Spain’s other main outstanding risk – shortcomings of the labour market.
The Spanish labour market is gradually emerging from the crisis, with over half of the jobs destroyed having been recovered.
The new jobs created since 2014, however, are substantially different from those of the pre-crisis period. In general, the Spanish labour market is paying less than it used to for the same kind of work.
This wage moderation reflects the new labour market conditions, where most of the burden is being shouldered by those workers who had to change jobs and young people just joining the labour market.
Finally, as regards developments in the
financial sector, we explore the contrast
in the performance of Spanish banks
versus insurers. The recent crisis has
significantly altered the behaviour and
relative positioning of Spanish insurance
companies and banks. The former have
performed much more strongly, reducing
the gap to the banking sector in terms of
size, solvency and profitability. Meanwhile,
both sectors have substantially improved
their solvency levels at the cost of lower
returns to shareholders. But there is
a noteworthy difference: insurance
companies are sustaining double-digit
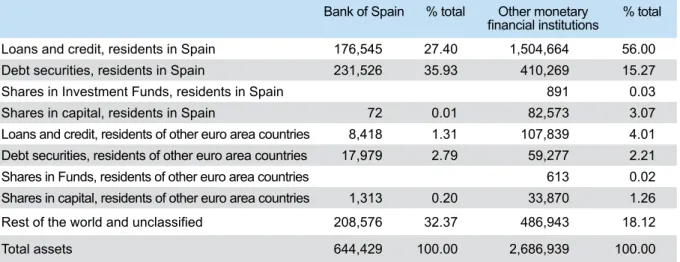
Also, we assess developments in shadow banking. In Spain, shadow banking scarcely accounts for 0.7% of the global total. Even so, the combined non-banking sector managed 1.34 trillion euros in assets in 2016, a decline from 1.53 billion euros in 2010 – primarily because of a downturn in securitisation fund assets.
However, growth in shadow banking in the euro area and potential contagion risks make it an issue worth monitoring.
To this end, regulatory and supervisory
authorities coordinate internationally to
try to reduce contagion from a business
that continues to experience rapid growth.
7
SEFO - Spanish Economic and Financial OutlookVol. 6, N.º 4 (July 2017)
momentum but with worrisome country disparities
Raymond Torres and Patricia Stupariu
1The eurozone recovery gains traction. However, cross country divergence is becoming more pronounced, weakening the sustainability of the single currency in the absence of a banking union and the establishment of a European fiscal capacity to respond to shocks.
The eurozone economy has improved significantly. Recent indicators point to a recovery in both domestic demand and exports. This is due to the continuation of the low interest rate environment, stemming from ultra-expansive ECB policy, the recovery in international markets and increased optimism among consumers and companies. Funcas’ projections are for GDP growth of 2% this year and 1.9% in 2018, making a significant dent in the unemployment rate. Even so, by 2018 the economy is still likely to be 1.7 million jobs short of the pre-crisis employment situation. Furthermore, there continues to be significant divergence across eurozone economies, weakening the sustainability of the single currency.
1 Funcas.
Recent developments in the eurozone
The eurozone economic recovery has accelerated since the start of the year. Activity and consumer confidence indicators have spiked, slightly outperforming pre-crisis levels (Exhibit 1).
Meanwhile, international trade flows both within the eurozone and with third countries have increased, in line with the recovery in global markets. GDP grew by 0.6% in the first quarter and 1.9% relative the same quarter of 2016 (Table 1). All countries in the single currency saw a pick-up in growth compared to the last quarter of 2016.
The improvement in the economy is being reflected in the labour market. The unemployment rate has now declined for 38 consecutive months and
has fallen decisively over the last year. However, the unemployment rate remains elevated, at 9.3%.
Wage income has barely risen in real terms.
This is taking place in the absence of a deterioration in internal or external imbalances.
Increasing energy prices have trickled through to headline inflation. However, core inflation (excluding energy and other volatile components) remains around 1%, well below the ECB target.
The current account continues to sustain a significant surplus, which amounted to 3.3% of euro area GDP in 2016, the highest since the creation of the Euro.
Finally, the public deficit is on a clear downward trend. In 2016, the aggregate public sector deficit
Raymond Torres and Patricia Stupariu
8
SEFO - Spanish Economic and Financial OutlookVol. 6, N.º 4 (July 2017)
Average 2008-2015 2016 2017 (Q1) [a]
Eurozone-19 0.2 1.8 1.9
Austria 0.6 1.5 1.9
Belgium 0.8 1.2 1.6
Cyprus -0.7 2.8 3.3
Estonia 0.0 1.6 4.0
Finland -0.6 1.9 2.6
France 0.5 1.2 1.1
Germany 1.0 1.9 1.7
Greece -3.7 0 0.4
Ireland 3.5 5.2 6.6
Italy -1.0 0.9 1.2
Latvia -0.5 2 4.0
Lithuania 1.0 2.3 4.1
Luxembourg 1.9 4.2 3.3
Malta 3.5 5 4.0
Netherlands 0.4 2.2 2.5
Portugal -0.7 1.4 2.8
Slovakia 2.2 3.3 3.1
Slovenia -0.1 2.5 5.0
Spain -0.4 3.2 3.0
Table 1
Annual GDP growth rates
Note: [a] Growth with respect to Q12016;seasonally adjusted data (except Slovakia).
Source: Eurostat.
-40 -35 -30 -25 -20 -15 -10 -5 0
50 60 70 80 90 100 110 120
Jan 2007 May 2007 Sep 2007 Jan 2008 May 2008 Sep 2008 Jan 2009 May 2009 Sep 2009 Jan 2010 May 2010 Sep 2010 Jan 2011 May 2011 Sep 2011 Jan 2012 May 2012 Sep 2012 Jan 2013 May 2013 Sep 2013 Jan 2014 May 2014 Sep 2014 Jan 2015 May 2015 Sep 2015 Jan 2016 May 2016 Sep 2016 Jan 2017 May 2017
Economic sentiment, SCA (left axis) Consumer confidence indicator (right axis) Exhibit 1
Eurozone confidence indicators
Source: Eurostat.
9
SEFO - Spanish Economic and Financial OutlookVol. 6, N.º 4 (July 2017)
stood at 1.5% of GDP, 0.6 percentage points below the previous year and the second lowest on record (the minimum was in 2007). Public sector deficits fell across all eurozone economies in 2016, except for Austria and Belgium who nonetheless kept their deficits under control. Nine countries posted a surplus (Germany, Estonia, Greece, Cyprus, Latvia, Lithuania, Luxembourg, Malta and the Netherlands).
Forecasts for 2017 and 2018
This state of play is set to remain in place for the rest of year, enabling GDP to grow by 2% in 2017, that is 0.2 percentage points more than last year (Table 2). Private consumption will ease slightly due to the impact of the pick up in inflation on household disposable income. Public sector
consumption and investment will remain in positive territory, meaning that budgetary constraints have come to an end for most countries.
Investment ‒ both capital goods and residential ‒ will sustain growth rates of around 4%, supported by cheap credit conditions, rising company operating surpluses, deleveraging among non- financial enterprises and the improved overall economic outlook. Altogether, domestic demand will slightly reduce its contribution to GDP growth.
Imports look set to rebound due to euro appreciation and robust domestic demand. However, exports will benefit from the recovery in world trade and the strong position of many European companies in new technologies, facilitating a larger external contribution to growth.
Actual data Funcas
Forecasts Average 2001-2007 Average 2008-2015 2016 2017 2018 1. GDP and aggregates, constant prices
Gross Domestic Product 2.0 0.2 1.8 2.0 1.9
Final consumption 1.7 0.3 1.9 1.6 1.5
Public consumption 1.9 0.9 1.9 1.4 1.4
Household consumption 1.6 0.1 2.0 1.7 1.5
Gross fixed capital formation 2.5 -1.5 3.7 3.9 3.4
Domestic demand [a] 1.8 -0.2 2.1 2.0 1.8
External balance [a] 0.1 0.4 -0.3 0.0 0.1
2. Inflation, employment and unemployment
Consumer price deflator 2.3 1.2 0.5 1.5 1.2
Total employment 1.1 -0.1 1.3 1.5 1.4
Unemployment rate 8.6 10.4 10.0 9.2 8.5
Productivity (GDP per employed person) 0.9 0.3 0.5 0.5 0.5
Compensation per employee 2.5 1.9 1.6 1.8 1.5
3. Financial balances (% GDP)
Current account balance with rest of the world 0.2 1.0 3.3 2.9 2.9
General government deficit -2.3 -3.8 -1.5 -1.3 -1.1
General government debt 67.4 85.0 89 88 87
Table 2
Funcas Eurozone Economic Forecasts, 2017-2018 (Annual percent change)
Note: [a] Contribution to GDP growth.
Source: Funcas.
Raymond Torres and Patricia Stupariu
10
SEFO - Spanish Economic and Financial OutlookVol. 6, N.º 4 (July 2017)
A modest slowdown is expected in 2018 on the back of a likely gradual hike in interest rates and the implications of this for investment ‒ especially residential ‒ and private consumption. The export boom will hold up, thereby making for a positive contribution from the external sector to economic growth.
Employment is set to fall significantly, in line with the acceleration in growth. 4.5 million jobs could be created over 2017-18, with the unemployment rate falling to 8.5%, its lowest since January 2009.
However, this will still be some 1.7 million jobs short of pre-crisis employment levels (Exhibit 2).
Energy prices are set to moderate under the assumption of stable oil prices (at around 50 dollars per barrel) and broadly unchanged euro exchange rates (around 1.10 dollars per euro). Headline consumer price inflation will rise to an annual average of 1.5% in 2017 and 1.2% in 2018. Both core inflation and wage costs will remain on a moderate path.
The current account will continue to post a significant surplus, albeit below previous years due to developments in international trade prices (deterioration in the terms of trade).
Export prices are likely to grow less quickly than import prices in 2017, due to the increase in oil and other commodity prices. The terms of trade should stabilise in 2018.
Finally, the public deficit is expected to fall, due to the mechanical effect of the recovery on both tax collection and public spending. Excluding these effects, no additional discretionary fiscal measures are envisaged for the eurozone as a whole. Overall, the reduction in the deficit will be insufficient to significantly lighten the public debt burden. This will still stand at around 90% of GDP over the next two years, up 25 percentage points relative to pre-crisis debt-to-GDP ratios. Thus, in the absence of measures to improve budget revenues, the room for fiscal manoeuvre will remain limited.
6 7 8 9 10 11 12 13
Difference 2007-2018:
1.7 million jobs Exhibit 2
Eurozone unemployment rate
(Observed 2000-2016) (forecasts 2017-2018)
Source: Eurostat and Funcas forecasts.
11
SEFO - Spanish Economic and Financial OutlookVol. 6, N.º 4 (July 2017)
Disparities remain sizeable across eurozone countries
Geopolitical risks have eased. The European political environment has settled in the aftermath of recent elections in various eurozone countries.
However, significant uncertainties remain regarding the United Kingdom’s exit from the European Union. Recent elections have only increased uncertainty around the pace of Brexit and its impact on European trade and investment flows.
At the same time, differences across eurozone countries have become more pronounced. Some
countries combine high levels of unemployment, low investment, poor competitiveness and significant indebtedness:
■The difference across unemployment rates has increased over the last ten years (Exhibit 3).
Some countries with high rates of unemployment have seen a notable improvement as a result of a vigorous recovery, but others have witnessed stagnation.
■The latest data point to a significant deterioration in competitiveness in several countries, such as Finland, Greece and Italy (Exhibit 4). The benchmark indicator for this analysis is the volume of goods and services exports as a proportion of the world total.
■Investment effort has improved over the course of the recovery, but is still below pre-crisis levels (Exhibit 5). In some countries, the investment rate is barely sufficient to maintain the existing productive capacity.
0 5 10 15 20 25
2017 2007 Exhibit 3
Unemployment rates
Note: 2017 data are monthy average up to May, except Belgium and Greece (March) and Estonia (April).
Source: Eurostat and Funcas.
Geopolitical risks and local political tensions
have eased, but differences across eurozone
countries have become more pronounced,
thus weakening the single currency.
Raymond Torres and Patricia Stupariu
12
SEFO - Spanish Economic and Financial OutlookVol. 6, N.º 4 (July 2017) -50
-40 -30 -20 -10 0 10 20 30 40 Exhibit 4
Change in market share of exports of goods and services (Difference between 2007 and 2017, in %)
Source: OECD.
0.00 0.05 0.10 0.15 0.20 0.25
0 5 10 15 20 25 30
2000 2001 2002 2003 2004 2005 2006 2007 2008 2009 2010 2011 2012 2013 2014 2015 2016 Eurozone unemployment rate VC (RHS)
Exhibit 5
Investment rate and country dispersion
Note: Dispersion between countries in the investment rate is measured using the coefficient of variation (ratio between standard deviation in each period and the period average).
Source: Eurostat and Funcas.
13
SEFO - Spanish Economic and Financial OutlookVol. 6, N.º 4 (July 2017)
■Empirical evidence and historical experience suggest that deleveraging processes can persist over time, pushing back the recovery. The high levels of debt in some eurozone countries are the result of large deficits recorded at the outbreak of the financial and real estate crises.
Corporate indebtedness remains elevated in absolute terms, though as a percentage of GDP it is now at similar or lower levels than before the crisis – except in Cyprus and Ireland (Exhibit 6).
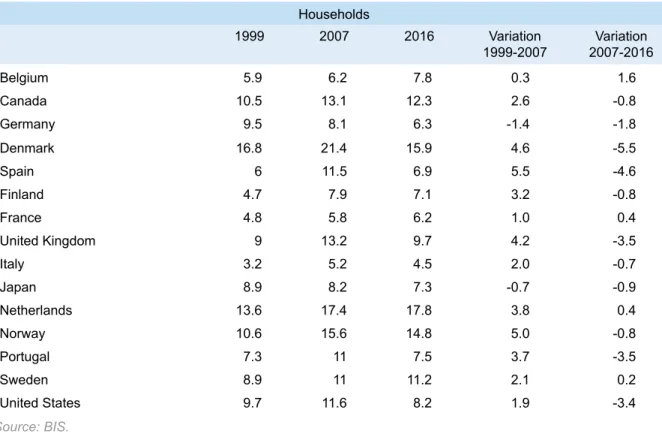
The same is true for household debt, albeit with significant differences across countries (Exhibit 7). Household debt to GDP is relatively restrained in most countries, but it is above pre- crisis levels in eleven of the nineteen eurozone countries. (Household debt is particularly high in Cyprus, the Netherlands, Portugal and Finland.) Public debt remains high (Exhibit 8) which poses a major challenge as interest rates begin to rise.
The situation makes it crucial for the current pace of economic growth to continue, and for new measures to be introduced with a view to boosting budget revenues and enhancing the quality of public spending.
These disparities weaken the sustainability of the common currency: unemployment is a barometer of a country’s capacity to remain within the eurozone both from an economic and social point of view; countries that face a continuous loss of competitiveness cannot sustain their growth model; investment measures the effort to improve productivity, employment and competitiveness and is essential to solidifying the integration of the single currency; finally, indebtedness is an indicator of financial vulnerability.
Implications for European public policy and for Spain
In the face of persistent divergences, it is essential for at-risk countries to sustain their reform effort.
But the functioning of the eurozone itself also needs to be reinforced. Urgent priorities include completing the banking union; ensuring that non- performing bank loans do not derail the recovery;
and, strengthening macroeconomic governance in the eurozone.
0 50 100 150 200 250
2015/2016** 2007 Exhibit 6
Debt of non-financial enterprises (As % of GDP)
Source: Eurostat.
Raymond Torres and Patricia Stupariu
14
SEFO - Spanish Economic and Financial OutlookVol. 6, N.º 4 (July 2017)
0 20 40 60 80 100 120 140
2007 2015/2016**
Exhibit 7
Household debt (As % of GDP)
Source: Eurostat.
0 20 40 60 80 100 120 140 160 180
2007 2016
Exhibit 8
General government debt (As a % of GDP)
Source: Eurostat.
15
SEFO - Spanish Economic and Financial OutlookVol. 6, N.º 4 (July 2017)
Some important steps have been made in terms of banking union. The Single Supervisory Mechanism (SSM) and the Single Resolution Mechanism (SRM) are now in operation, albeit with doubts regarding their effectiveness as demonstrated by the recent collapses of various European banks. A fund financed by banks has still to be fully in place, to respond to future bank crises. And the European deposit guarantee fund remains stuck in the pipeline. Moreover, bank portfolios lack sufficient diversification, leading to market fragmentation and hampering the flow of capital and investment.
Non-performing bank loans in various countries remain a source of concern. These portfolios are a reminder of the financial crisis, especially the recession years when bank balance sheets contracted and default rates soared, without being offset by an increase in profitable lending to the private sector. Once again, a sustainable economic recovery accompanied by income growth would help the servicing of outstanding debt and thus improve the quality of certain non- performing loans. Meanwhile, a concerted effort is needed at the European level to tackle the consequences of defaults and avoid contagion effects.
Spain continues to be one of the fastest growing European economies, but the legacy of the crisis still weighs down on overall results.
It would therefore benefit significantly from both domestic and eurozone reforms.
The debate on eurozone macroeconomic governance has intensified. A consensus is beginning to emerge on the limitations of existing instruments. Both the European Stability Mechanism (ESM) and the “European Semester”
are clearly inadequate to handle future recessions.
The creation of a European fund ‒ though not necessarily in the form of a new EU budget and treasury, which would raise significant political,
institutional and democratic challenges ‒ would be an important step in the right direction. Two possible alternatives are the creation of a pan- European unemployment insurance or a fund for investing in countries in crisis.
It is essential that the different options be assessed and rapid progress made towards reforming the architecture of the euro. The window of opportunity for measured action will shut as soon as monetary policy begins to normalise. ECB action (sovereign and corporate debt purchases and negative policy rates) is masking the eurozone’s unresolved structural weaknesses. But the monetary policy arsenal is set to be progressively reigned in over the next two years.
Finally, within the European context, Spain continues to be an outlier in terms of its strong growth momentum. It is one of the fastest growing economies and is expected to remain so in 2018.
Furthermore, convergence indicators are pointing in the right direction. Employment, exports, investment and the deficit are adjusting more significantly than in other countries.
However, the legacy of the crisis continues to weigh down on overall results. Unemployment and public sector debt levels remain the main source of vulnerability and necessitate new reforms to simultaneously lower these imbalances and improve the distribution of the fruits of the recovery.
Undoubtedly, reforms aimed at tackling job precariousness and improving the quality of education would go a long way to consolidating convergence with the eurozone core countries.
Meanwhile, further budgetary adjustment is contingent on greater revenue collection efforts.
But domestic reforms are not sufficient ‒ decisive action is also needed at the European level, which would be especially beneficial for Spain.
Banks are excessively exposed to national sovereign debt, which in certain circumstances
Raymond Torres and Patricia Stupariu
16
SEFO - Spanish Economic and Financial OutlookVol. 6, N.º 4 (July 2017)
could hamper their ability to finance the economy should the risk premium start to spike. Capital markets union would also facilitate the flow of savings and investment within the eurozone. This would be a welcome development for the Spanish economy, with its abundant supply of labour and relatively high rates of return. Finally, the creation of a European counter-cyclical instrument, such as unemployment insurance or an investment fund, would facilitate a quicker and less socially detrimental response to future recessions.
17
SEFO - Spanish Economic and Financial OutlookVol. 6, N.º 4 (July 2017)
but persistent debt burden poses risks
Raymond Torres and María Jesús Fernández
1Spain’s economic growth this year is exceeding expectations and the outlook for next year remains positive. To maintain this momentum, domestic issues, such as over-indebtedness and high long-term unemployment levels, must still be tackled in parallel to the reinforcement of the eurozone’s institutional framework.
The Spanish economy is performing better than expected. The latest indicators point to stronger exports, reflecting the recovery in world markets and the favourable competitive position of Spanish firms. In addition, the slowdown in domestic demand is proving milder than initially foreseen. Altogether, the economy should grow by 3.2% in 2017 and 2.8% in 2018. Despite the slow but steady progress on fiscal consolidation, the main risk to the recovery remains the stock of public debt – expected to reach 98.1% of GDP in 2017 – which is high in comparison with other European countries and almost three times the pre-crisis level. It is crucial to tackle this weakness before the ECB scales down its exceptional arsenal of stimulus measures.
1 Economic Trends and Statistics Department, Funcas.
International context
The global economy is showing signs of improvement. The US is expanding at a moderate pace despite certain doubts about the sustainability of this momentum and the announcement of trade restrictions. Japan, meanwhile, is emerging from its protracted episode of economic lethargy, thanks to Abenomics –a strategy set in motion by its Prime Minister, Shinzō Abe–, which combines monetary and fiscal stimuli with structural reforms.
Expectations have also improved in Europe.
Business and consumer confidence indicators have picked up, foreshadowing an uptick in activity in the quarters to come. The improvement
is partly attributable to the European Central Bank’s expansionary monetary policy (negative intervention rates coupled with purchases of up to 60 billion euros of public and corporate debt securities every month). The fiscal stimulus measures introduced in several countries with room for manoeuvre on the budget front have also contributed to the general improvement, as has the slight correction in oil prices.
In parallel, some of the risks that had presented themselves in emerging markets have dissipated.
The Chinese economy’s transition towards a growth model underpinned by satisfaction of domestic demand and less dependent on industrial goods exports is taking place gradually. Economic
Raymond Torres and María Jesús Fernández
18
SEFO - Spanish Economic and Financial OutlookVol. 6, N.º 4 (July 2017)
indicators are headed in the right direction in Latin America and parts of Africa, particularly in those countries which had fallen into recession, such as Brazil and Nigeria.
In addition, international trade, which had stagnated in recent years, has recovered.
According to the OECD, trade is expanding at an annual rate of 4.5%, which is virtually double the pace of the last two years. This trend is particularly important for the Spanish economy, which is increasingly dependent on exports.
All of this has prompted the IMF to revise its estimates upwards. Specifically, the IMF’s April forecasts (the most recent available), point to global GDP growth of 3.5% in 2017, up 0.4 percentage points from 2016 and up 0.1 percentage points from its January forecasts. For 2018, experts are predicting growth of 3.6%, unchanged with respect to the January forecasts. Those levels of growth are approaching the average growth rate observed between 1987 and 2007.
Counterbalancing these more optimistic forecasts are lingering sources of uncertainty. The eurozone’s institutional architecture remains a work in progress, undermining the ability of the European member states, particularly the more indebted ones, to tackle fresh turbulence. In addition, following the fall of several banks (most recently in Spain and Italy), doubts have arisen regarding the effectiveness of the European financial system’s supervisory mechanisms.
This situation only highlights the obstacles to achieving banking union in Europe. The European Central Bank is expected to gradually roll back its extraordinary monetary policy measures, a move which will undoubtedly evidence the eurozone’s weaknesses.
Elsewhere, certain emerging markets, such as Brazil and China, have sustained excessive growth in private sector lending which in some cases has fuelled real estate bubbles. New conflicts have arisen in oil producing nations, although
their impact on international markets has been limited to date. Lastly, significant political risks remain, including the uncertainty created by the UK’s exit from the European Union and the rise in protectionist threats in recent times.
Recent performance by the Spanish economy
GDP expanded by 0.8% in the first quarter of 2017, or at an annualised rate of 3.3%
(hereinafter, the quarter-on-quarter rates will be expressed in these terms), marking acceleration from the previous quarter. The year-on-year rate of growth was 3.0%. This performance was in line with expectations in light of the economic indicators released over the course of the quarter but was stronger than expected when the last set of forecasts was prepared, driven above all by a higher than forecast contribution by exports.
Domestic demand contributed 2.6 percentage points to the quarter-on-quarter rate of growth, while net exports contributed 0.7 percentage points, in both instances firming from the levels observed the previous quarter.
Growth in private consumption eased substantially in real terms in comparison with the last quarter of 2016 due to high inflation during the period; in nominal terms, growth was stable. At any rate, this component of demand has been trending lower, with ups and downs along the way, since the middle of 2015, as is clearly appreciable in the consumption indicators (Exhibits 1.1 and 1.2).
However, the most recent data for the second quarter suggest that the downtrend in this variable may have hit bottom; indeed, private consumption may even be rebounding, as a result of the healthy pace of job creation.
In the first quarter, public spending, meanwhile, recovered from the drop observed the previous quarter. This item is registering very low growth:
0.8% year-on-year in nominal terms.
19
SEFO - Spanish Economic and Financial OutlookVol. 6, N.º 4 (July 2017)
Investment in capital goods and intellectual property products registered a considerable rebound, higher than expected, possibly on account, at least partially, of the pushback of investment plans from the last quarter of 2016 due to the change in corporate income tax regulations in October, which increased corporate taxpayers’ payments on account unexpectedly, obliging them to postpone spending. It may also
be a reflection of the materialisation of investment plans postponed throughout 2016 due to political uncertainty. At any rate, the underlying factors substantiating the momentum in this variable are the recovery in corporate profitability driven by cost-competitiveness gains, healthier capital structures and the export boom. The second- quarter indicators released to date point to continued growth, albeit at a slower rate than Sources: Ministry of Industry, AEAT and Funcas.
Sources: European Commission, INE, AEAT and Funcas.
1.2 - Consumption Indicators (II)
Annualised moving quarterly change in % and index (CCI), smoothed series
1.4 - Capital goods GFCF indicators (II)
Annualised moving quarterly change in %, smoothed series
-48 -44 -40 -36 -32 -28 -24 -20 -16 -12 -8 -4 0 4
-16 -14 -12 -10-8-6 -4 -202468 10
2010 2011 2012 2013 2014 2015 2016 2017 Large company sales, consumer goods, deflated Overnight hotel stays, Spanish nationals Consumer Confidence Index (right scale)
-60 -50 -40 -30 -20 -10 0 10
2010 2011 2012 2013 2014 2015 2016 2017 Large company sales, capital goods, deflated Capital goods order book
-120 -80 -40 0 40 80
-15 -10 -5 0 5 10
2010 2011 2012 2013 2014 2015 2016 2017 Retail trade, deflated
Passenger car registrations (right scale)
Exhibit 1
Consumption and capital goods investment indicators
Sources: Ministry of Economy, INE, DGT and Funcas.
Sources: Ministry of Economy, Anfac and Funcas.
1.1 - Consumption Indicators (I)
Annualised moving quarterly change in %, smoothed series
1.3 - Capital goods GFCF indicators (I)
Annualised moving quarterly change in %, smoothed series
-60 -50 -40 -30 -20 -10 0 10 20 30 40 50
2010 2011 2012 2013 2014 2015 2016 2017 Availability of capital goods
Commercial vehicle registrations
Raymond Torres and María Jesús Fernández
20
SEFO - Spanish Economic and Financial OutlookVol. 6, N.º 4 (July 2017)
Exhibit 2
Industrial activity, services and construction indicators 2.1 - Industrial sector indicators (I)
Annualised moving quarterly change in % and index, smoothed series
2.2 - Industrial sector indicators (II)
Annualised moving quarterly change in % and index, smoothed series
15 20 25 30 35 40 45 50 55 60
-12 -10 -8 -6 -4 -2 0 2 4 6 8
2010 2011 2012 2013 2014 2015 2016 2017 Turnover in manufacturing, deflated Industrial production index (manufacturing) Manufacturing PMI (index, right scale)
-25 -20 -15 -10 -5 0 5 10
-10 -8 -6 -4 -2 0 2 4
2010 2011 2012 2013 2014 2015 2016 2017
Social Security affiliates, Industry Industrial Confidence Indicator (right scale)
2.3 - Services indicators (I)
Annualised moving quarterly change in % and index, smoothed series
2.4 - Services indicators (II)
Annualised moving quarterly change in %, smoothed series
-9.0 -7.5 -6.0 -4.5 -3.0 -1.5 0.0 1.5 3.0 4.5 6.0 7.5
-30 -25 -20 -15 -10 -5 0 5 10 15 20 25
2010 2011 2012 2013 2014 2015 2016 2017 Turnover in Services
Confidence Indicator, Services sector Social Security affiliates, Services (right scale)
42 44 46 48 50 52 54 56 58 60
-12 -9 -6 -3 0 3 6 9 12 15
2010 2011 2012 2013 2014 2015 2016 2017 Overnight hotel stays
Air passenger transport Services PMI (index, right scale)
2.5 - Construction sector indicators (I)
Annualised moving quarterly change in %, smoothed series 2.6 - Construction sector indicators (II)
Annualised moving quarterly change in % and index, smoothed series
-30 -25 -20 -15 -10 -5 0 5 10
2010 2011 2012 2013 2014 2015 2016 2017 Social Security affiliates, Construction Cement consumption (right scale)
-70 -60 -50 -40 -30 -20 -10 0 10 20 30 40
2010 2011 2012 2013 2014 2015 2016 2017 Permits, last 24 months
Construction confidence index Public works tenders, last 24 months
Sources: INE, AENA, Markit Economics Ltd. and Funcas.
Sources: European Commission, Ministry of Labour, INE and Funcas.
Sources: European Commission, Ministry of Labour and Funcas.
Sources: INE, Markit Economics Ltd and Funcas.
Sources: Ministry of Public Works, SEOPAN, European Commision and Funcas.
Sources: Ministry of Labour, OFICEMEN and Funcas.
21
SEFO - Spanish Economic and Financial OutlookVol. 6, N.º 4 (July 2017)
that observed in the first quarter (Exhibits 1.3 and 1.4).
Investment in housing also registered a sizeable increase in the first quarter, which is consistent with the trend in related indicators, such as the number of Social Security contributors in the construction sector and new house construction permits (Exhibits 2.5 and 2.6). The trend in permits points to continuation of the growth being observed in this component of demand, fuelled by job creation and low interest rates, as well as the housing scarcity increasingly evident in a number of areas, as reflected in price increases in the rental and buying markets alike.
Total exports registered their highest growth rate in 10 years, boosted by buoyant sales of goods and non-tourism services. Tourism exports also registered growth, albeit trailing the growth in the other indicators. Goods imports also sustained strong growth on the back of the sharp growth in exports and in investment in capital goods, variables with respect to which these imports are highly elastic. However, growth in total exports was higher than that in imports in real terms, giving rise to the above-mentioned positive – and higher than forecast – net contribution by exports to GDP growth. At current prices, however, growth in imports outstripped that in exports, due mainly to the increase in oil prices (Exhibit 3.1).
In short, from the demand perspective, the acceleration in GDP growth in the first quarter
From the demand side, growth acceleration in the first quarter of 2017 was driven by a much stronger export performance, along with a higher growth of domestic demand, resulting from higher investment in housing and capital goods.
of 2017 was shaped by a higher contribution by national demand, due to stronger investment in housing construction and capital goods, and a
bigger contribution by exports, thanks to buoyant exports of goods and non-tourism services.
On the supply side of the equation, the acceleration originated in the construction and services sectors.
It is worth highlighting the fact that growth in the commerce and hospitality sub-sector, i.e., that most closely related to tourism, has weakened according to the national accounting numbers.
However, the number of tourist arrivals and the amount they spend continued to rise in the first four months of the year at rates that are higher even than the record numbers registered in 2016 in what is proving another pleasant surprise for the Spanish economy in early 2017 (Exhibit 3.2).
In general, the service sector economic indicators showed signs of acceleration in the first quarter, a trend that continued into the start of the second (Exhibits 2.3 and 2.4).
As for the industrial sector, the indicators have produced a mixed bag of results for both the first quarter and the start of the second (Exhibits 2.1 and 2.2). On the one hand, the industrial production index was a little disappointing, in line with sales by the large industrial companies, albeit largely shaped by the drop sustained in the energy sub-sector. The purely manufacturing index fared somewhat better than the overall index, despite being dragged down by the adverse performance by the car manufacturing sector. The manufacturing turnover index and PMI readings were also on the positive side.
Growth in the number of full time equivalent jobs accelerated to 2.7%, implying a productivity gain of 0.6%, even though the productivity gain in the manufacturing industry was 0.1%. In the manufacturing sector, the numbers reveal a slowdown in growth in productivity, such that unit labour costs have begun to rise; however, the wage growth trendline remains below the sector deflator.
According to the most recent Labour Force Survey, unemployment continued to come down during the first quarter at the same strong pace
Raymond Torres and María Jesús Fernández
22
SEFO - Spanish Economic and Financial OutlookVol. 6, N.º 4 (July 2017)
as last year. The headline unemployment rate increased by 0.2 percentage points to 18.8%
but the seasonally-adjusted rate fell to 18.1%.
The active population continues to decline due to demographic trends. The participation rate is also trending lower due to lower labour force participation by youths and adults up until the age of 34. Above that age, the participation rate is rising (Exhibits 4.1 and 4.2).
As for the second quarter, the Social Security contributions figures indicate acceleration in the pace of job creation, driven specifically by the market services sector. Growth in employment in the construction sector would appear to be slowing from the high rate observed the previous quarter, with job creation broadly stable in industry compared to the first quarter. The drop in unemployment is similarly accelerating (Exhibits 4.3 and 4.4).
Source: Bank of Spain.
Source: INE.
3.2 - Tourist sector
Annualised moving quarterly change in %, smoothed series
3.4 - Balance of payments (II)
EUR billion, cumulative last 12 months
0 3 6 9 12 15 18 21
2010 2011 2012 2013 2014 2015 2016 2017 Tourists arrivals Tourist spending
-200 -100 0 100 200 300 400
2010 2011 2012 2013 2014 2015 2016 2017 Financial account net flows (excluding Bank of Spain) Net lending (+) or borrowing (-) of economy -10
-5 0 5 10 15 20
2010 2011 2012 2013 2014 2015 2016 2017
Exports Imports
Exhibit 3
External sector
Source: Ministry of Economy.
Source: Bank of Spain.
3.1 - Exports/Imports at constant prices (Customs)
Annualised moving quarterly change in %, smoothed series
3.3 - Balance of payments (I)
EUR billion, cumulative last 12 months
-50 -35 -20 -5 10 25 40
2010 2011 2012 2013 2014 2015 2016 2017 Goods & services balance
Income & transfers balance
Net lending (+) / net borrowing (-) with RoW
23
SEFO - Spanish Economic and Financial OutlookVol. 6, N.º 4 (July 2017)
Judging by these employment figures, coupled with the picture being painted by other economic
The sharp growth in investment and exports, due to the improved international context, has provided an unexpected boost, translating into faster growth in economic activity, employment and consumption, such that the economy, which had lost steam in the second half of 2016, is gathering momentum once again.
indicators, GDP growth may well have accelerated once again in the second quarter, approaching 4% in annualised terms. A figure which would, as with the first quarter numbers, easily outstrip the estimates contemplated at the start of the year, which foreshadowed as slowdown in growth due to depletion of the impact of some of the factors that had been driving the economy for the last two years. However, the sharp growth in investment and exports, thanks to the improved international context, has provided a new and unexpected boost, which is translating into faster growth in economic activity, employment and consumption, such that the economy, which had lost steam in the second half of 2016, is gathering momentum once again.
The inflation rate increased to the 3% mark at the start of the year due to transitional factors, specifically a knock-on effect on fuel prices of the increase in oil prices in the second half of 2016, a one-off spike in electricity prices and certain agricultural products due to meteorological conditions. These effects reversed in subsequent months, with inflation dropping to 1.5% in June.
Core inflation held steady at around 1% (Exhibits 5.1 and 5.2).
The trade balance to April revealed a significantly lower surplus year-on-year because imports grew faster than exports in nominal terms, mainly due to higher oil prices. According to the customs
records, the balance of trade in non-energy goods improved year-on-year. The deterioration in the trade balance was not offset by a reduction in the primary and secondary income deficits, so that the current account deficit came in at 409 million euros, while the first quarter of 2016 recorded a surplus of 1.9 billion euros (Exhibits 3.3 and 3.4).
The household savings rate has been trending lower since the start of the recovery. In 2016, it stood at 7.7% of gross available income.
Household investment, meanwhile, has been growing over the same period, so that the household segment’s net lending capacity has narrowed from 4% of GDP in 2013 to 1.9% in 2016. The non-financial corporations, in contrast, have been increasing their savings rate but also their investment rate, so that they presented a net lending capacity once again in 2016 equivalent to 2.8% of GDP (Exhibits 7.1 and 7.2).
The household and corporate deleveraging processes continued in 2016 albeit at a slower pace than in prior years (there are no data yet for 1Q17). Household leverage has declined to 102.5% of gross disposable income, 32 percentage points below the high of 2007, while that of the non-financial corporations has fallen to 101.7%, 31 percentage points below the peak of 2011 (Exhibit 7.4). Thanks to this deleveraging effort and the drop in interest rates, the debt
The drop in interest payments in recent years has been so significant that in 2016, in the case of households and corporations alike, interest payments were lower than in 2000, despite the fact that debt levels were much lower than today.
servicing burden continues to fall in tandem, fuelling consumption and investment in turn. In fact, the drop in interest payments in recent years
Raymond Torres and María Jesús Fernández
24
SEFO - Spanish Economic and Financial OutlookVol. 6, N.º 4 (July 2017)
has been so significant that in 2016, in the case of households and corporations alike, interest payments were lower than in 2000, which marked the start of the prior period of expansion, when borrowing levels were much lower than today.
However, in the case of households, the interest earned on financial assets has also declined and in 2016 the decrease was higher even than the drop in interest payments, so that the net effect of the reduction in interest rates on disposable income for the household segment as a whole
was negative last year. Nevertheless, the ultimate impact on consumption was likely positive as the savings rate presented by indebted households is lower than that of households with net assets.
The public deficit decreased to 0.37% of GDP, or 4.28 billion euros in the first quarter, from 7.88 billion euros in the first quarter of 2016 (Exhibit 7.3). The improvement was driven by stronger revenue, as expenditure was slightly higher. On the revenue side of the equation, the trend in VAT collections and social security Source: Ministry of Labour and Funcas.
Source: INE (LFS).
4.2 - Employment and unemployment (LFS)
Annualised change q-o-q in % and percentage of working age population
4.4 - Registered unemployment
Annualised moving quarterly change in % and millions, seasonally-adjusted data
7 9 11 13 15 17 19 21 23 25 27
-6 -4 -2 0 2 4 6
2010 2011 2012 2013 2014 2015 2016 2017
Unemployment rate, s.a. (right scale) Active population
Employment
3.4 3.6 3.9 4.1 4.3 4.5 4.8 5.0
-15 -10 -5 0 5 10 15 20
2010 2011 2012 2013 2014 2015 2016 2017 Rate of change in %
Unemployed, millions (right scale) 73.5
74.0 74.5 75.0 75.5 76.0
-3 -2 -1 0 1 2
2010 2011 2012 2013 2014 2015 2016 2017 Participation rate, s.a., aged 16-64 (right scale) Population, aged 16-64
Active population, aged 16-64
Exhibit 4
Labour market indicators
Source: INE (LFS).
Source: Ministry of Labour and Funcas.
4.1 - Labour supply
Annualised change q-o-q in % and percentage of population aged 16-64
4.3 - Social Security affiliates
Annualised moving quarterly change in % and millions, seasonally-adjusted data
15.5 15.9 16.2 16.6 16.9 17.3 17.6 18.0 18.3
-10 -8 -6 -4 -2 0 2 4 6
2010 2011 2012 2013 2014 2015 2016 2017 Rate of change in %
Affiliates, millions (right scale)
25
SEFO - Spanish Economic and Financial OutlookVol. 6, N.º 4 (July 2017)
contributions stands out, although the figures for the first few months of the year tend to be very volatile and scantly representative. The deficit consolidation effort was concentrated at the central and local government levels, offsetting
the downturn in the numbers presented by the regional governments and Social Security administration. The deterioration in the latter’s deficit during the first quarter is attributable to the reduction in transfers from the state, given that Exhibit 5
Price indicators
-2 -1 0 1