Structural Changes in the Spanish Housing Market and their Implications for Housing Policy
Structural Changes in the Spanish Housing Market and their Implications for Housing
Policy
Paloma Taltavull de La Paz e-mail address: [email protected] University of Alicante
International Economy Institute Campus de San Vicente del Raspeig s/n
03080 Alicante, Spain
Phone No.: 34.965909693, Fax No. 34.965909322
Web: http://www.ua.es
Paper presented to the Ramón Areces Seminar
“Housing Fluctuations in Europe:
Causes and Policy Options”, Madrid, Spain
April 8-9, 2005
Abstract
The paper evaluates the role of fundamentals to explain the evolution of housing prices in the Spanish market. Real and financial components of the housing demand are included in an empirical exercise in order to evaluate their impact on prices. It also check the possibility of current Spanish housing price cycle to be a bubble regarding the market absorption and the households indebtedness, and the macro-.effects of the price evolution. Some results suggest that there is not a bubble on Spanish housing prices but a strong revaluation on Spanish wealth.
Key words: Spanish housing prices, housing market fundamentals, bubbles, housing equity.
Introduction
The recent housing market fluctuations in Europe have sparked off a growing interest in the residential market among politicians and the mass media. These fluctuations are particularly strong in some European countries like Spain, and their persistence and intensity have generated various reactions, like the recommendations of prevention to purchasers, the attempt to persuade the mortgage system to slow down credits, and the expression (more common and repetitive than it should be) of concern by sowing panic about the existence of a speculative bubble that could burst out any day now. Although this situation is found in other countries too, e.g. Ireland, the United Kingdom, Holland, Portugal and Greece, it seems to be particularly and strangely persistent in the case of Spain. The Spanish housing market differs in some essential respects from those of the countries with which it has embarked on the expansive wave, namely the presence of strong growth trends in residential prices, though at lower rates than in some of its evolution partners, accompanied by a significant increase of residential construction that is as persistent as the expansion of prices, an increase that has turned out be the highest, along with an equally extraordinary growth in the number of mortgages granted. In the other countries, the new supply grows far less than prices, and even shows little growth, like in the United Kingdom. Besides, mortgage systems are by no means as flexible as they seem to be in Spain.
This combined acceleration movement in prices and activity has reached historical maxima in Spain, adopting the appearance of a limit situation that cannot continue. The growing involvement of the financial system has also led some people to sound the alarm, as it has brought back memories of the 1980-1984 period, in which this same commitment (among many other factors) jeopardised the stability of the financial system.
Structural Changes in the Spanish Housing Market and their Implications for Housing Policy
The deep, real reason for these fears lies in the potential repercussions of this process. In first place, residential prominence in Spain is feared to have far-reaching effects on the economy, as some scholars have suggested, because the diversion of capital toward the residential sector might reduce industries’ chances to renew themselves and gain competitiveness (i.e. it could mean credit restrictions for the industrial sector and much better conditions for the residential market); in second place, the increasingly relevant role played by housing purchase credits in terms of percentage of the total financing of the economy could lead to a situation of widespread risk in the mortgage system; this would happen in the hypothetical case that credibility problems derived from the loss of guarantees were to appear in the event of a sharp drop in housing prices. In third place, the increase of family indebtedness levels could become excessive and have an impact on consumption, the main driving force behind Spain’s economic growth during the last five years. Finally, although there may still be other explanations, fears exist that the strong trend to an increase in value of real estate assets together with the resulting access problems for new families could have a negative impact on the labour market, the mobility, and consequently, that inefficiencies could appear in the overall functioning of productive sectors or that social inequalities could increase, something that would counterbalance the redistributive policy.
Fears thus refer to general economic contexts in most cases, both real (the effects on consumption and mobility) and financial (the impact on the financial system’s stability and good health, as well as the concentration of risks in the residential sector) and particularly to the repercussions that an imbalance in residential markets may have on factor markets.
There is initially no sensitivity or awareness in Spain about the transnational impacts that this process may have on other EU member states.
No empirical evidence can be found in Spain to verify all this, which is why so little knowledge exists about the general effects that imbalances can cause on housing markets.
Neither do accurate data exist that can be used to identify the explanatory reasons for the increase of housing prices, although most experts agree that value expansion does not necessarily respond to situations of speculation, and therefore, no mention is made of the existence of a speculative bubble as it is usually understood in the financial world. They talk about increase in value instead of referring to ‘bubbles’ (Restoy, 2004).
The strength and persistence checked in the growth of real prices, along with a similar behaviour detected in the supply of new housing and mortgages, suggests that Spain is influenced by some fundamental factors, the effects of which coincide and overlap during the last expansive cycle. Some of these factors also intervene in other countries which not
always have joined the Monetary Union. The result of this combination has not been the same as in the experiences of other expansive cycle partners, which means that peculiar explanations and reasons must exist in the case of the Spanish economy that can help to understand why the evolution of its residential market is so different from that found in the other European housing markets.
This paper seeks to highlight these differential factors. According to the starting hypothesis, the behaviour of prices and construction during the last years of the twentieth century and the early years of the present century is not only the result of an extension of the previous expansive cycle, but also reflects the impact of structural changes on its long-term foundations, an impact that made it necessary to start a new long cycle with a time horizon that is not easy to define, although taking into account past experiences, it might last some fifteen years once it starts. Some of these structural changes have taken place in other economies too, but their impact on the Spanish market has been special. In Spain, these changes have had a positive interaction with residential market mechanisms, which has led to a sharp growth of residential activity.
Following this approach, price growth would not be the consequence of a speculation process that pursues quick profit associated to short-term changes, but the result of a change in the role played by the housing market that materialises in the increase in value of real estate capital in a more modern country with a fast-growing economy, something that resembles what happened in the 1970s. Besides, additional changes derived from the presence of so far non-existent or unknown factors that directly affect the long-term residential growth determinants have come into the picture. These factors are, among others, the increasingly visible presence of foreign demand as housing purchasers; a liberalised financial market; a unified monetary system that has brought transparency to the financial and residential markets, and the fast, dramatic fall of financial costs; a credit system that has always been very flexible and has had to develop competitive tools in which mortgages play an essential role. Competition has favoured mortgage concession flexibility thanks in part to the accumulated experience and knowledge that financial institutions (Savings Banks and Banks) have about housing loan management, and also to the strong conviction that investing their financial resources in property will bring them returns −for example, the achievement of a greater banking business volume− in addition to replacing profitable investment opportunities in a period during which other productive sectors show less dynamism. Some of these aspects entail structural changes on the demand side that take place simultaneously in time.
Structural Changes in the Spanish Housing Market and their Implications for Housing Policy
To cut a long story short, changes would affect demandants for reasons of use (population) and would equally be related to a higher flexibility in the financial-mortgage system, and to the changes that have taken place in the general economic mechanisms due to the permanent reduction of inflation and interest rates produced by our entry into the EMU. They all may have affected the adjustment system of the housing market itself by increasing the size of the market, the supply of which (the other side) has reacted to the impulses shown1.
The argumentation that sustains the existence of structural changes starts from the assumption that, although they have been present in other economies, these new conditions have affected the Spanish economy in a specific, peculiar way. Phenomena like the changes in the financial environment, the introduction of the euro, the progress made in the European integration and the slowing down of inflation have been shared by all European countries and however, only some of these countries have experienced the residential boom (one of them outside the eurozone, namely the United Kingdom) that has attracted so much attention in recent years. Then, what is so different about the Spanish economic situation as to explain why the residential and price cycles have the above-mentioned characteristics? The present paper is going to start from a long-term vision of residential market variables in an attempt to describe this process. Through the use of indicators that approximate residential prices, we will try to clarify the potential existence of arguments according to which there are no speculative bubbles, in first place, and also to provide an explanation about the theoretical foundations that justify the rise of prices.
The paper is structured as follows: residential prices in Spain are analysed in Section 1 taking into account the components that would support the existence of a bubble; Section 2 refers to the literature dedicated to the ‘speculative’ determining factors for residential prices and defines a model of ‘speculative’ reaction for Spain; Section 3 deep on the housing prices and construction in Spain and the clue for the existence of structural changes. Section 4 defines the model and the methodology use to be estimated, while Section 5 comments the results; finally, Section 6 offers the conclusions drawn from our research.
1.- An analysis of residential prices in Spain
The evolution of residential prices in Spain shows a substantial acceleration in the early twenty-first century. Monitoring Spanish residential prices is no easy task because there is
1 The aspects related to the supply side have not been dealt with in this article.
only one database that counts them as such, the so-called ‘valuation prices’ database2, that has been available from 1987 until the present day. The shortness of the period prevents the comparison of current prices with those found in the past. In other words, it is impossible to know whether or not what is happening nowadays has a precedent that allows us to identify a bubble or speculation process.
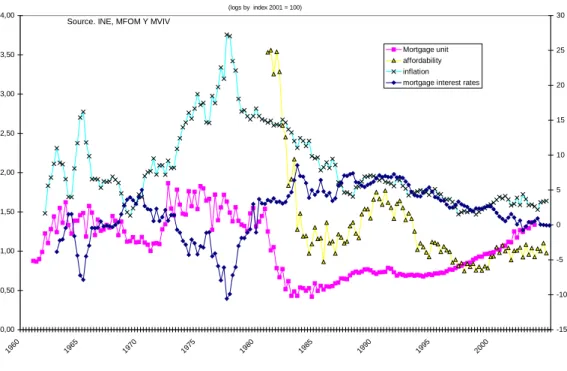
Nevertheless, in an attempt to approximate price behaviour by means of other variables, Spanish statistics make it possible to check the evolution of the rent prices component within the CPI as well as the evolution of mortgage unitary [total] amounts. Graph 1 reflects them all, represented in index numbers (2001 database).
Expressed in real terms, the extraordinary growth shown by the series is minimised if their long-term behaviour in real terms is represented (Graph 2)3. If the information contained in
GRAPH 1.- RESIDENTIAL PRICES AND MORTGAGE AMOUNTS
0 20 40 60 80 100 120 140 160 180
19 63
19 68
19 73
19 78
19 83
19 88
19 93
19 98
20 03 MORTGAGE UNITARY AMOUNTS Irented housing inflation VALUATION MVIV INFLACIÓN GRAL (in index number
Fte. INE, MFOM Y
2 This database is elaborated on the basis of the valuations carried out to inform financial institutions that are going to grant a mortgage loan. According to he valuation system, regulated by the Order Eco/805/2003 of March 27, BOE (Official Gazette) No. 85, published on April 9, 2003, the reference that should be taken for the estimated value is that corresponding to the transaction value or the property market value, in a minimum number of 6. In other words, this price series is a proxy variable of market value.
t
GRAPHIC 2.- REAL HOUSING PRICES AND MORTGAGE UNITS IN SPAIN
0,00 0,20
1960 1 1966 1 1972 1975 197 1981 1984 19 1990 1 1996 1 2002
0,40 0,60 0,80 1,00 1,20 1,40 1,60 1,80 2,00
963 969 8 87 993 999
Mortgage unit
housing inflation- cpi
housing value (logs on index 2001 = 100)
urce. INE, MFOM Y MVIV So
3The following expression has been used to obtain the real residential prices for this year:
LRph = log(ph/ipc)
Note that construction cost indices are not used here to estimate the real prices of dwelling units, since this normalisation has as its aim to estimate the role of capital gains as a profitability indicator.
Structural Changes in the Spanish Housing Market and their Implications for Housing Policy
the indicator of mortgage unitary amounts is considered valid to estimate price evolution, it can be seen that real prices oscillate around the general prices found in the economy, and thus describe an accelerated recovery that goes beyond its long term equilibrium level and differs from others experienced in the past in two characteristics: the first one, it is a sustained growth and not a breakage one as in the two previous periods (dramatic expansion during the 70-73 period and contraction between 1980 and 1984); and the second, its persistent tendency toward the historical maximum. These two changes in the past could have been related to speculative price jumps, which makes sense taking into account the existence of strong housing supply restrictions in the first case, along with the expansion in the demand associated with Spain’s economic growth and the entry of foreign investments encouraged by the signature of the 1970 agreements with the former European Community.
Instead, the contraction process that started to be felt in the 1980s derived from a widespread crisis in the Spanish economy and the specially strong impact it had on the residential sector, as a result of a joint effect on accessibility with high prices, financial contraction, as well as employment and income level drops. The stability highlighted by the evolution of indicators since the 1990s shows a substantial change in residential price behaviour, probably resulting from structural changes that have been taking place since then. It is necessary to underline how graphs show that prices, at the end of the series, still have not reached the real historical maximum.
2.- A review of the literature on the behaviour of residential prices
It is generally accepted that real estate market prices react asymmetrically in their short-term adjustment, i.e. prices can grow rapidly in expansion but fall rarely on contraction (Glaeser and Gyourko, 2001), and the balance is hard to reach, on most occasions in terms of prices and quantities. From Maisel (1963) onwards, the role of vacancies has been present in adjustment formulas, and asymmetry is widely recognised (Case and Schiller, 2003, DiPasquale and Wheaton, 1996.); therefore, prices quickly respond to the short-term demand, and vacancy pockets tend to become smaller, new construction being encouraged when this happens. This does not hold true in the opposite case, though, because, due to the role of housing characteristics as a component of family wealth, faced with a negative shock that may produce a downward trend among prices and demand, prices do not decrease in response to the effort made by owners to maintain the value, which in turn makes vacancy pockets grow or removes properties from the market. This behavioural asymmetry is reflected in the quick reaction of prices to changes in the demand and long growth periods,
usually through building activity, and in rapid contractions when economic conditions change4.
The idea of the asymmetric adjustment takes the weight of the adjustment out on prices and vacancies, which blurs the existence of a speculative bubble as it is conceived in financial economy. Following the definition of Stiglitz (1993: “If the reason the price is high today is only because investors believe that the selling price will be high tomorrow – when ‘fundamental’
factors do not seem to justify such a price—then a bubble exists”.
The use of residential price modelisation as a way of answering this question is not very common in the literature about the housing market. It is rather the opposite; the explanatory models for the behaviour of residential prices usually follow the fundamentals, refer to two frameworks: that of the lifecycle model (Meen, Dougherty & Van Order, Muellbauer &
Murphy, among others), in which prices represent the long-term market equilibrium component; and the models which concentrate price composition explanatory factors on the supply side..
The principles justifying speculative behaviour have been treated at much greater length in the financial literature, although some works show applications to the residential market. It is widely believed that the factors starting a bubble process are changes in the theoretical foundations that explain asset demand. In fact, some of them have already been identified, like the responsibility of the financial liberalisation process in the growth of residential prices across different countries since the 1980s (Ortalo-Magné & Rady, 2001). The financial liberalisation as well as the increase of credits are aspects found in all the bubble processes that took place in the world throughout the 1990s (Allen & Gale, 1998). However, neither the mechanisms that link these processes in real estate markets nor the mechanisms that trigger the crisis process are very clear. The bursting out of the bubble may be the result of the adoption of contractive measures in the monetary policy (e.g. the increase of interest rates, like in Japan), of changes in the economic environment (e.g. the oil price crisis in Norway) or social changes (e.g. the Chiapas uprising in Mexico); and therefore, the difficulty to identify the final moment of this process is widely recognised. On the other hand, the theory hardly admits the existence of speculators because they act with economic irrationality; instead, the theory is more prone to argue that bubbles appear when agents act
4 Prices will tend to reflect construction costs and the influence of fundamental factors in the long run.
Structural Changes in the Spanish Housing Market and their Implications for Housing Policy
rationally but in environments with imperfect information, heterogeneous beliefs5 and agency problems.
In the case of residential markets, it proves to be even more complex to detect the existence of a bubble when it is not associated with a similar financial process. It is argued that heterogeneity and lack of information are typical characteristics of real estate markets, which makes it more complicated to distinguish when a behaviour is speculative and when it simply shows the common way to react in this market.
Case & Schiller (2003) define a housing market bubble as “a situation in which the excessive expectations of the general public about future price rises can make prices become temporarily high”6. This definition introduces two important nuances: the temporariness and the acceleration with respect to what would be considered a ‘normal’ reaction of the residential market. These two nuances are important to avoid dramatising the existence of a bubble. The acceleration implies that, within the common context of growth, the presence of a residential bubble would increase expansion speed with respect to the average, i.e. prices would be subject to two growth rates at the same time: that justified by medium-term foundations; and the one which represents the response of short-term expectations.
Temporariness implies that a correction would take place in a period of time that would bring growth closer to its long-term expansion rate, which is not a long-term trend; i.e. the second component would have a zero value at one moment during the period. The possibility of a stronger correction (as it happened in Spain in the early 1980s) implies that other fundamental growth determinants, apart from residential market mechanisms, come into play, which would cause a change in the first growth component.
Speculation will appear, and prices will consequently reflect speculative behaviours, when (Scheinkman & Xiong, 2002) agents expect to obtain additional profit from the purchase of an asset by reselling it after a short period of time. The literature does not show a unanimous opinion regarding the decision-making process, as they recognise that agents act irrationally in these situations, and even buy at prices above equilibrium ones because they expect to find purchasers that will accept even higher prices. Nevertheless, only some studies recognise that speculators use backward-looking expectations. Rather, agents are generally considered to be rational, as they base their opinions and actions in a set of available information that is relevant in the market. Therefore, it is through this information that they
5 A growing number of works are treating such issues agency problems, heterogeneous expectations and the degree of confidence in real estate markets. One example is the study by Wang, Zhou, Chan & Chau, 2000).
6"a situation in which excessive public expectations for future price increases cause prices to be temporarily raised, pp.
introduce innovations in their decisions. With perfect information, the bubble would not exist, as agents would be able to anticipate future events (Scheinkman & Xiong, 2002).
However, the assumption of backward-looking expectations is not completely accepted among housing market researchers, in whose opinion the bubble is due to the existence of imperfect information and agency problems that make agents express heterogeneous opinions, consider that their opinions are the best and develop strategies oriented to the creation and persistence of bubbles (Abreu & Brunnermeier, 2001, Horst, 2001) as was said above. These works define this behaviour as being caused by the behaviour of agents who have rational expectations with imperfect information, the bubble generated being referred to as a ‘growing rational bubble’ because it is based on rational expectations and grows at a constant r rate by definition (Kim & Shu, 1993).
Prices themselves are believed to instantaneously ‘discount’ innovations, thus fuelling expectations with their behaviour (Case & Schiller, 2003), and agents receive (and incorporate to their expectations) market innovations/news through the observation of some specific variables. Among the factors that send out ‘signals’ about market activity stand out transactions7, since the process will last longer as better news items about absorption come from the market. Therefore, prices and transactions will be temporarily related to a biunivocal causality order. Andrew & Meen (2003) contrasted this correlation and showed that transactions react faster than prices in front of a shock with temporary effects by returning to their equilibrium level, whereas prices react more slowly than transactions, although with permanent impacts on their equilibrium level.
The expectations of growing prices are equivalent to the existence of growing capital gains, the existence of those capital gains being precisely one of the demand-determining factors in most of the literature (Dougherty & van Order, 1987, Poterba, 1984, 1992, and later works).
In fact, the lack of capital gains related to property ownership entails that the future value of the property in real terms will decrease with respect to previous periods. From the point of view of investment goods, this represents a loss of wealth and would generate a massive property sale. This means that growing capital gains at ‘normal’ rates guarantee balanced market growth. However, if gains grow at rates above the usual ones, they might make the speculative process start.
Following the aim to contrast the Spanish case, a ‘speculative’ price model could be formulated including the components saw as explanatory of a ‘rational bubble’, where
7 Vacancies to people involved in investment linked to productive activities, e.g. developers.
Structural Changes in the Spanish Housing Market and their Implications for Housing Policy
agents form their expectations on prices observing the market evolutions (transactions) and the restrictions coming from the financial market 8
(Ortalo-Magné & Rady, 2001):
(1) pht =
α
+β
ph et+1 +δ
tt –λπ
t –γ
rit+ ϕ (δph/ph)t +µ
twhere pht corresponds to the real prices of dwelling units, p et+1 is a measure of expectations about prices, tt stands for the transactions carried out during the period, π is the general inflation in the economy, rit is the differential between mortgage interest rates and those of alternative assets that approximates the profitability associated with investment on non-residential assets, (δph/ph)t refers to the capital gains obtained in real terms during the t period, α, β, δ y– γ are parameters, L is a gap operator, and µτ is a random component. Small letters represent logarithms. The adjustment incorporates an independent term that will absorb the weight of the variables omitted in the adjustment, namely the price explanatory real and fiscal variables. We intuitively omit fiscal variables because they are not supposed to be a component that can develop a bubble as it has been defined here.
Expectations implies that each individual hope that, in the future, prices are those observed in the past plus a such amount of difference, so ph et+1> pht-1,, and this factor is growing9. As agents hope that expected prices are those observed plus a difference, it could be said that:
ph et+1 = pht-1 (1+ φ), being φ >0, substituting on (1)
(2) pht =
α
1+β
(1+φ
) pht-1 +δ
1tt –λ
1π
t –γ
1rit+ ϕ1 (δph/ph)t +µ
t(3)
∆
pht =α
2 +ψ
pht-1 +δ
2tt –λ
2π
t –γ
2rit+ ϕ2 (δph/ph)t +ε
t 10Where α2= α1/β, the sub-index numbered 2 make reference to the original parameter divided by B, ψ= φ/β and
ε
t is the error term.
8 This component is usually measured by means of the differential between the performance of dwelling units and that of alternative assets, including a form of discrimination between residential investment and other types of investment.
9 This assumption (hypothesis) is confirmed in other studies. For example, Grimes, Aitken & Kerre (2004) claim that price expectations, based on past regional phenomena, lead to overshooting of house prices in response to new region-specific information. We also find that price dynamics are influenced by past regional house sales activity and that the dynamic adjustment process is asymmetric depending on whether house prices are above or below their long-run equilibrium..
10 Note that the component ((δph/ph)t +πt ) represents nominal capital gains, as is pointed out by Andrew et al.
(2003), p. 108.
It must be remembered that price adjustment is a characteristic of the residential market, i.e.
changes in prices in general will define the joint action of overall housing market determinants, as fundamental factors, and ‘non-fundamental changes’ in prices among which a speculative bubble could be included. That is,
(1-L) pht = (1-L) (phnt . phet), phn being the ‘normal’ price growth component and phe the speculative one. These two components cannot be observed independently, although taking into account that, by definition, phn responds to market foundations, the behaviour will remain stable, and then phe can be approximated either by alternative methods.
Equation (3) implies that the fit, technically, shows two parts: a long term behaviour derived from the structural form, and a cyclical component. Some authors assume that determinants of phnt would be the fundamentals omitted on (3) as evolution of population, the income growth or finance, among others reasons, and the components link to the interest rates and capital gains expectations should approach the behaviour of phet..
This ‘double behaviour of prices’ approach is often found in the literature11 , so, the measurement of bubbles is carried out, precisely, calculating from the differences between the value of prices estimated and the one observed from a structural function that establishes long-term relationships between prices and their fundamental variables.
The presence of transactions in (1) is justified because they are the element which allow to information to be added to the market dynamics through the agents’ reactions. Agents incorporate innovations following the speculative behaviour. The longer information the speculators have, the more they can fit their decisions internalising the information coming from the fundamentals of the market.
If the bubble exists, the general model would show reversion in its residues, as an element that perpetuates the relationships between prices and the other components, capturing agents’ strategies. Within the residential market, therefore, the speculative process would materialise through successive transactions at real prices that should incorporate residential capital gains with prices above their long-term equilibrium value.
- The conventional view of housing price cycles
Nevertheless, the research works that try to analyse residential prices from this perspective alone cannot explain their evolution completely. The truth is that the literature usually deals
11Levin & Wright, 1993 measure it as Pt = Pz t + G t, where PZ t is the price assuming zero-capital gains, and G t is the present value of the expected capital gains. Also in Kim & Shu, 1993.
Structural Changes in the Spanish Housing Market and their Implications for Housing Policy
with the analysis of prices without disaggregating them from their market determining factors. Prices are thus influenced by long-run and short-run conditions (Meen, 2003), or, to put it in another way, by the structural determinants present in the housing market and those associated with the influence of capital markets (DiPascuale & Wheaton, 1996?). Following the lifecycle theory, the formulation of housing behaviour is made as the arbitration condition that maximises the usefulness of the demand for owner-occupied property.
Following Meen, 2003, the prices that empty the housing market are initially influenced from the demand. They fit slowly and sometimes separate themselves from their equilibrium trend. This trend is a function of the factors that determine the long-term growth of the demand, e.g. the population (number of families who need a home, pop), the permanent income level that gives them access to the market, ry, the existing housing stock, h, the wealth of families, w y the use costs of houses, uc.
(4) Pd*t = α1 + α2 (pop)t + α3 (ry)t – α4 (h)t + α5 (w)t – α6 (uc)t + et
This happens within a financial environment where financing flows have no limits.
Financial restriction is usually measured as the effect of short-term factors and is not often defined as a specific determinant of the demand in general models. However, as was highlighted above, financial liberalisation has been generating an increase of financing flows toward the housing market since the 1980s, and therefore becomes an additional explanatory factor of both the demand and the prices (ff)t.
(5) Pd*t = α1 + α2 (pop)t + α3 (ry)t – α4 (h)t + α5 (w)t – α6 (uc)t + α6 (ff)t +et
The uc factor is the arbitration condition component12, and its expression includes fiscal taxes on income (φt), interest rates it , inflation πt , house depreciation rate δt and capital gains (δ ph./ph)t) 13
Uc = ((1-φt)it – πt + δt – (δ ph./ph)t)
12 The arbitration condition is Pt = Rt / ((1-fit)it – πt + δt – (ge./g)t)
13 Poterba, 1984, includes other types of fiscal taxes, and expresses the use cost as:
cu= ((1-τYt)(it +τ P t)+ dt – E(πHt)). Other authors include the different interest rates of assets and liabilities that influence the demand.
GRAPHIC 3 .- REAL HOUSING PRICES, HOUSING STARTS AND STRUCTURAL DETERMINANTS OF SPANISH HOUSING MARKETS
0,00 0,20 0,40 0,60 0,80 1,00 1,20 1,40 1,60 1,80 2,00
1960
1965
1970
1975
1980
1985
1990
1995
2000 Mortgage unit housing value Housing starts employment real wage income Tot population (logs by index 2001 = 100)
Source. INE, MFOM Y MVIV
According to McCarthy & Peach, 2003, the slow equilibrium-oriented adjustment experienced by the housing market can be approximated with an error correction adjustment that captures the process. Faced with a shock in one of the fundamental determinants, the adjustment of the price towards its long-term trend takes place following a process, as in (5) (6) ∆Pt = λd (Pt-1 - Pd*t-1 ) + β0 + β1∆popt14+β2∆ryt - β3∆ht - β4∆uct + β5∆wt+ β6 ∆ (ff)t + εt,
in which stock variation (∆ht ) refers to the vacancies or inventories (Maisel , 1963) that exist in the market15, and the components of change in use costs and wealth variation (∆uct
and ∆wt) focus the attention of the short-term adjustment on the choice of investment objects between housing and other assets, inflation, fiscal components and capital gains, depreciation being considered constant. The expression, which therefore includes use costs and takes into account the fact that Pd*t-1 captures the impact of the demand foundations other price, would be:
(7) ∆Pt = λd (Pt-1 - Pd*t-1 ) + β0 + β1∆popt +β2∆ryt - β3∆ht - β4( γ1πt - γ2 (δ ph./ph)t + β6
∆ (ff)t + γ3 ((1-φt)it ) + εt
14 The basic demand component, population, usually disappears from the specification in most models when it is specified in differences.
15 The difference in stock is recognised as the residential investment during the period in question. The concept of inventories is broader and it is proved that they go through an adjustment in the short term along with prices.
They are usually included in short-term adjustments in US models (Ortalo-Magné & Rady, 2001), although the lack of information about vacancies in Europe leads to a different measurement through residential investment ratios or transactions over the stock, Meen, 1998, 2000, 2003.
Structural Changes in the Spanish Housing Market and their Implications for Housing Policy
GRAPHIC 5. REAL HOUSING PRICES AND ITS FUNDAMENTALS IN SPAIN
0,00 0,20 0,40 0,60 0,80 1,00 1,20 1,40 1,60 1,80 2,00
1960 1965
1970 1975
1980 1985
1990 1995
2000
0 5 10 15 20 25 30
Mortgage unit Housing starts mortgages flow affordability inflation (logs by index 2001 = 100)
Source. INE, MFOM Y MVIV
3. An application to Spain: Does a speculative bubble exist in Spanish residential markets at the beginning of the XXI century?
The evolution of prices reflected in Graph 2 shows a very long fluctuation of prices around their long-term equilibrium values. At the present moment, it would be reaching a historical maximum, although it does not seem possible to identify the expansion limit due to the changes that have taken place in the Spanish economy. The previous maximum was reached after substantial changes in the Spanish economy, changes that were described as structural in the literature (García Delgado, 2004), after a period of 15 to 18 years following the Stabilisation Plan. The similarity between the situation that existed at that moment in the past and the one we have now (nearly 20 years after Spain’s entry into the European Community) could suggest that the current economic reasons could resemble those found in that past period, although it is very difficult to anticipate if the adjustment shown in the graph corresponding to the contraction process experienced during the early 1980s is going to take place. Anyhow, the vision of the period can give us an idea of the changes that have affected the Spanish housing market in recent years.
The evolution of prices has been accompanied by a high activity level throughout the period, although, in this case, the last period seems to suggest that market mechanisms have overcome restrictions that existed in the past and probably affected the behaviour of the supply as well as that of prices (Graph 3).
Long-term demand determining factors have gone through smaller fluctuations, although their changes can justify a relevant part of residential activity until the mid-1990s. On the one hand, the growth of derived employment as a result of external population flows seems to have broken the maximum growth ceiling of the potential Spanish demand. Secondly, the extraordinary increase in the financing flows must have had a relevant role too, despite the fact that the family’s average available income has not grown at the same rate.
Regarding short-term determining factors (interest rates, inflation and capital gains), Graphs 4 and 5 also provide a detailed description that allows us to see how conditions have changed. The drop in real interest rates may not have been so dramatic as that of nominal ones, although the new situation has generated a considerable fall of house accessibility levels which, together with the most reduced inflation rates ever, has favoured the demand.
These graphs suggest that the supply side has probably suffered the strongest impact, with a quick reaction of the building sector in front of these impulses. Nevertheless, this paper does not have as its aim to analyse this side of the market but to show the effects that these changes may have had on the demand.
- A reference to structural changes
GRAPHIC 4.- REAL HOUSING PRICES AND SHORT TERM DETERMINANT IN SPAIN
0,00 0,50 1,00 1,50 2,00 2,50 3,00 3,50 4,00
196 0
196 5
1970
1975
198 0
198 5
199 0
199 5
2000
-15 -10 -5 0 5 10 15 20 25 30
Mortgage unit affordability inflation
mortgage interest rates (logs by index 2001 = 100)
Source. INE, MFOM Y MVIV
Equation (7) allows us to classify the relevance of the structural changes’ which Spanish economy could are experiencing. These changes affect to the residential demand
Structural Changes in the Spanish Housing Market and their Implications for Housing Policy
fundamentals mentioned above. Firstly, the potential demand reflected in the number of families who need a home has been strengthened with the incorporation of young people thanks to the employment recovery felt since the mid-1990s, as well as the changes that the Spanish home creation model has suffered lately, something that has not yet been the object of much in-depth research16. This fact alone would not represent a structural change.
However, to this factor are added two new sources that demand stable housing. The first one would be the extraordinary reception of new immigrant families who arrive in Spain to join the labour market. The weight of immigrants within Spain’s total occupied population has passed from 1% in the late 1990s to over 4% in 2004, which highlights the relevance and the future stability of this process17, additionally favoured by the fact that immigration is present in most Spanish regions. The second new source would correspond to the growing demand of dwellings located in tourist destinations. The increase of the stock available in these geographical areas has been seen as a consequence of ‘residential tourism’, that is, of the demand of homes for tourism-related uses. However, recent works (Taltavull & Ramón, 2005) underline that a considerable part of this increase is the reflection of a stable demand represented by European citizens who purchase their houses with the purpose of spending long periods in the Mediterranean coastal areas as well as in the islands. This process was consolidated in the late 1990s, and therefore became an example of stable migrations that drive the residential market on a permanent basis. These changes would imply that, in a very short period of time, the potential demand has grown above its long-term level, and therefore generated an increased market size which can actually be considered as the first structural change. There are international experiences measuring the impact on housing prices of the foreign buyers, as in Benson et al. 1999.
The second structural change has to do with the general economic situation. The stabilisation of inflation and interest rates has had diverse effects. In first place, the drop in rates has generated a real reduction of mortgage payments, as a result of which both mortgage loans and the actual houses have become cheaper regardless of their initial price.
This has meant an instantaneous change in the position of many families as housing demandants. Although it is recognised that the fall of interest rates has been capitalised in prices, the joint action of the system with the expansion of mortgage maturity has contributed to maintain this favourable situation. Real housing prices and capital stock are not neutral respecting the inflation rate (Poterba, 1984). An increase on inflation reduces the
16 The research works by Leal (2005) can be consulted as evidence.
17 Demand stability is an essential component of long-term growth.
interest rate after taxes. If the arbitrage condition is maintained, any increase on inflation implies a rise on real housing prices.
Also, the stabilisation of inflation at low levels and the growth of residential prices have modified agents’ expectations about their equilibrium financial position, which has generated a gap between the real profitability of financial and real estate assets that in turn has reoriented capital toward the property market in general, and the residential market in particular. The mechanism generating this reaction is less known but a relevant literature exists explaining the impact on housing prices caused by changes in inflation (Dougherty and Van Order, 1982), which increase the prices through the cost of use. Also, some evidence exists about how housing price growth indirectly affects durable goods consumption through the expectations mechanism. De Gregorio et al, 1998, show how the expectations about the increase of general prices generate a process in which agents advance their durable goods consumption because inflation modifies their desired level of long-term consumption of this type of goods. From the moment in which agents notice this, they tend to advance the future expected consumption, which results in an ‘accumulation’ of the demand in the market at those moments when the agents expect to see the future inflation grow. This behaviour generates a cycle known as the ‘boom-bust cycle’ in the durable goods market.
The general changes have consequently created an appeal for housing purchase, both as an opportunity derived from the real reduction of payments and because of its greater profitability as an investment object. If we also take into account that real estate goods potentially generate rent flows, this investment option becomes more and more attractive for both personal and corporate portfolios.
The third structural change is related to the mortgage system, and consists in the apparent elimination of credit restrictions as a result of the modifications introduced in a market increasingly oriented to a liberalised financial environment characterised by a much higher competition level. The reaction of the Spanish mortgage system has materialised in its increased presence inside the financial system (with the growing weight of the number of mortgages granted with respect to the GDP and an also growing family indebtedness level, Bank of Spain, different numbers, Spanish Mortgage Association), up to levels that have reached the European average. This entails the presence of an increasing flow of capitals destined to mortgage loans in the market that has contributed to enlarge it and has additionally altered the risk structure and the investing strategy of the financial system.
Structural Changes in the Spanish Housing Market and their Implications for Housing Policy
If the first structural change is considered, this flow may be independent from the capitals provided by the third source of demographic demand (foreign visitors who buy houses), which shows how the residential market has received massive financing flows in recent years.
The increased size of the market from the demand side, both in terms of sources and in financing, should materialise in a greater number of transactions and should also be reflected in short-term adjustment indicators like prices and vacancies.
- Evidence of structural changes
is difficult to identify structural changes in economic series, but the alterations suffered by
into account the long-term prospects for housing prices in Spain (Graph 6) and
-1.0 -0.5 0.0 0.5 1.0
65 70 75 80 85 90 95 00
LRUM T1970 T1980
T1990 T2000 T2004
GRAPHIC 6. TRENDS ON SPANISH HOUSING PRICES: 1960-2004
It
the fundamental variables of residential demand in Spain suggest that these changes may have entered the housing markets. A structural change basically appears as a series trend line breakage. This breakage can happen quite suddenly, in a very short time and after very dramatic shocks, or more gradually during a longer period (Maddala and Kim, 1998).
Similarly, the changes may have temporary effects, in which case the markets can return to the equilibrium, or permanent ones. It is precisely because of the idea of trend breakage that researchers observe them with the aim of inferring the potential existence of structural changes.
If we take
calculate trends during different periods (1963-1970, 1963-1980, 1963-1990, 1963-2000 and 1963-2004), it becomes clear that the first two hardly modify their slope, the third changes it
0 10000 20000 30000 40000 50000 60000 70000 80000 90000 100000
Antes de 1941
1941-1960 1961-1970 1971-1980 1981-1990 1991-1995 1996 1997 1998 1999 2000 2001 GRAPHIC 7. HOUSING OWNED BY FOREIGNERS. Arrived year
number of housing Source: 2001 Census. INE
(Number of units by year)
comp
houses started with a quasi-
chasing power
letely over time, and the last ones show a similar pattern though with a relevant correction. The presence of a negative slope in prices with the long-term vision is not unusual in the housing market literature. In fact, Mankiw & Weil, 1989, used it for their prediction of a drop in real prices in the US from the 1990s on.
The evidence of a change in the size of the housing market appears with the breakage of the ceilings for the concession of mortgages and the construction of
stable population level. Graph 3 shows that the Spanish population was stagnant until the beginning of the year 2000, when, as a result of the arrival of a strong migratory flow, it started to grow again. This population is that registered on the Spanish census, although there are growing signs that it only represents a part of the basic housing demand. This argument is sustained in the way the Spanish stock is used: the growing relevance of houses that are not registered as homes (defined as first or main residences on the census) suggests (1) the existence of other demand reasons among Spanish families themselves and/or (2) the existence of demandants who are not registered as permanent residents in the Spanish territory but are present in the market in a stable way and generate activity around the region where they live. This phenomenon has been present for years in the Spanish residential market, but has acquired new strength lately, as is visible from the census (Graph 7), and concentrates specially in a number of specific Spanish geographical areas18.
Population increase is a necessary but insufficient condition for the size of the residential market to grow. As the theory says, increases in the financing and in the pur
are also required so that the market can fit without tensions related to prices and amounts.
The limits in both aspects during the 1970s probably limited supply expansion, and these
18 This type of phenomena and their repercussions on the housing market must be analysed on a local basis.
Structural Changes in the Spanish Housing Market and their Implications for Housing Policy
limits, as far as the total volume of financial funds are concerned, may have disappeared after the financial liberalisation process, which in turn has favoured family access to housing, as has already been said.
Graphs 4 and 5 also seem to suggest that the changes that have affected inflation and interest rates may have played a significant role in the breakage of growth ceilings within the
place during the 1990s. The second oil shock and its repercussions on
4.- Empirical exercise. The data, the model and the interpretations
his section is going to estimate the general residential demand model for the Spanish istence of structural
proxy version used here and in the series of
t show a structural (long-term) behaviour and the short-term
residential sector.
In this exercise, we have the intention of carrying out an in-depth analysis of the changes that probably took
Spanish residential markets in the late 1970s are not too well known, but the evolution of prices seems to reveal that the change was very important, even though some market restrictions limited the expansion advocated by the demand sources. The statistics available for this period do not allow us to thoroughly analyse what happened. The databases available since the late 1980s do offer us the opportunity to study these aspects, though.
T
economy. We use conventional indicators and verify the potential ex
changes in the above-mentioned market mechanisms linked to changes in financial flows, interest rates, inflation and population flows.
An approximation to the behaviour of prices in particular is made by adjusting (3) for data corresponding to Spanish prices, both in their
valuation prices. The measurement of variables and statistical characteristics can be found in Appendix 2. The indicators for prices, transactions and inflation used are I(1), and there is a co-integration relationship between them, which is why an error correction methodology is used to estimate the function instead of GARCH methods as is recommended in the literature when prices are modelised19 (Gu, 2004, though basically in models introducing spatial differentiation).
The functional way to estimate the model is a VEC that makes it possible to obtain a vision of the components tha
influences exerted by the variables. The advantage of using this method consists in the
19Nevertheless, a GARCH model has also been calculated for the same function, but the inverted root obtained shows a stationary process that invalidates the robustness of the parameters calculated, the results being probably spurious.
possibility of comparing the influence of the two residential price determinants (fundamental and temporary) exactly as is expressed in the theoretical contributions.
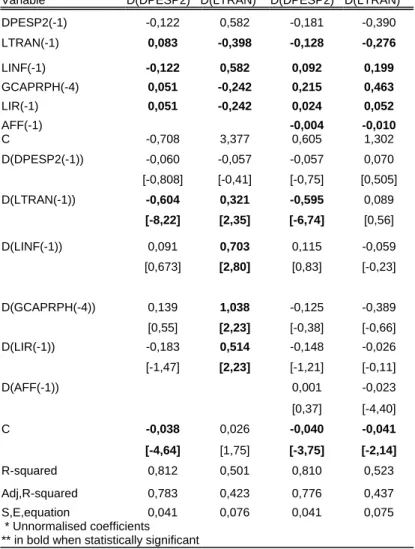
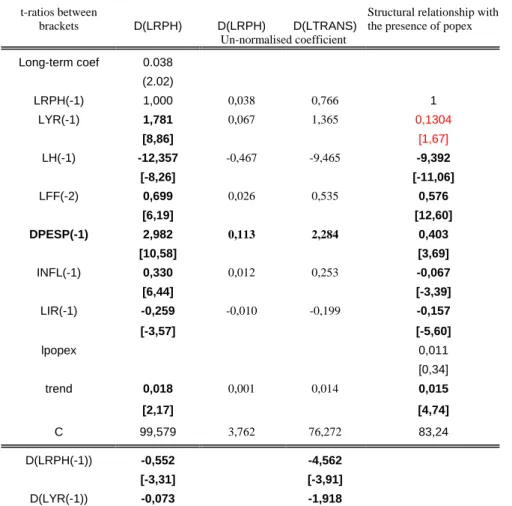
The results can be found in Table 1 of the Appendix20. The estimates were carried out in
s for short-term price
el’s short-term
relationship between the increase of housing prices
to expectations and transactions is significant in all adjustments,
different sub-periods. In the complete period (1967-2004), the dependent variable is represented by the prices estimated over mortgage unitary amounts. The function is also adjusted for the 1967-198321 and 1983-2004 periods, the latter being reduced in an estimate corresponding to the 1988-2004 period with the purpose of incorporating the original series of valuation prices and comparing the results. Likewise, the 1993-2004 period is adjusted with both variables in order to observe the last decade in more detail.
The estimates by sub-periods try to identify the determining factor
growth processes along with the stability in their long-term behaviour. The error correction model is adjusted with stationary trend during the last period from 1988 on, a trend that apparently does not affect the complete period. Some evidence also seems to exist of a seasonal behaviour in this period, and for this reason, exogenous variables that reveal the seasonal frequency of the adjustment are included, basically for q3 and q4.
If the bubble exists, we expect to obtain high significance in the mod
behaviour, even though a significant structural result would mean that the factors determining financial behaviour are going to be present throughout the period. The intensity of the speculative process would depend on the explanatory capacity of the adjustment and the significance of speculative factors.
Table 1 shows the evidence of a close
and the components of expectations, inflation and credit restrictions. The explanatory capacity of variables never exceeds 33% all through the period, although this capacity increases as the adjustment reaches the last decades. The adjustment’s independent term is very relevant in all cases, which proves the existence of explanatory variables that have not been included in the specification and points at the search for real foundations in order to explain price behaviour.
The factor corresponding
together with inflation and interest rates. The latter two show an elasticity above 1 throughout the period. All of them show a structural relationship that is maintained in all the adjustments carried out, although this relationship becomes more important for the
20 The details of the empirical exercise along with a description of the series are offered in Appendix 2.
21 The analysis of prices reveals a high probability of existence of cut-off points during 1982 and 1983; so, this is the year in which the sample is divided.
Structural Changes in the Spanish Housing Market and their Implications for Housing Policy
explanation of adjustments from the 1980s on, and especially during the 1990s. In the short term, all the adjustments show a high significance of lagged price growth and capital gains, which confirms the relevant role played by the ‘rational’ expectations (in (3)), which adapt their influence according to the observation of various factors present in the market. The adjustments present low residue values.
However, these adjustments have very little stability in their coefficients, particularly at the
speculative
mponents, we have applied the methodology already used in
t in the demand function:
µt
(9) ∆phet = t-1 ) = β0 + β1∆ryt - β2 ∆ (ff)t - β3∆ht - β4( γ1πt - γ2 (δ h)
end of the period, as can be seen in the table. Stability contrasts reveal a high probability of change (Chow test), indicating possible changes in different years (1982, 1997, 1999), though not categorically. The lack of stability and the apparent reversion were found in other works when such long price periods were subject to analysis (Grimes, Aitken & Kerr, 2004, though the exercise was not performed at an aggregate level, but in several regional markets). Doubts also arise concerning lack of identification in the equations.
This introductory exercise has led us into the exploration of the role played by
components. A correct modelisation of prices based on their structural behaviours is carried out next. We are going to follow the definition in (7), although we are interested in contrasting the two components that intervene in the increase of prices, ∆pht = ∆ (phnt . phet), the one which responds to structural growth, phnt, and the one which responds to
‘speculative’ growth, phet. In order to separate both co
other works in which the structural relationship explanatory of prices Pd*t-1 is extracted. We calculate the long-term price that would act as an estimator of the price evolution stable component, phnt, and then, estimate by differences phet,, which could be considered the
‘speculative factor’. After that, it is verified whether the factors included in (3) could explain the ‘speculative’ factor of housing prices in Spain.
We formally adjust the long-term relationship that is implici
(8) Pd*t = α0 + α1ryt-1 - α2 (ff)t-1 - α3ht-1 - α4 ( γ1πt-1 - γ2 (δ ph./ph)t-1 + γ3 (1-φt)it-1 ) + And later estimate:
∆Pt - λd (Pt-1 - Pd* ph./p t + γ3 (1-φt)it - γ4 iat ) + εt
where ∆ phnt = (Pt-1 - P *d t-1 ) 22
22 An additive relationship between both types of price growth has been assumed. An alternative approach is to consider that another kind of relationship exists between them.
We include a dummy variable indicative of a structural change that we locate as starting in 1997, although the stability contrasts of coefficients show that a structural change in the relationship could have taken place between 1997.3 and 1999.223.
It can be inferred from the expression that the left side of the equation represents the different price growth component that is justified by the factors regarded as very short-term, which find themselves on the right side of the equation with explanatory components. The inclusion of the totality of factors, derived from the demand function arithmetic, would point at the financial factors responsible for ‘non-real’ movements in prices. The similarity of this side of (8) to (3) confirms that the ‘speculative behaviour of prices’ cannot be applied outside the foundations; so, it would capture the rational behaviour of rational agents.
In function (9), fiscal taxes24 and the depreciation of residential structures have been considered constant and the role of wealth in the adjustment, exogenous25.
Finally, an accessibility indicator has been introduced, measured as the payment effort ratio, defined as:
affordt = φ( (ry)t , it ) == which could be approximated by the expression.. α3 (ry)t + γ3 it of the price function26.
It is a measure of demand accessibility to the residential market, which reflects the combination of income level effects with interest rates and financial capital flow, and which is the key, in Spain, that permits the access to owner-occupied property in the absence of sufficient previous saving that equals market price. Since most transactions are made through the concession of mortgages, the variables which determine payment capacity are those which facilitate ‘de facto’ the incorporation of the demand. This indicator can be observed in Graph 4 and is included in the function on a second stage, after the first analysis, with the purpose of checking the potential effect caused by its evolution on prices.
As ff (financing funds) are used a number of transactions financed with mortgage operations granted to dwelling units during the t period. The housing availability indicator used is the
23 The contrast applied is the Chow Test for different moments in the series. The probability of rejecting the non-existence of structural changes is nearly 1 between those two moments.
24 Some works in Spain show that changes in the tax system have had effects on residential prices, though not in the general tax, but on the specific treatment of the dwelling. In this paper, we consider it exogenous, but it is necessary to see the discussion offered in the different studies by López García, MA, 1996, 1998, 1999, 2001.
25 The justification for it consists in the formula to measure this indicator in Spain, a country in which the largest part of a family’s investment component is, precisely, the housing asset. Moreover, the fact that the purchase guarantee is the actual house implies that one family might not need to have previous wealth in order to access the market. On the other hand, there are short, non-homogeneous financial wealth indicators that introduce biases in the adjustment.
26 The accessibility indicator (Afford) is constructed by calculating the accessibility ratio or family payment effort, taking into account the average salary of a full-time worker, the interest rates in force at each moment, the average mortgage granted during the t period and the average loan maturity at the t moment. The calculation was made for a new loan each time, under the market conditions, calculating the amount (capital plus interests) that the house purchaser has to repay.