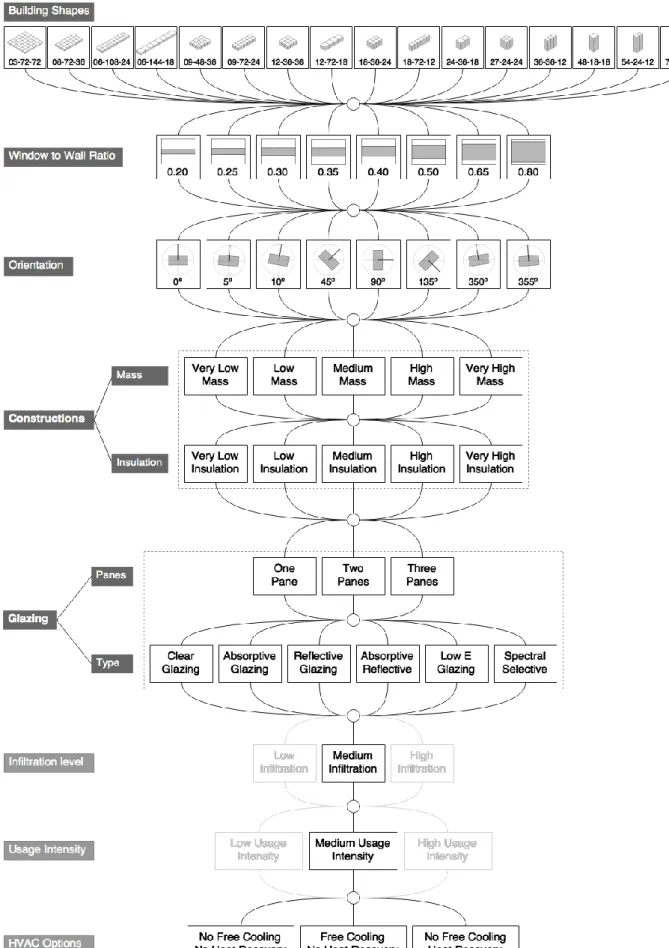
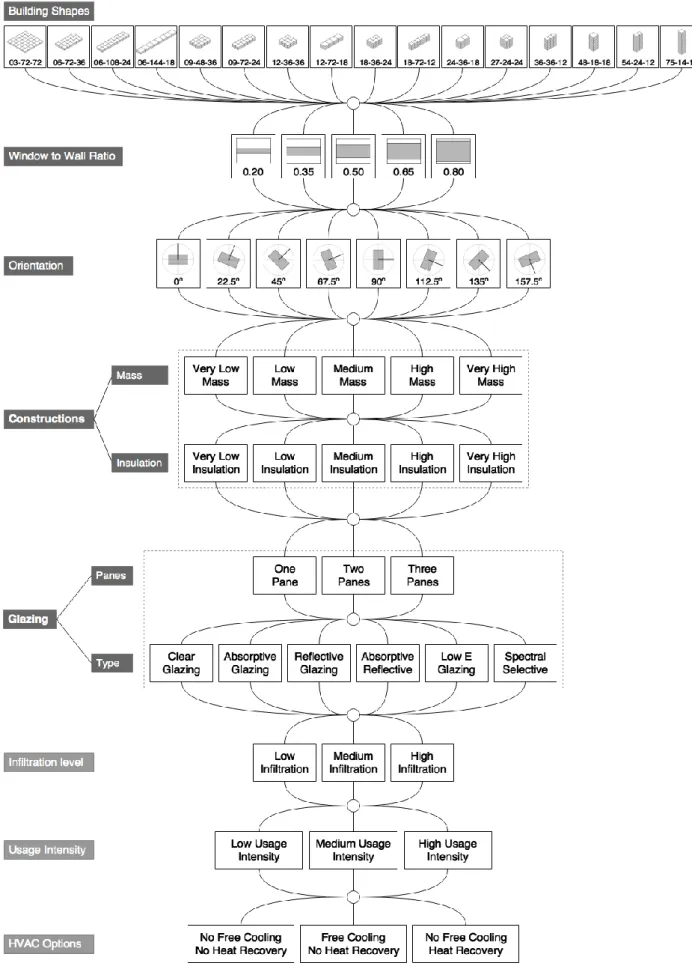
Cómo caracterizar las variables de diseño arquitectónico que tienen mayor impacto en el desempeño energético, ambiental y económico de los edificios. El proyecto paramétrico define siete variables de diseño arquitectónico (forma, proporción de acristalamiento, orientación, masa térmica, nivel de aislamiento, número de vidrios y tipo de vidrio), más tres variables complementarias (nivel de infiltración, intensidad de uso y opción de ahorro de energía del sistema HVAC). ).
Introduction
Research approach
Likewise, the impact of a given WWR will be affected by the composition of the glazing and the orientation of the building. In addition, the relative importance of architectural design variables strongly depends on the site characteristics (climate and microclimate) and building conditions of use (occupancy patterns, internal gains and control systems).
Objectives and scope
What is the relative importance of key architectural design variables taking into account a wide range of performance indicators?. Of course, indoor conditions and comfort levels can be regarded as indicators of building performance, but the methodological implications are beyond the scope of this study.
Methodology and structure of the thesis
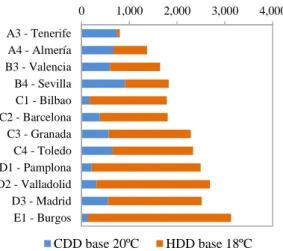
However, the application of these methodologies to such complex objects as buildings still presents serious challenges, including the difficulty of the methodology itself and the lack of reliable data on many building components [35]. e) Four representative Spanish climatic zones were included in the different analyses: A3 - Tenerife, C2-Barcelona, D3-Madrid and E1-Burgos. Although the most extreme climatic regions around the world are not considered, those included in this research offer a range of outdoor conditions broad enough to test and explore the applicability of different analyses.
Parametric simulations project
Introduction
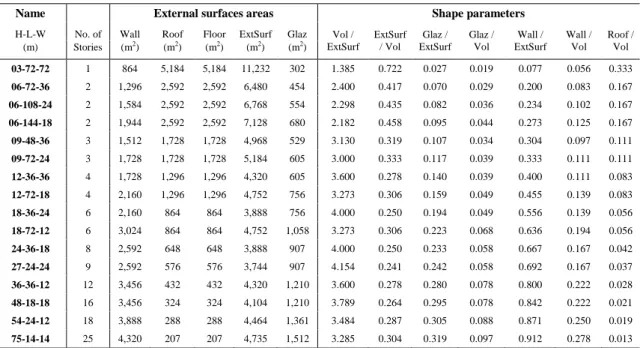
For example, the options for the design variable "orientation" can be defined solely by the parameter "an angle from geographic north". Instead, the options for the design variable "building form" can be defined by combining several parameters such as compactness and aspect ratio.
General characteristics of the project
For example, a cubic volume may be an option to define the overall shape of the building. Design variables that buildings may optionally have are omitted (for example the use of shading devices).
Design options and parameters definition
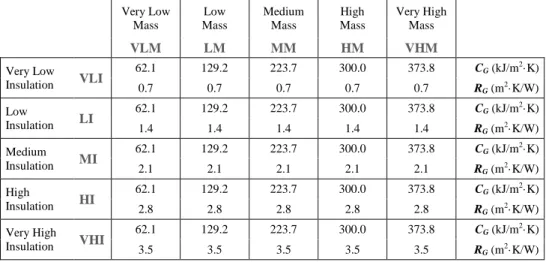
The calculation starts on the surface exposed to the thermal zone, while the effective thickness is always assumed as the minimum of the following values: (1) a half of the construction total thickness;. 2) the thickness of the material layers placed between the exposed surface and the first insulation layer; (3) a predetermined thickness, which depends on the t emperature variation period. Rn is the thermal resistance of the material layers Rse is the external surface resistance.
Application examples
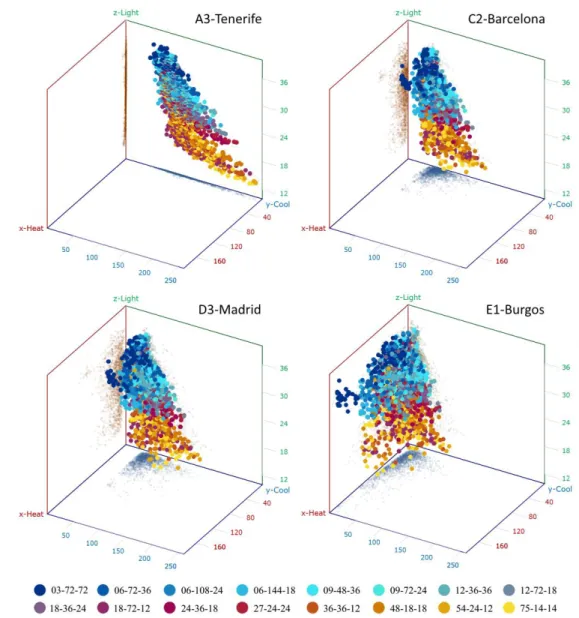
The boxplot diagrams show the distribution of the sum of heating and cooling loads, calculated for the three variables and the 12 climate zones. Although the range of lighting loads, indicated by the position of points on the Z-axis, is very similar in the four climates, the range of heating and cooling loads shows important variations, which give a different distribution of the point cloud in each case. The point clouds in climate zones C2-Barcelona and D3-Madrid have similar shapes, indicating a decrease in the range of cooling loads and an increase in the range of heating loads (compared to climate zone A3-Tenerife).
Regarding the distribution of points by building shape, the graphs of the four climates show similar patterns.
Conclusions
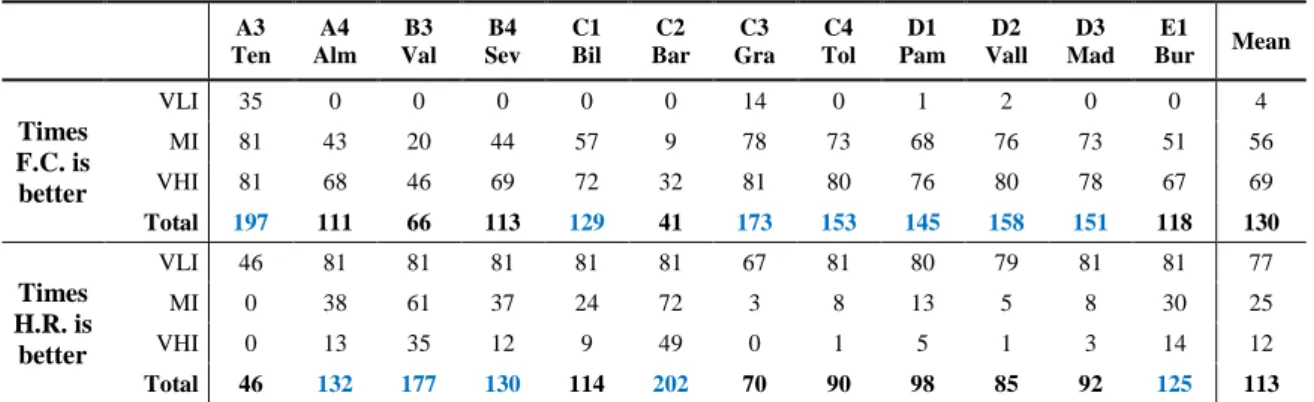
In addition to the visual information provided by graphs, it is important to note that parametric simulations of random samples such as these can serve as the basis for analysis methods that do not require full-space results, such as data mining techniques, sensitivity analysis, and the implementation of artificial neural networks. network. It consisted of an analysis of the energy impact of three secondary variables that took into account all Spanish climate zones: the intensity of use, the level of infiltration and the possibility of saving energy applied to the HVAC system. The results not only provided interesting information on the consequences that these variables have on the energy performance of buildings, but also made it possible to distinguish the effect that the main Spanish climate zones have at all on the energy performance of buildings.
The parametric project formed the basis for more comprehensive studies, allowing the application of methods such as sensitivity analysis, computational optimization and artificial neural networks that can contribute to the goal of having a better understanding of design decisions on environmental and energy performance of buildings.
Optimization of design variables
Introduction
The specific definition of performance targets has changed significantly over time, especially in the first two groups. In the review done by Evins [89], about 60% of the optimization analyzes included this parameter as a performance objective, almost 30% as the unique one. In the review done by Evins [89] about 15% of the optimization analyzes included parameters related to the quality of the indoor environment.
For example, in the review by Evins [89] about 65% of the researchers used a building simulation program.
Methodology
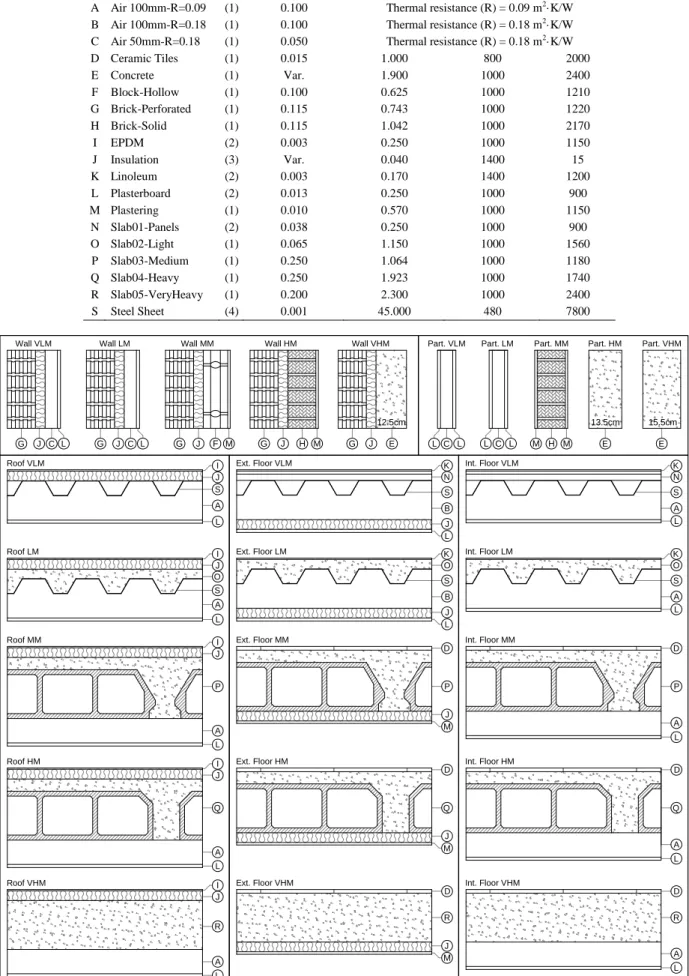
This approach helps create more distributed (less crowded) solution sets. f) The design solutions that will be "parents" to the next generation are selected using a process called tournament. The selected design solutions, i.e. the parents, are processed by two variation operators, crossover and mutation, to create new solutions, the offspring. It is one of the variables that describe the properties of opaque constructions in the parametric project.
It is one of the variables that describe the characteristics of glazing in a parametric project.

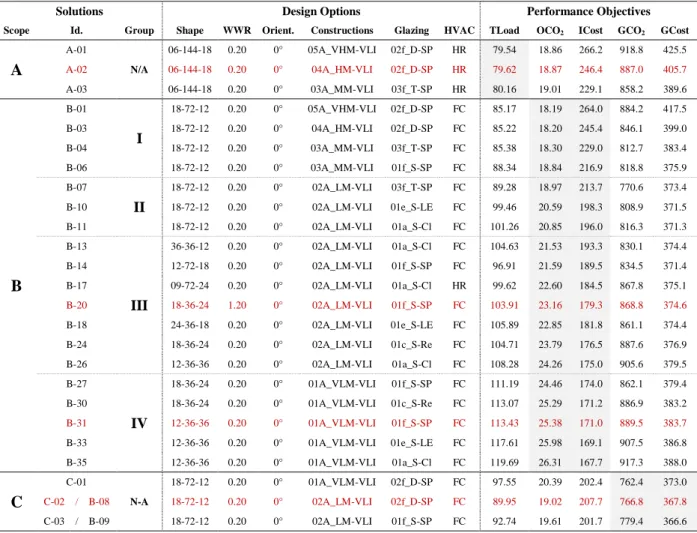
Results
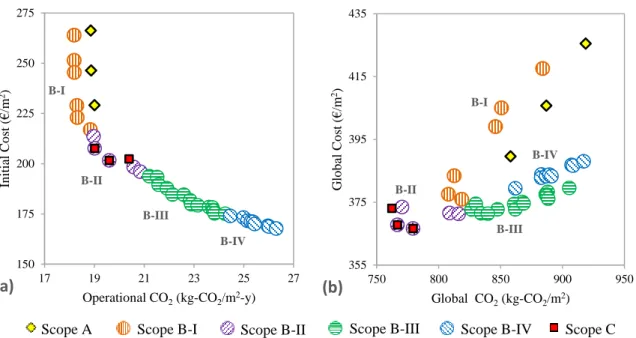
The Group B-II solutions also remain relatively close to the Pareto front of the Scope C analysis. It is the only form in the Scope A solutions for the climate zones C2-Barcelona, D3-Madrid and E1-Burgos. It is the only form in group B-I solutions in all climate zones.
It is the only form in optimal solutions of the Scope C analysis for the climate zones A3-Tenerife and C2-Barcelona.
Conclusions
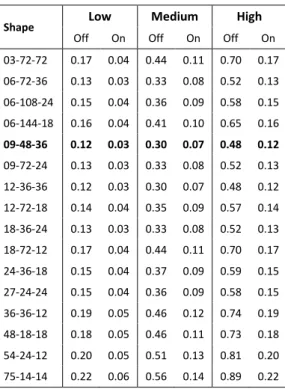
The optimal solutions of the Scope A analysis have 2 or 3 panes in the climate zone A3 -Tenerife, 2 panes in the climate C2-Barcelona, and 3 panes in the climate zones D3-Madrid and E1-Burgos. The optimal solutions of the Scope B analysis, in the four climate zones, tend to have 3 panes in the first groups (higher efficiency in terms of operational CO2) and 1 pane in the last ones (higher efficiency in terms of costs). The free cooling HVAC savings option is the most common in the optimal solutions found in this study, especially for the Scope C analysis.
For example, in the climate zone E1-Burgos, orientations of 350º and 355º are common among the optimal solutions.
Relative importance of design variables
Introduction
The general characteristics of some of the more common sensitivity analysis methods are described below. They are able to quantify all of the output variance due to each input in the model, while also taking into account the effect of input interactions. They are two of the most widely used and well-known methods not only in the field of energy efficiency in buildings, but also in many other disciplines.
It is also believed that sensitivity analysis is only part of the process of understanding the complex relationships underlying building performance.
Methodology
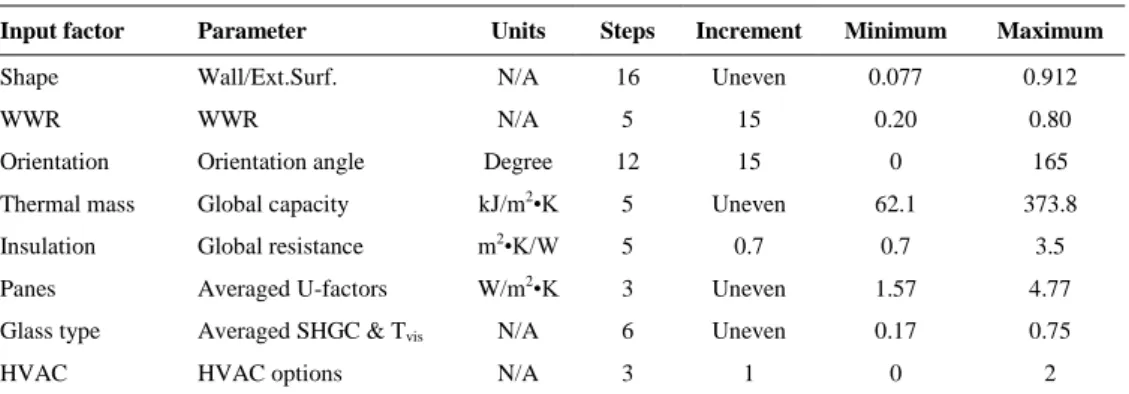
In the second step, a sample solution is created by combining the values of the previously determined input factors. The simulation results are compiled as the values of the output variables to be used in the sensitivity analysis. A brief description of the parametric project is included here, while full details can be found in the mentioned chapter.
This quantity represents the global search space for the sensitivity analysis in each climate zone.
Results
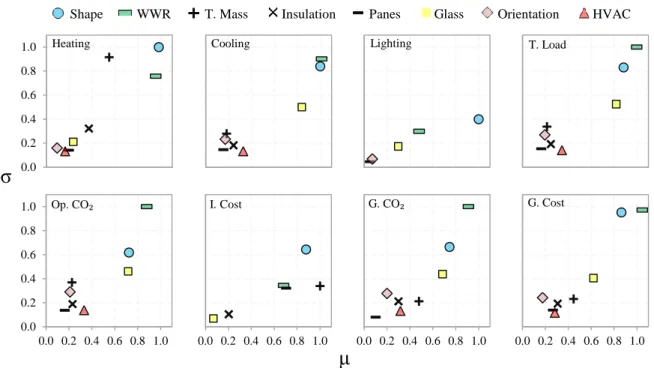
Graphs in Figure 4.8 show the results of the Sobol method corresponding to the first-order index, including the four selected Spanish climate zones. As with the Morris analysis, the significance of the HVAC input factor is moderate and fairly similar in the four climate zones. It is clear from the graphs that there is a significant component of interaction in some of the input factors.
The rank number indicates the position of the input factor, 1 being the most important (with higher impact).
Conclusions
It is a good option for multivariable design models and/or when computational cost is a concern. Its high computational cost represents a significant disadvantage, but it is advisable to use this method whenever possible. In the field of building energy simulation, it is also advisable to explore the use of surrogate models in order to reduce the computational cost of the Sobol method.
In the future, it is advisable to extend the sensitivity analysis of architectural design variables to other building types and climate zones.
Meta-models based on ANNs
Introduction
They state that the method allows the adoption of a holistic approach, which takes into account, simultaneously, all the aspects that affect the performance of the facade. 100] implemented an artificial neural network that, coupled with the genetic algorithm NSGA-II, was used to optimize the thermophysical properties of a housing envelope. According to the authors, the ANN provided fast and accurate estimates of the objective functions used by the genetic algorithm.
Besides the achievement of the previous objective, the meta-models generated using the neural networks can be used to extend and enrich other types of analysis, such as design of experiments, optimization and sensitivity analysis.
Methodology
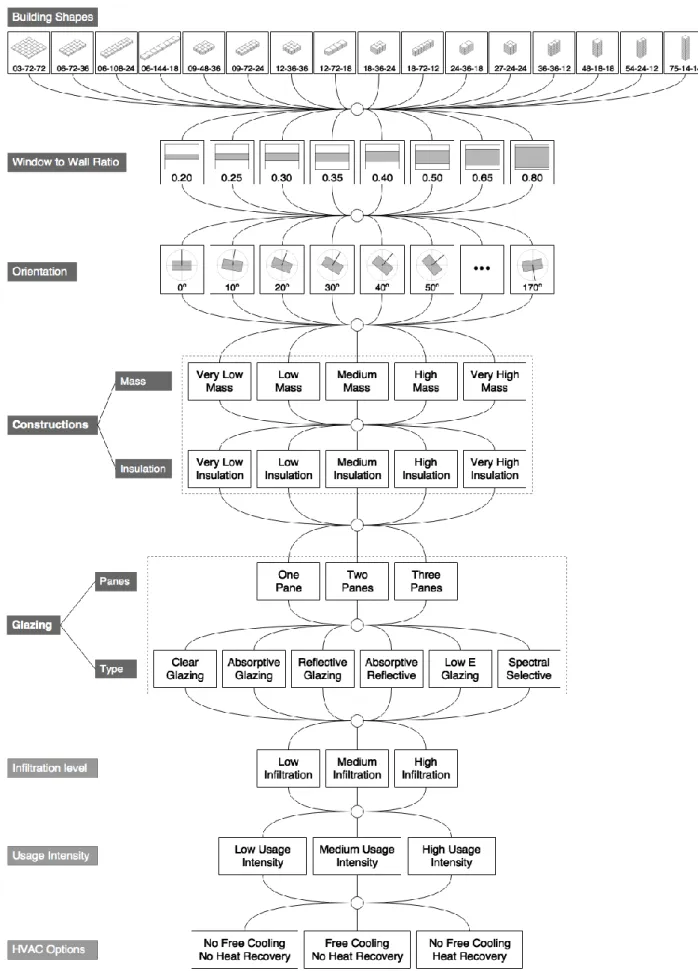
The general structure of the parametric project is illustrated in the schematic tree of figure 5.1. The total sum of possible solutions is what represents the global space for developing ANNs. The amount of polishing is determined in the parametric design by means of WWR, which is a constant value.
The glazing options are defined in conjunction with the ANNs using three input parameters: the U-factor (W/m2•K), the SHGC and the visible transmittance.
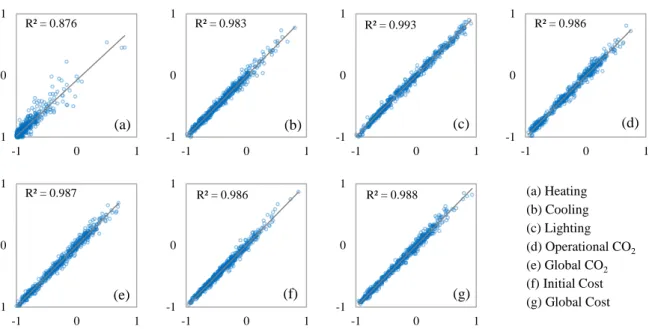
Producing and testing the ANN’s
Furthermore, it is observed that, in general, as the intensity of use increases, the relative importance of the design variables decreases. The only two design variables that consistently show an increase in the Sobol index as intensity of use increases are thermal mass and HVAC option. First-order Sobol indices calculated considering low, medium and high internal gains, climate zone D3-Madrid.
Sobol's first order indices calculated taking into account low, medium and high internal profits, climate zone E1-Burgos.
Conclusions
General conclusions
Future work
Huang, “The Effect of Building Envelope Insulation on Summer Cooling Energy Consumption,” Energy Build., vol. Page, "Effect of thermal mass on the thermal performance of various Australian housing systems", Energy Build., Vol. Jiménez, “Multi-Objective Optimization Combined with Life Cycle Assessment for Building Retrofitting,” Energy Build., vol.
Thellier, “Multi-objective optimization of a building shell for thermal performance using genetic algorithms and artificial neural networks,” Energy Build., vol.