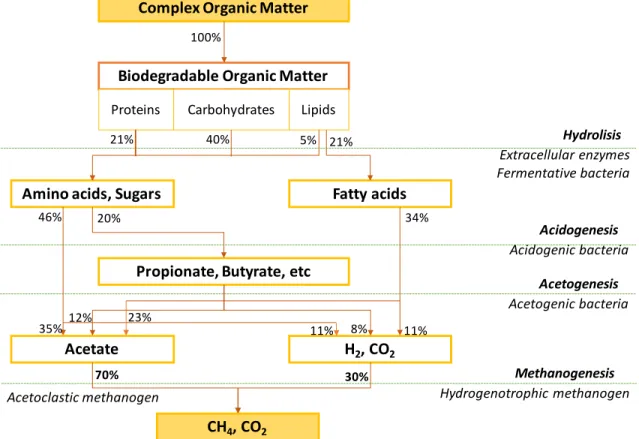
Eskematiko a pannakabagi dagiti kangrunaan a proseso ti panagbalbaliw iti anaerobiko a panagrunaw (nabaliwan manipud iti Gujer & Zehnder, 1983). Guadalupe Hernández Eugenio gapu iti panangsuportana kaniak ken panangipalubosna nga agusar kadagiti alikamen ti Wastewater Laboratory ti Department of Irrigation.
GENERAL INTRODUCTION
However, despite its widespread use worldwide, the biological mechanisms of AD are still not fully understood, mostly due to the complexity of the microbial communities involved (Nelson, Morrison, & Yu, 2011). This is an overview article with the most relevant aspects of anaerobic digestion, and the challenges of degrading chicken litter for this system.
GENERAL LITERATURE REVIEW
Climate changes
Bioenergy and biogas
Biogas is a promising means of solving global energy needs and providing many environmental benefits, as shown in Table 1 (Mao, Feng, Wang, & Ren, 2015; Scarlat et al., 2018). Depending on the raw material, traces of H2 sulfide, ammonia and various volatile organic compounds are also present (Yin Li et al., 2019).

Anaerobic digestion (AD)
- Substrate
- Biochemistry of Anaerobic Digestion
- Microbiome
- Perturbations and stress on AD process
- Key parameters of AD
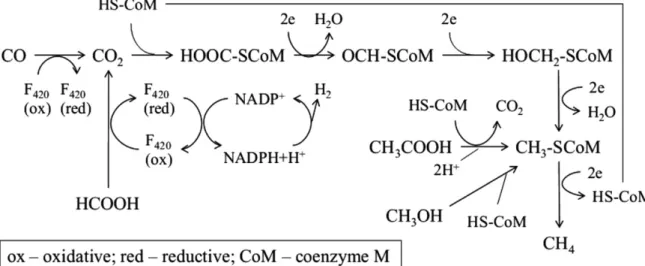
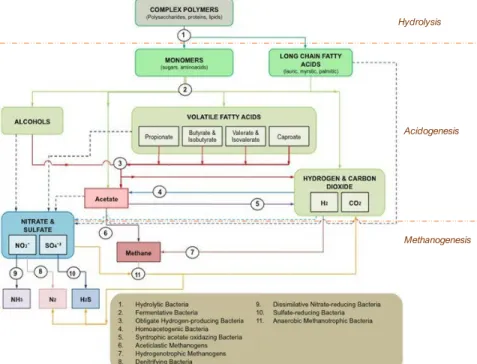
According to Cai et al. 2016), in thermodynamic terms, the overall energy generated via acetoclastic methanogenesis (path i) is the same as the energy generated via acetate oxidation and hydrogenotrophic methanogenesis based on anaerobic syntrophy (path iv) (Figure 4). The ISR is defined as a ratio of active inoculum along with raw material (Mehariya et al., 2018).
Anaerobic co-digestion (AcoD)
The 29 biomass steps are the limiting and responsible factors for biodegradability, bioaccessibility and degradation rates (Hagos et al., 2017). For example, Shah et al. 2015) found that AcoD can increase biogas production from 25% to 400% during monodigestion of the same substrates, which improves economics due to higher methane production.
Analysis of AD system
- BMP
- Metagenome analysis
- Network analysis
31 determine the most efficient way to mix substrates for co-digestion (Hagos et al., 2017). However, both of these methods focus on taxonomic identification and the metabolic pathways present can only be determined indirectly (Cai et al., 2016). For mutualism, for example, there are certain cases of cross-feeding (also known as syntrophy), where two species exchange metabolic products for the benefit of both (Woyke et al., 2006).
Network inference techniques have been widely applied in genomics (Szklarczyk et al., 2010) and are also beginning to be applied in ecology (Milns, Beale, & Smith, 2010).

Evaluation of biochemical methane potential and kinetics on the anaerobic digestion of vegetable crop residues. Anaerobic digestion of chicken manure: Mitigating process inhibition at high ammonia concentrations by selenium supplementation. Comparison of mesophilic and thermophilic anaerobic digestion of chicken manure: Microbial community dynamics and process resilience.
Effect of substrate concentration and temperature on the anaerobic digestion of pig manure in a tropical climate.
ANAEROBIC DIGESTION PROCESS OF CHICKEN LITTER: CONCEPTS,
Abstract
Anaerobic digestion (AD) as an alternative for chicken litter treatment
Usually conceptually divided into three or four stages, hydrolysis, acidogenesis and methanogenesis (Alvarado, Montañez-Hernández, Palacio-Molina, Oropeza-Navarro, et al., 2014). Hydrolytic bacteria are phylogenetically diverse, but mostly fall into two phyla, Bacteroidetes and Firmicutes (Venkiteshwaran et al., 2016). Most species of acidogenic bacteria belong to the phyla Firmicutes, Bacteroidetes, Proteobacteria, Chloroflexi and Actinobacteria (Cai et al., 2016).
Methanoculleus, Methanospirillum, Methanoregula, Methanosphaerula, Methanobacterium, Methanobrevibacter and Methanothermobacter are the most observed hydrogenotrophic methanogens in anaerobic digesters (Cai et al., 2016).
Imbalance of the AD process
Methanosaeta are obligate acetoclastic methanogens known to use only acetate or acetate and electrons obtained by direct interspecies electron transfer (DIET) (Venkiteshwaran et al., 2016). Nevertheless, the efficient conversion of organic matter to methane in an anaerobic digester depends on the mutual and syntrophic interactions of functionally different microorganisms (Akuzawa et al., 2011). However, it is well known that other process parameters, such as substrate type and pH, have a significant impact on the microbial community and methane yield (Stolze et al., 2016).
Volatile fatty acids (VFA), mainly acetic acid, propionic acid, butyric acid and valeric acid, are the main intermediate products during AD of organic waste (Cysneiros et al., 2012).
Role of propionate in anaerobic digestion process
Therefore, it can only be oxidized if a syntrophic association between propionate-oxidizing bacteria and H2-consuming methanogens occurs (McInerney et al., 2009; Bernhard Schink & Stams, 2013). Most of the syntrophic propionate oxidation is accomplished via the Methylmalonyl-CoA (MMC) pathway, which is also referred to as the classical and common pathway (Kosaka et al., 2006). This new dismutation pathway is also known as the Smithella pathway (de Bok et al., 2001).
Smithella species have been found in a variety of anoxic environments, indicating that this pathway is widespread (W. Liu et al., 2016).
Effects of Ammonia on AD
Despite its buffering capacity, NH3 is known to be an inhibitor of various bacteria at high concentrations (Fernandes T.V. et al., 2012). Many previous reports have pointed out that the sensitivity of acetoclastic methanogens to ammonia is much higher than that of hydrogenotrophic methanogens (Banks et al., 2012; A. Schnürer &. The wide range of ammonia concentrations to cause inhibition depends on differences in raw materials, inoculums, environmental conditions (e.g. temperature and pH) (Yenigün & Demirel, 2013) and acclimatization periods (Y. Chen et al., 2008).
High concentration of ammonia can not only lead to lower biogas production and even digestion failure, but also result in ammonia emission from wastewater (J. Park et al., 2010).
Anaerobic co-digestion as an option to improve AD of CL
63 Many previous papers have reported that ammonia can improve the buffering capacity of the AD, because VFA formed during digestion process can be neutralized by NH3 (H. Wang et al., 2015). Ammonia can react with VFA and avoid the inhibition of VFA and to allow enough VFA for biogas production. Nordberg, 2008), and thus more likely to inhibit methane production, due to the accumulation of acetate to inhibitory levels, thus further contributing to a negative feedback mechanism ultimately leading to complete reactor failure (H. Wang et al., 2015) . The FA concentration increases with increasing temperature and pH value, e.g. at pH 7 and 35 °C less than 1% of the TAN is in the form of FA.
In addition, AcoD can provide the following important benefits: (i) improve process stabilization, (ii) dilution of inhibitory and/or toxic compounds, (iii) remedy imbalance of nutrients, (iv) improve the necessary moisture content of the digester feed. , (v), reduce the emission of greenhouse gases into the atmosphere, (vi) facilitate synergistic effects of microorganisms, (vii) adjust the ratio of carbon to nitrogen (C/N) and (viii) increase the load of biodegradable material organic substance (Shah et al., 2015).
Analysis of AD system
- Biochemical methane potential (BMP)
- New technologies for AD analysis
However, this method focuses on taxonomic identification, and the metabolic pathways present can only be determined indirectly (Cai et al., 2016). 66 such as mutualism and competition However, most of those interactions between microbial populations cannot be observed directly, which represents a major challenge for studying population interactions in microbial communities (Wu et al., 2016). Additionally, network analysis can reveal changes in the topology of microbial networks (Ye Deng et al., 2016).
Therefore, network analyzes are considered a powerful tool for studying population interactions in complex microbial communities (Lupatini et al., 2014b).
Conclusions
Network analysis has been used to infer potential interactions between microbial populations by uncovering strong, non-random associations (Faust & Raes, 2012).
Peracetic acid oxidation as an alternative pretreatment for the anaerobic digestion of waste activated sludge. Investigating the effect of high concentrations of volatile fatty acids in anaerobic digestion on methanogenic communities. Microbial electrolysis contribution to anaerobic digestion of waste-activated sludge, leading to accelerated methane production.
Effect of inoculum/substrate ratio on methane yield and orthophosphate release from anaerobic digestion of Microcystis spp.
EMERGENCE OF MODULAR ASSOCIATION NETWORKS DURING
Abstract
Introduction/Rationale
This food web is broadly defined as trophic groups and is believed to be assembled from both deterministic and stochastic processes (Vanwonterghem et al., 2014). When stochastic processes are coupled with prioritized effects, communities with greater site-to-site variations (high β-diversity) in species compositions can emerge under similar, even identical, environmental conditions (J. Zhou et al., 2014). Nevertheless, in microbial communities it is even more difficult to discern the relationship between community assembly and ecosystem functions compared to macroecological systems (J. Zhou et al., 2013).
Although this information does not provide direct evidence of species interactions, it can be co-occurred in network construction using correlation coefficients or other association metrics (Barberán et al., 2012; Shokralla, Spall, Gibson, & Hajibabaei, 2012). .
Materials and methods
- Experimental set up
- Analytical methods
- Modeling and statistical analysis
- Metagenomic analysis
- Taxonomic and Functional Annotation of Metagenomes
- Association network construction
A weighted principal component analysis (PCA) was used to evaluate the effect of chemical parameters (such as pH, TS, VS, COD, N-NH3 and mL of CH4). on the microbial community (species level) and how it changed through the three stages of the methane production process. Data analysis started with quality control using FastQC v.0.11.5 to know the quality of the sequences. The networks were constructed based on three phases of the methane production process: the lag phase, the rapid methane production phase, and the stationary phase.
The visualization of the first correlations of Methanoculleus marisnigri and Methanosarcina mazei was performed using Circos Software (Krzywinski et al., 2009).
Results and discussion
- BMP and physicochemical parameters
- Metagenomic Analysis
- Methanogenic microbial communities and association network
- Network P1. Overcoming disturbances
- Network P2. Stabilizing work correlations
- Network P3. Surviving environmental stress
- Analyzing the three main groups, methanogens, syntrophic
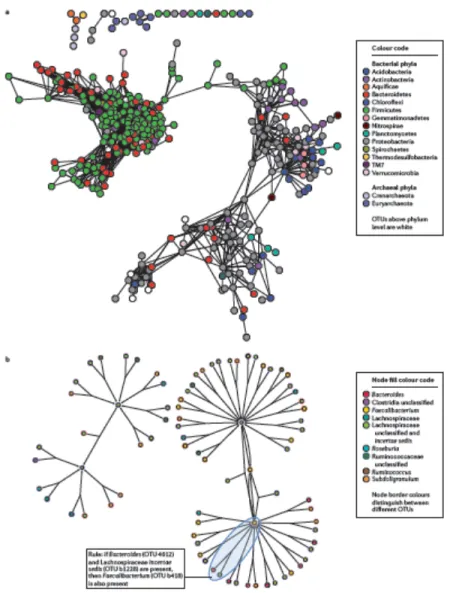
These two parameters modified the environment in the solvent causing toxicity in the methanogenic community (Banks et al., 2012;. Therefore, it participates in an important way in the hydrolysis process together with Fibrobacteres (Treu et al., 2016). In Figure 18, changes in the structure of the microbial community through this process are evident, including their correlations, being different in each phase.
2016) reported that the composition of the archaea community is resilient due to its fundamental role in the biogas microbiome.
Conclusions
Reducing bacteria can grow without sulfate and in some cases they grow only in syntrophic association with methanogens or other hydrogen scavengers. In other words, sulfate-reducing bacteria can compete with methanogen or grow in syntrophy with methanogens, depending on the prevailing environmental conditions.
Acknowledgement
Functional and structural response of methanogenic microbial community in rice field soil to temperature change. Dissecting the microbial community structure and methane production pathways of a full-scale anaerobic reactor digesting activated sludge from wastewater treatment by metagenomic sequencing. Structure and function of methanogenic microbial communities in Uruguayan soils shifted between pastures and irrigated rice fields.
In-depth insight into the structure of the microbial community of anaerobic digestion; biogas microbiome collection expanded with 157 new genomes.
BIOCHEMICAL METHANE POTENTIAL OF CHICKEN LITTER ADDED
- Abstract / Resumen
- Introducción
- Metodología
- Ensayo experimental
- Métodos analíticos
- Modelado de la cinética de producción de metano
- Resultados y discusión
- Conclusiones
- Reconocimientos
- Literatura citada
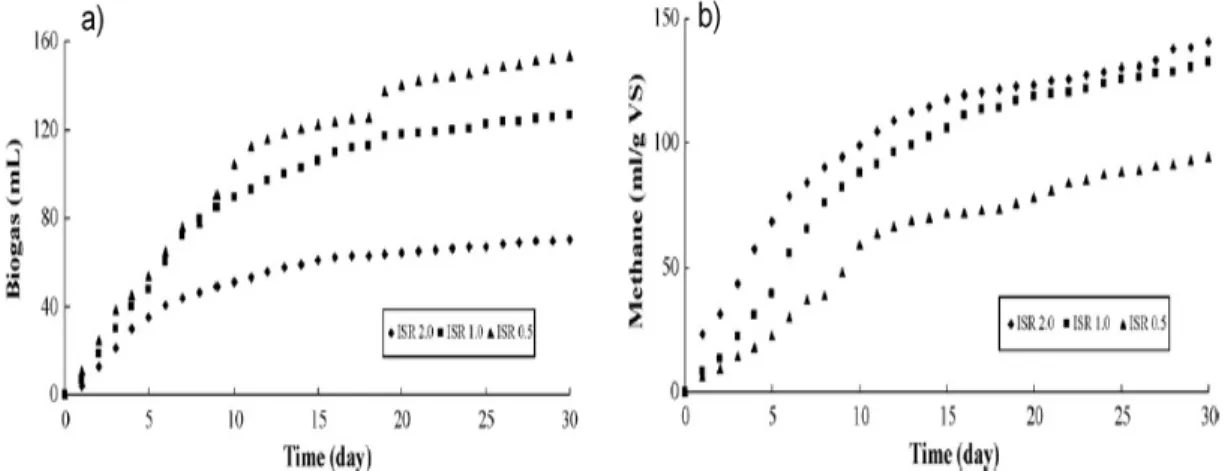
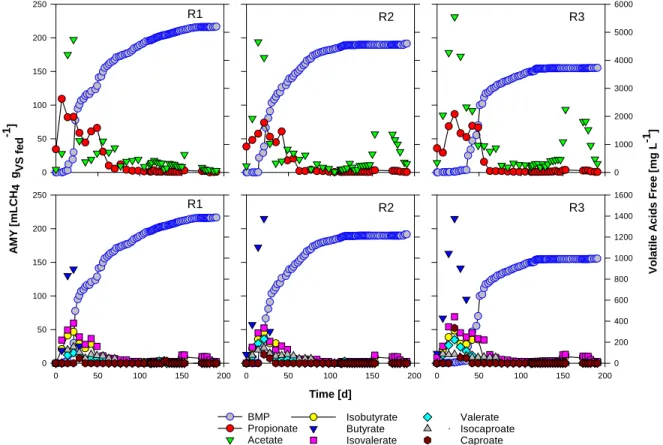
Con base en los resultados observados en la Figura 1 y el valor de µ en la primera etapa (λ = 4,33; µ = 3,86), el primer sigmoide se puede atribuir a una reducción en la concentración de propionato, acompañada de un alivio en la descomposición del butirato. e isobutirato, lo que lleva a un aumento en la producción de metano. Además, en la fase estacionaria se observa que la concentración de propionato e isovalerato aumenta, formando el segundo sigmoide. Por tanto, se puede observar en la Figura 1 que cuando la concentración de AGV es alta, se comienza a producir una mayor cantidad de metano, dando lugar al siguiente sigmoide.
Por otro lado, Acharya et al., (2015) al analizar el uso de cultivos enriquecidos que degradan propionato, acetato y butirato en el proceso de AD sugieren que aumentan la estabilidad del sistema, lo que se reflejaría en mejores rendimientos en el producción de metano.

GENERAL CONCLUSIONS
ANNEXES
- General work scheme
- Metagenome analysis workflow
- General graphical abstract
- Data not presented in the text
- Network analysis
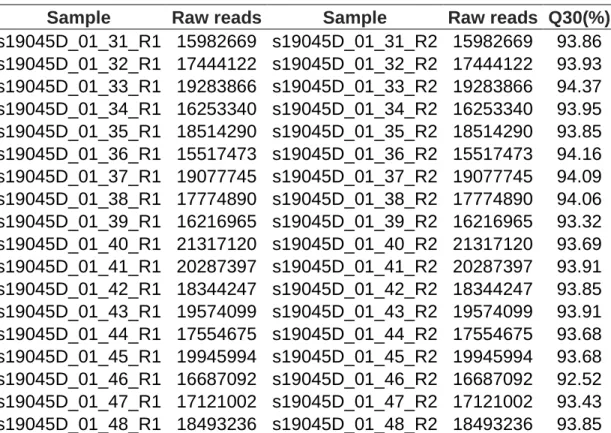
Note: Each example has two readings, forward and backward. This will display two columns with the same number of series.