El dióxido de titanio es el óxido semiconductor más utilizado en la detección de oxígeno. Los sensores basados en TiO2 (normalmente en fase de cristal de rutilo) deben trabajar a altas temperaturas (700 ºC – 1000 ºC), ya que la detección de oxígeno en fase de rutilo se debe principalmente a la difusión de iones de oxígeno en el volumen. material.
INTRODUCTION
Processes that require low oxygen concentration
- Food and Beverage Packaging
- Beverage Carbonation
- Gas Transportation
It makes up 20.9% of the Earth's atmosphere, and besides being indispensable for sustaining animal and plant life in the biosphere, it is widely used for many industrial purposes. Depending on the gas to be transported, the oxygen content in that gas must be between 1 and 100 ppm to prevent corrosion [17, 18].
![Table I.1 ISBT carbon dioxide guidelines [14-16]](https://thumb-us.123doks.com/thumbv2/123dok_es/5793420.5475730/25.807.246.584.409.673/table-isbt-carbon-dioxide-guidelines.webp)
Usual Technologies Employed for Oxygen Detection
- Near-Infrared (NIR) Photodetectors
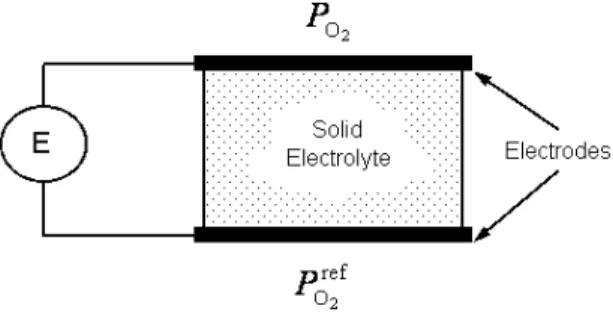
- Zirconia Based Sensors
In this case, the ion current through the electrolyte is proportional to the partial pressure of oxygen in the sample gas and is measured by the electrodes [23]. In general, the use of solid-state materials (eg, solid electrolytes, semiconductors) in the field of gas detection has contributed to improved sensitivity of portable gas analyzers and reduced costs.
![Figure I.2 a. Zirconia oxygen sensor (EMCO Packaging System) b. Oxygen analyzer System with electrochemical zirconia sensor (Cambridge Sensotech Ltda.) [24, 25]](https://thumb-us.123doks.com/thumbv2/123dok_es/5793420.5475730/27.807.145.693.470.669/figure-zirconia-packaging-analyzer-electrochemical-zirconia-cambridge-sensotech.webp)
Solid State Oxygen Sensors: State of the Art
- Electrochemical Sensors
- Potentiometric
- Amperometric
- Optical Sensors
- Semiconductor Metal Oxide Sensors
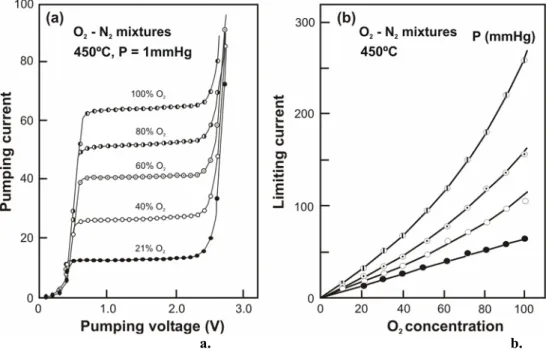
Then the current saturates at a value that depends on the molecular flow of oxygen along the diffusion barrier. Macroscopically, this means an additional decrease in electrical resistance in the presence of a reducing gas.
Objectives
- Substrate Development
- Active Material
- Sensor Characterization
Based on the results obtained from material characterizations, an improvement of the detection capabilities of the materials will be aimed at by optimizing their physical properties. The detection capabilities will also be featured with different working temperatures (300 ºC, 400 ºC, 500 ºC and 600 ºC) to know the optimal one.
34;Design, Fabrication and Characterization of a Miniaturized Series Connected Potentiometric Oxygen Sensor", Sensors and Actuators B, Vol. Liu, "Development of a Silicon-Based Yttria-Stabilized-Zirconia (YSZ), Amperometric Oxygen Sensor", Sensors and Aktuatorer B, bind.
FABRICATION PROCESSES
Introduction
Substrate
- Type I Substrate
- Characterization of Isolating Layers
- Heater Characterization
- Packaging
- Type II Substrate
The breakdown and the pressure are individually set for each type of sensor's layer. At this temperature, nanoparticles of the powder are annealed to adhere to each other and to the substrate. As previously explained, three insulating layers are applied between the heater and the electrodes to ensure adequate electrical insulation of the heater.
The heater meander is designed to ensure homogeneous distribution of the sensor temperature, because these sensors must work at temperatures higher than 300ºC. The corresponding current with the applied voltage was measured by means of the multimeter (HP 34401A). The maximum relative error of the power consumption is 6.6% if the temperature is set according to the linear regression.
![Figure II.3. The paste selection and the procedure of sensor fabrication by screen-printing is described below [12, 13]](https://thumb-us.123doks.com/thumbv2/123dok_es/5793420.5475730/68.807.187.620.221.701/figure-selection-procedure-sensor-fabrication-screen-printing-described.webp)
Active Material
- Material Synthesis
- Sol-Gel Process
- Drying Process
- Firing Process
- Active Layer Deposition
The weighting average of the crystallite sizes, performed as in the previous cases, is shown in Table III.12. The results of the quantitative analysis of these patterns are shown in Figure III.12. At this point (500 ºC) there is a bend in the recovery time values.
The sol-gel route used in the preparation of the M10 material is presented in Figure IV.12.

TiO 2 AND Nb-DOPED TiO 2 CHARACTERIZATION
Introduction
In this chapter, the results of the physical characterization of the Titania-based materials, the synthesis of which was explained in the last chapter, are presented. Inductively Coupled Plasma (ICP) spectroscopy was used to determine the chemical composition of the samples and quantify the amount of each component. Area BET measurements were performed on nanopowders to know the surface area and porosity of each material.
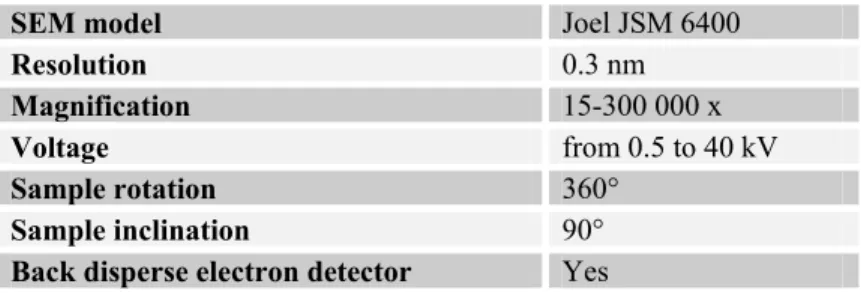
Scanning Electron Microscopy (SEM) was used to obtain details of film structure and grain size. The sensors' responses to other pollutant gases (SO2, CH4, H2S and C2H4) were also tested to see the influence of such gases in the oxygen detection process. Each of these measurements is presented in a separate subchapter, including a small description of the method used, the results obtained and their discussion.
Powders Characterization
- Inductively Coupled Plasma (ICP)
- Experimental Set-Up
- Results and Discussion
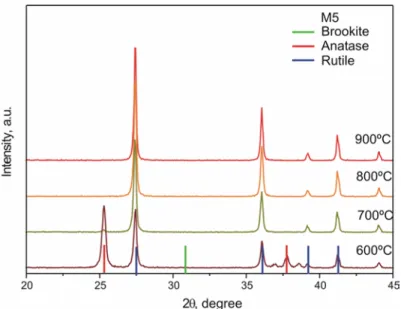
- X-Rays Diffraction (XRD)
- Experimental Set-Up
- Results and Discussion
- Area BET
- Experimental Set-up
- Results and Discussion
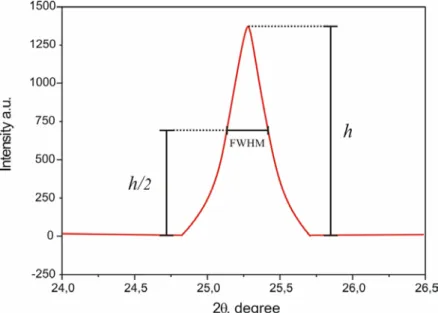
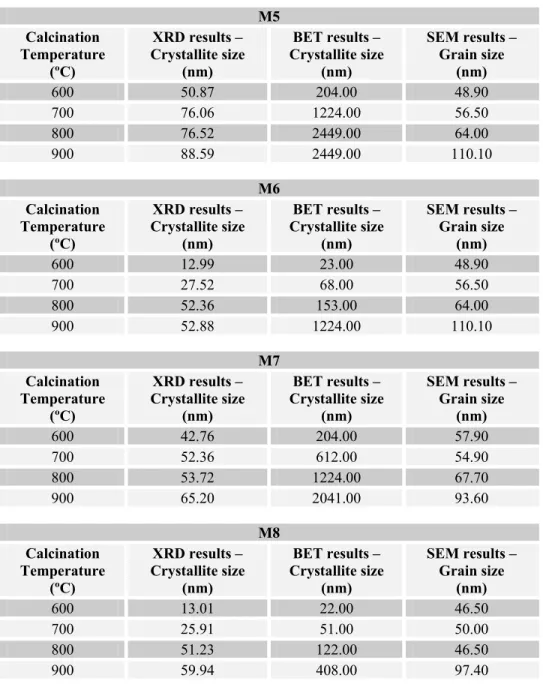
The crystallite size was extracted from the FWHM of the main peak for each phase (Figure III.4). The change in size in anatase crystallites with increasing the calcination temperature is summarized in Table III.3. This size is increased as the change of phase in the crystalline structure of the material is produced.
The earlier the phase transition (the lower the temperature for the transition), the faster the growth of the crystallites. The changes of crystallite size with increasing the calcination temperature of anatase and rutile phase are summarized in Table III.10 and Table III.11 respectively. By comparing Table III.3-4 and Table III.10-11, it is possible to see that the size of the crystallites in M7 is smaller than in M5, in both anatase and rutile.
Active Layer Analysis
- Scanning Electron Microscopy (SEM)
- Experimental Set-up
- Results and Discussion
- Energy-Dispersive X-ray Spectroscopy (EDS)
According to the histogram of the material M5-600 (Figure III.18), the grains have an average diameter of about 60 nm (Table III.20). Still, it could be observed that the increase of the grain size in the material M6-900 is very significant compared to M5-900. The mean diameter of the grains in M8 calcined at 600 ºC is the smallest of all materials calcined at the same temperature.
When the M8 material is calcined at 900 ºC, the grain size experiences a remarkable increase similar to that experienced by the M6 material when calcined at the same temperature. The behavior of M8 material at temperatures below 800 ºC can be explained in the same way as M7. The contribution of these two phenomena is the reason for the smaller grain size of the M8 material when it is calcined at temperatures below 800 ºC.
Sensor Characterization
- Oxygen Sensing Characterization in N 2
- Experimental Set-up
- Results and Discussion
- Sensing Characterization in CO 2
- Experimental Set-up
- Results and Discussion
The responses of sensors fabricated with M6 based materials toward 20 ppm oxygen and operating at various temperatures are summarized in Table III.26. The responses of sensors fabricated for M7 based materials toward 20 ppm oxygen and operating at various temperatures are summarized in Table III.27. The responses of sensors fabricated for M8 based materials toward 20 ppm oxygen and operating at various temperatures are summarized in Table III.28.
Similarities were expected in the response of both materials (M6 and M8), due to the similarities in their physical properties. It can be observed that at 300 ºC the response of the sensor is the slowest. In the recovery time, it can be understood that the values are smaller than the response time values.
![Figure III.25 Schema of the gas measurement system employed to test the Titania based sensors developed in this work [29]](https://thumb-us.123doks.com/thumbv2/123dok_es/5793420.5475730/129.807.107.728.245.606/figure-schema-measurement-employed-titania-based-sensors-developed.webp)
Raman Spectroscopy
- Experimental Set-up
- Results and Discussion
- M6 600
- M6 700
Then the temperature of the layer was increased to 200 ºC and 500 ºC, and the same measurements were made. As noted for XRD results, the presence of a significant amount of brookite phase in the material M6-600 could be one of the reasons of the low response of such material to traces of oxygen. Raman spectra at higher frequencies shed more light on the reasons for the lower response of M6-600.
These carbon deposits are residues of the synthesis process that cannot be eliminated during calcination. An example is the peak located at 1039 cm-1 in Figure III.44a, which clearly matches one of the main peaks in the spectrum of ammonium carbonate used for gelation of sol (Figure III.45). Parker and Siegel [54] suggested that the shift of the anatase peaks is related to the oxygen stoichiometry of the material.

Conclusions
BET analysis gives the size of the smallest solid structure (without pores) that is completely surrounded by gas. A possible explanation for this low response could be the brookite phase contained in the doped materials calcined at 600 ºC; at this temperature, the crystallinity of the brookite particles improves with the consequent reduction of surface defects that can affect the adsorption of oxygen species on the surface. These carbon deposits are a residue of the synthesis process that could not be removed during calcination.
The problem with these carbon deposits is that they cover the surface of the active material and prevent its interaction with oxygen. Calculations of the response and recovery time of the sensors showed that these parameters do not depend on the crystalline phase, but on the calcination temperature. This phenomenon was explained as the effect of the type of CO, from the dissociation of CO2, which is adsorbed on the surface of the active material, in the low concentration of oxygen species.
Mastrangelo, "Dopants in Vapor-phase Synthesis of Titania Powders", Journal of the American Ceramic Society, Vol. Danner, "Equilibrium Adsorption of Oxygen, Nitrogen, Carbon Monoxide, and Their Binary Mixtures on 10X Molecular Sieves," Journal of Chemical & Engineering Data Vol. Teller, "On a Van Der Waals Theory of the Adsorption of Gases," Journal of the American Chemical Society Vol.
34; Effects of Nb doping on the anatase to rutile phase transition of TiO2", Journal of Applied Physics, Vol. Egdell, "Use of V-doped TiO2 as a sensor for SO2 detection", Journal of Materials Chemistry, Vol. 34;XPS, EM and Catalytic Studies of Carbon Accumulation on Pt sajna", Journal of Catalysis, Vol.
MESOPOROUS Nb-DOPED TiO 2
Introduction
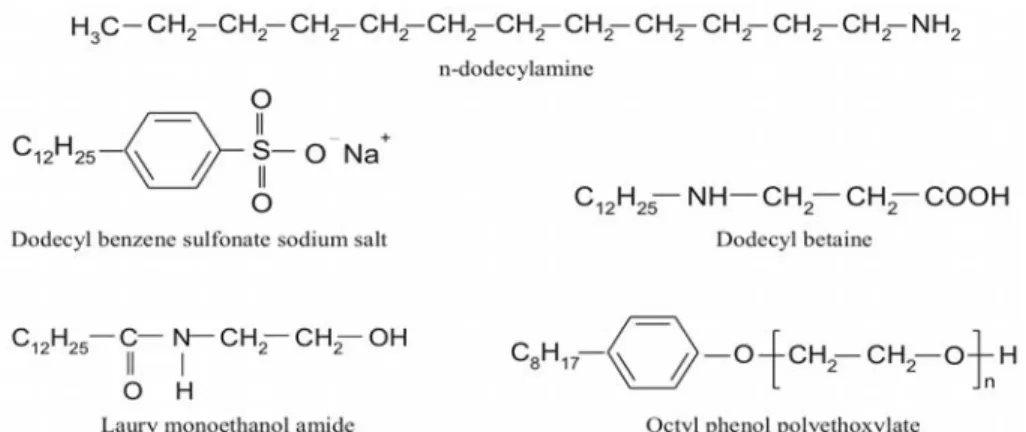
- Surfactants
- Properties of Surfactant Solutions
- Adsorption
- Self-Association
- Interfacial Phenomena
- Synthesis of Mesostructured Titanium Dioxide
Here, the relative polarity of the solid to the liquid would determine whether the surfactant adsorbs at the head or at the tail (Figure IV.2). The calculation of the CMC value is not easy because it is highly dependent on the acidity of the substance, the temperature and other physical properties of the surfactant. The properties of the surfactants described in section IV.1.2 are used to obtain mesostructured materials.
The micelle structures or micelle arrays act as a mold for the metal oxide species, producing an ordered hybrid array composed of the metal oxide and the surfactant. The surfactant can also be used as a dispersant at later stages of the synthesis process, as described in section IV.1.3. In this way, the surfactant slows down the coalescence of the material particles which reduces the size of the final granules.
Material Preparation
- Mesoporous Nb-Doped Titania: First Approach (M9)
- Material Synthesis
- XRD Results
- SEM
- Mesoporous Nb-Doped Titania: Second Approach (M10)
- Material Synthesis
- XRD Results
- SEM
- Mesoporous Nb-Ddoped Titania: Third Approach (M11)
- Material Synthesis
- XRD Results
- Area BET
- SEM
- Oxygen Sensing Characterization
- RAMAN
A possible explanation is that the surfactant molecules avoid the insertion of niobium ions into the titania lattice. Thus, the effects of niobium ions on the material, related to the crystalline phase transition, are inhibited. Histograms of grain sizes are presented in figure IV.11 and the evolution of the grain diameter of this material is summarized in table IV.5.
This improvement in the material characteristics is probably due to the addition of the surfactant during the synthesis process. Finally, in Table IV.14 the weight average of the crystallite size in each material is shown. However, the values of the BET grain size of M11 calcined at 900 ºC are not equivalent.

Conclusion
CONCLUSIONS
![Figure I.11 Characteristics of an amperometric sensor in the flue of a combustion system burning natural gas in air [64]](https://thumb-us.123doks.com/thumbv2/123dok_es/5793420.5475730/39.807.226.605.104.442/figure-characteristics-amperometric-sensor-flue-combustion-burning-natural.webp)
![Figure I.19 Resistance characteristics of a TiO 2 thin film oxygen sensor in different partial pressure of oxygen [114]](https://thumb-us.123doks.com/thumbv2/123dok_es/5793420.5475730/52.807.214.576.122.388/figure-resistance-characteristics-oxygen-sensor-different-partial-pressure.webp)